MACD Signal alert
- 指标
- Adam Zolei
- 版本: 1.0
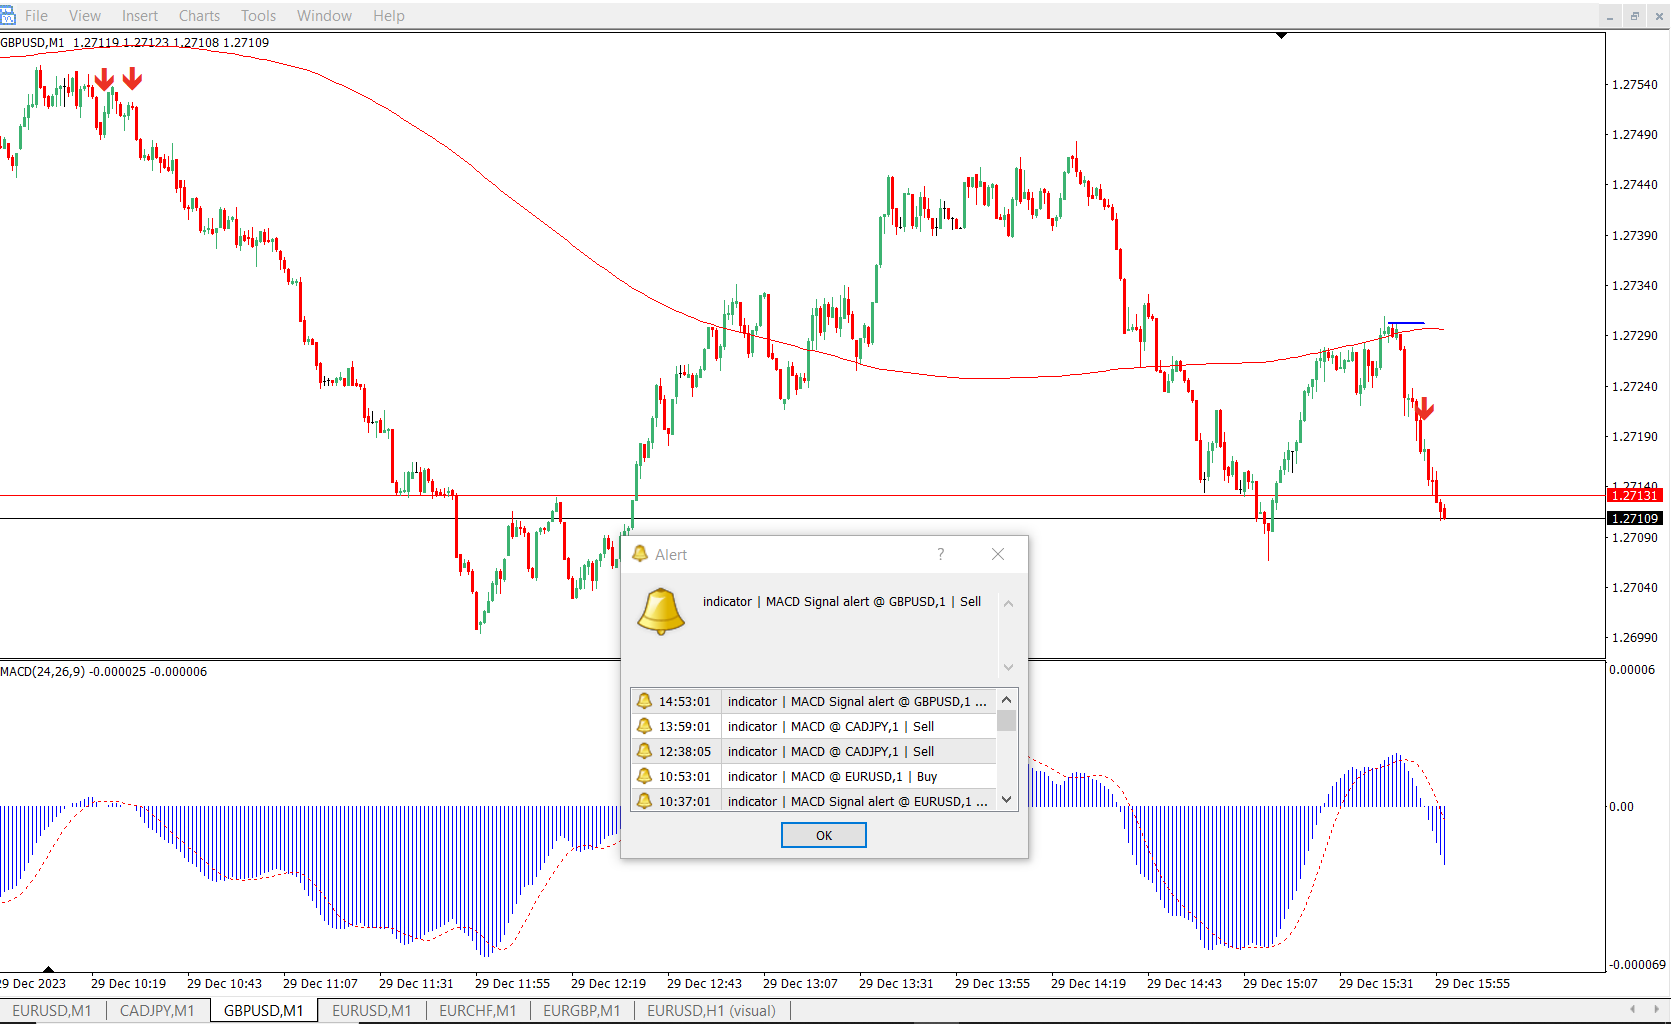
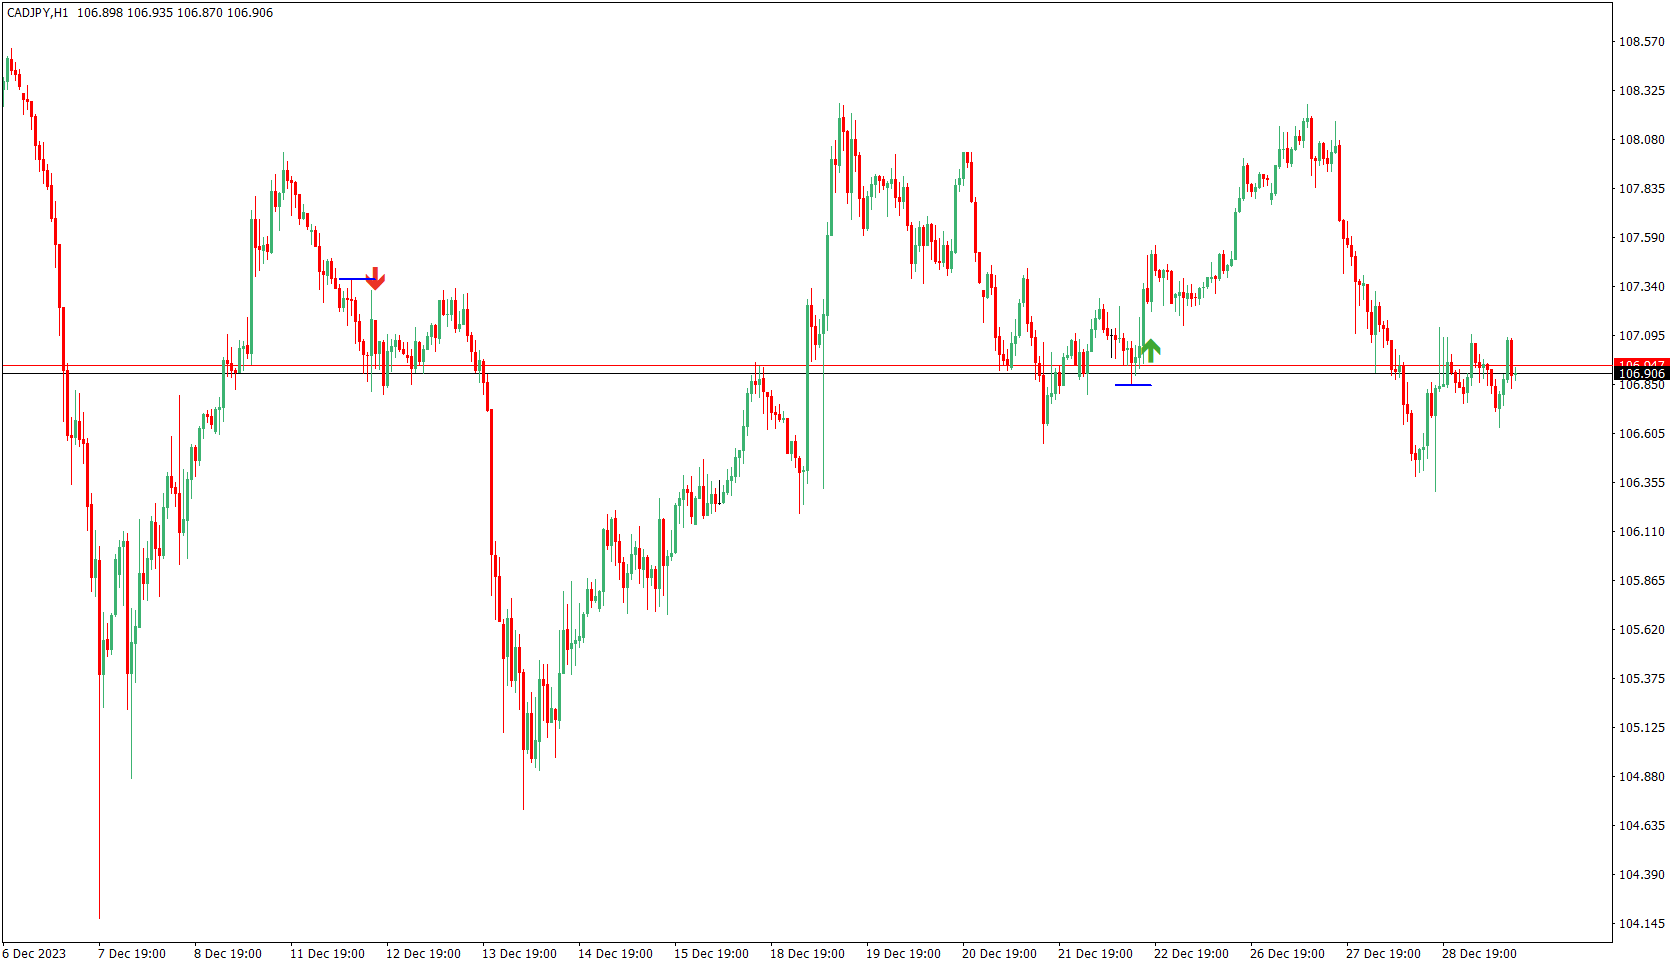
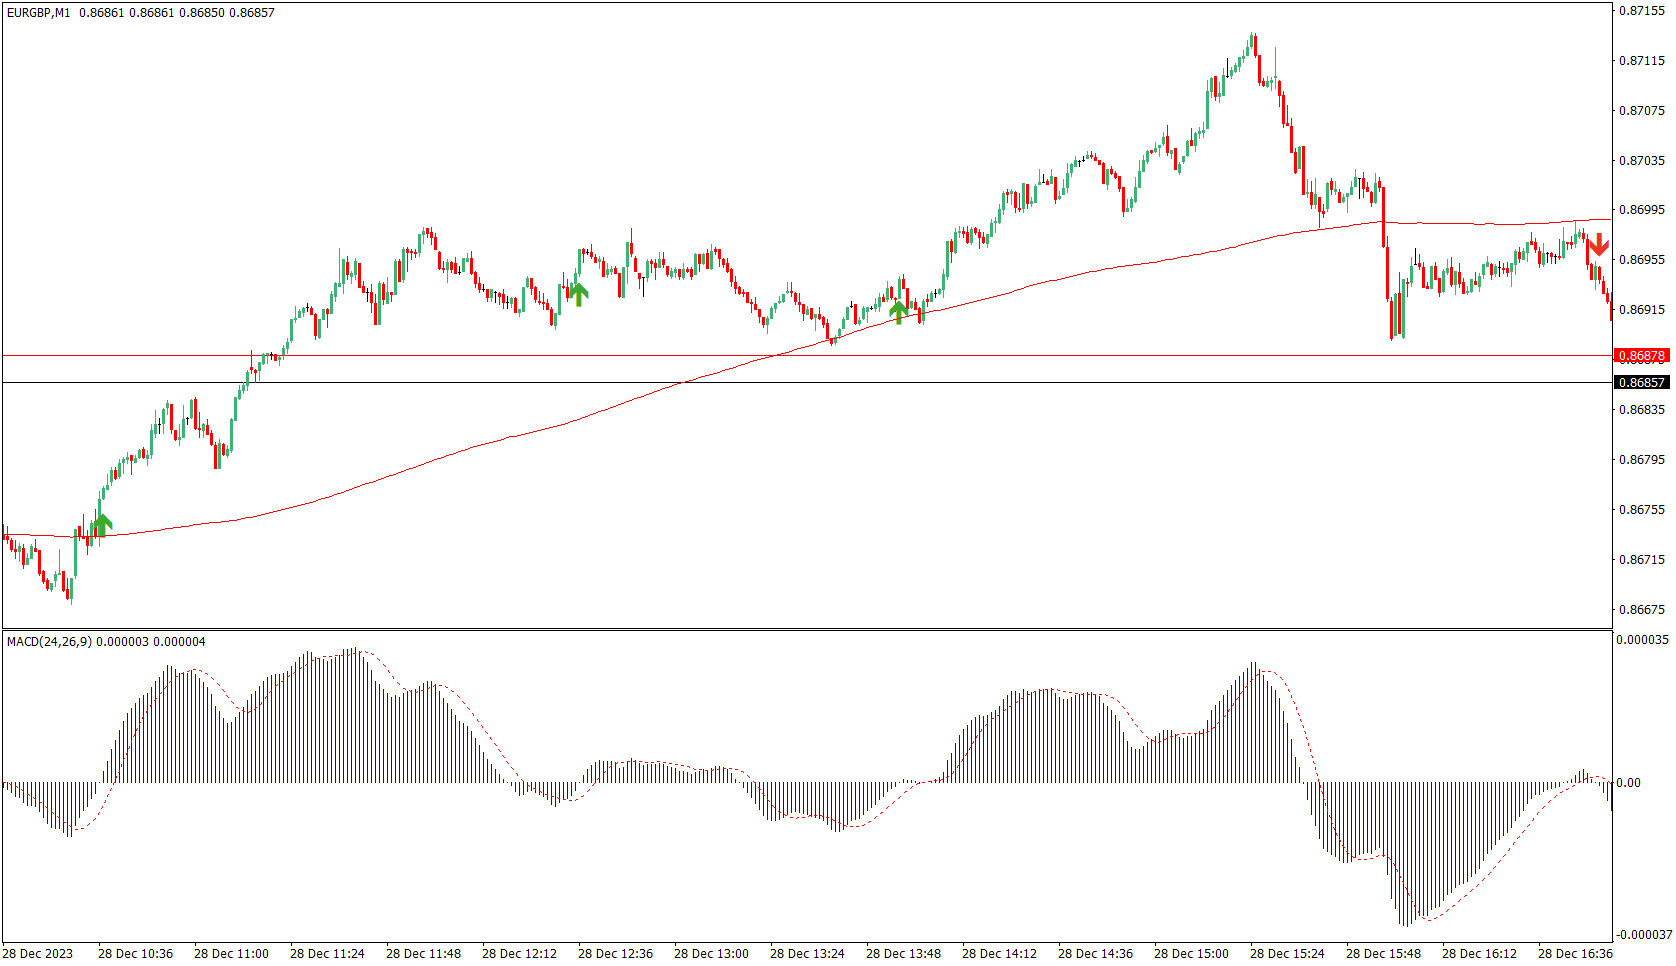
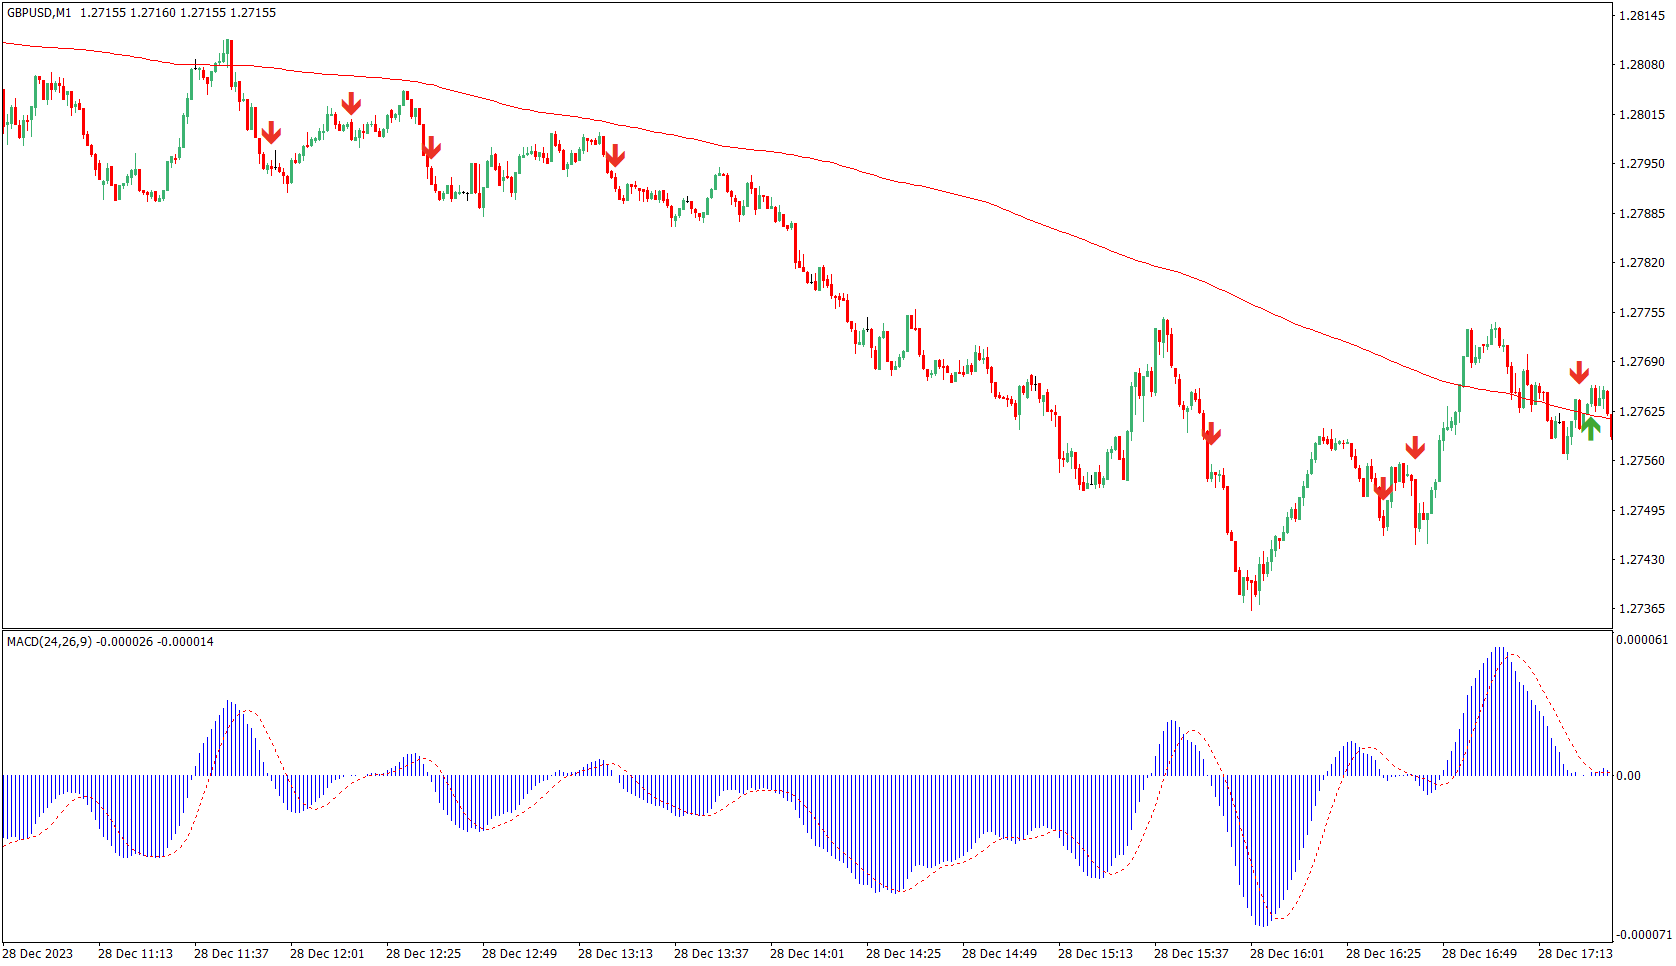
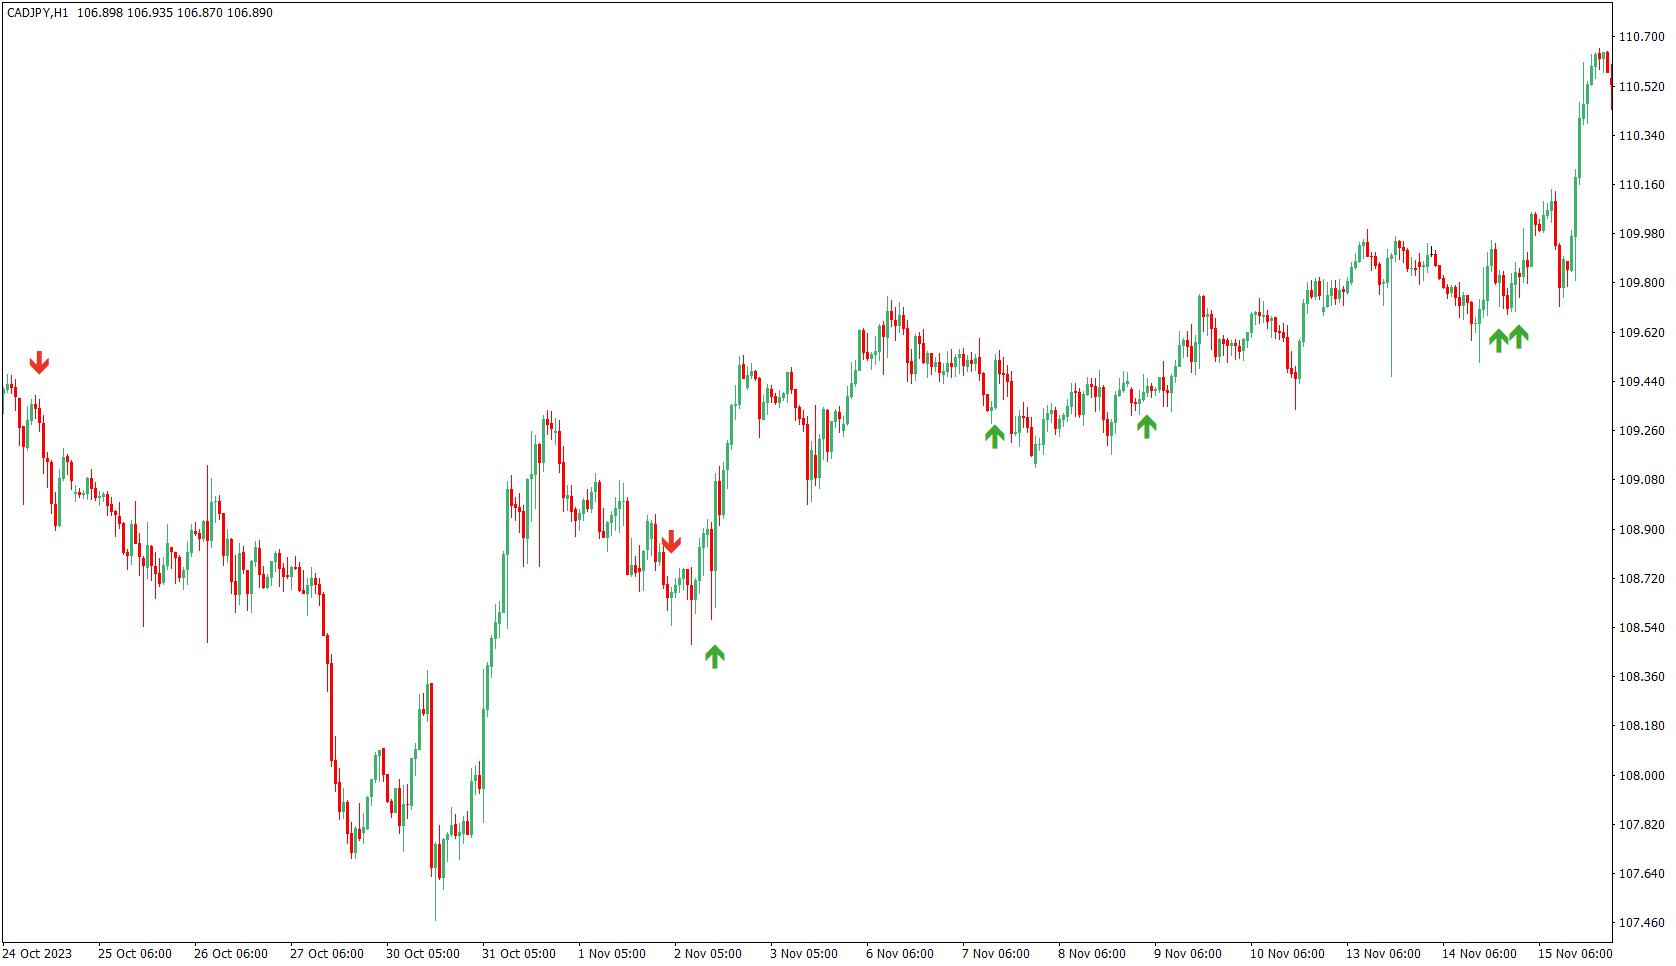
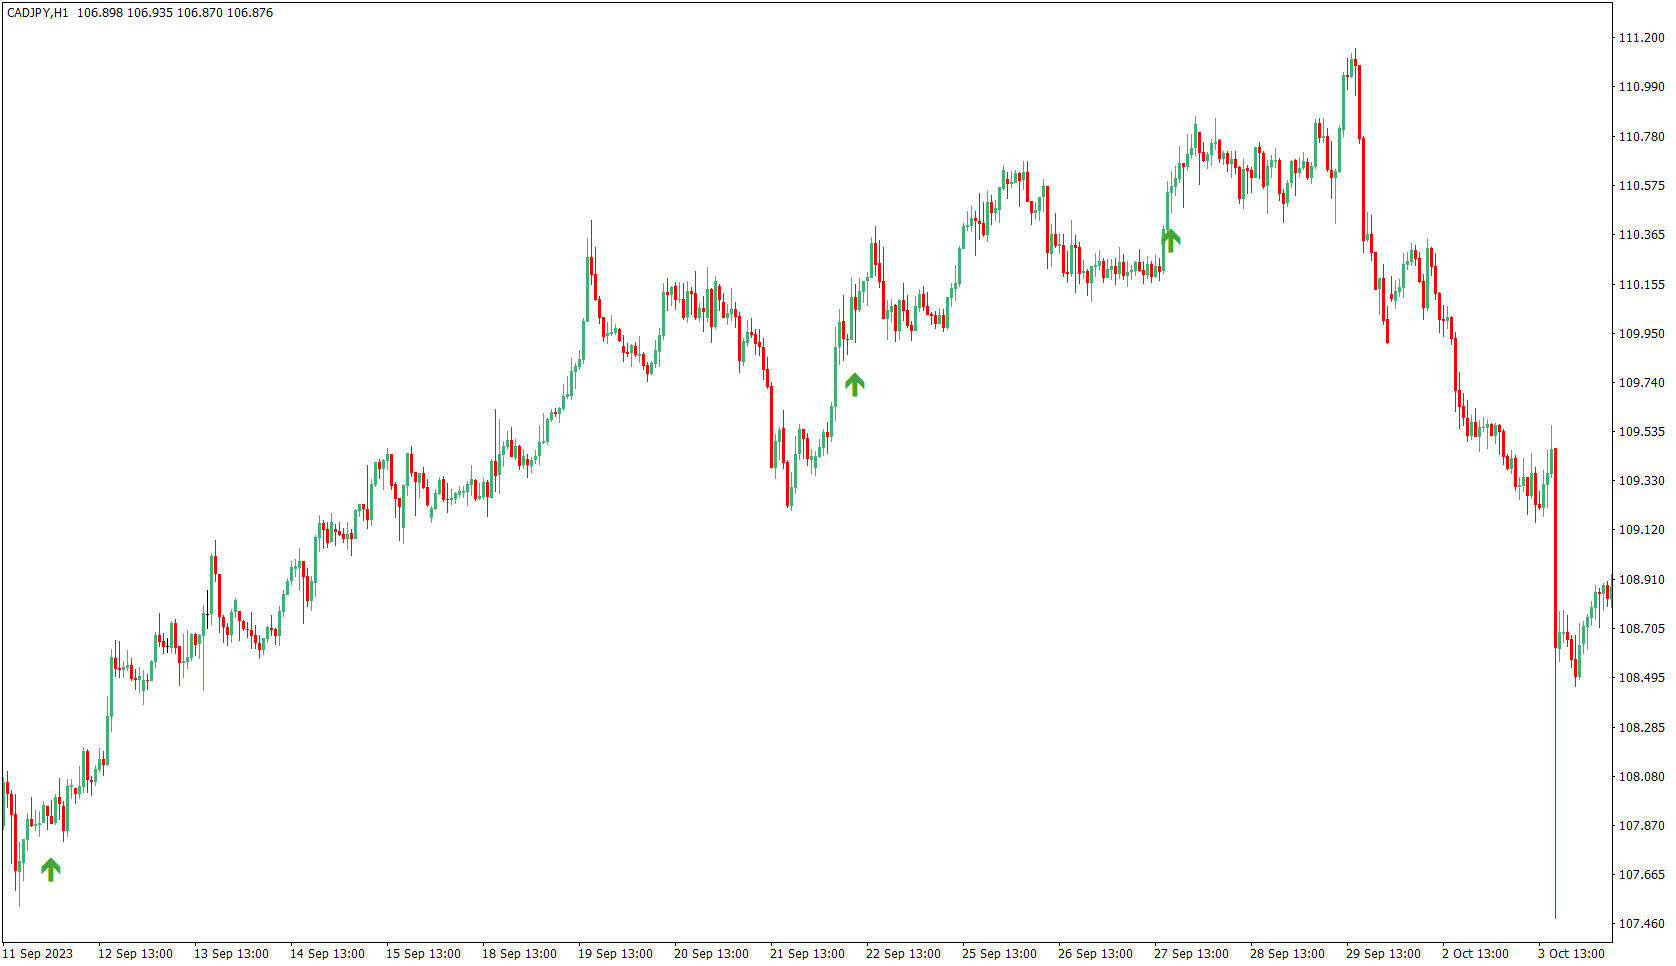
这是一种基于MACD的趋势跟踪指标,当处于200 MA之上时提供买入信号,当低于200 MA时提供卖出信号。当MACD穿过零线时,将生成信号。此指标还展示了可用作止损的支撑和阻力水平。
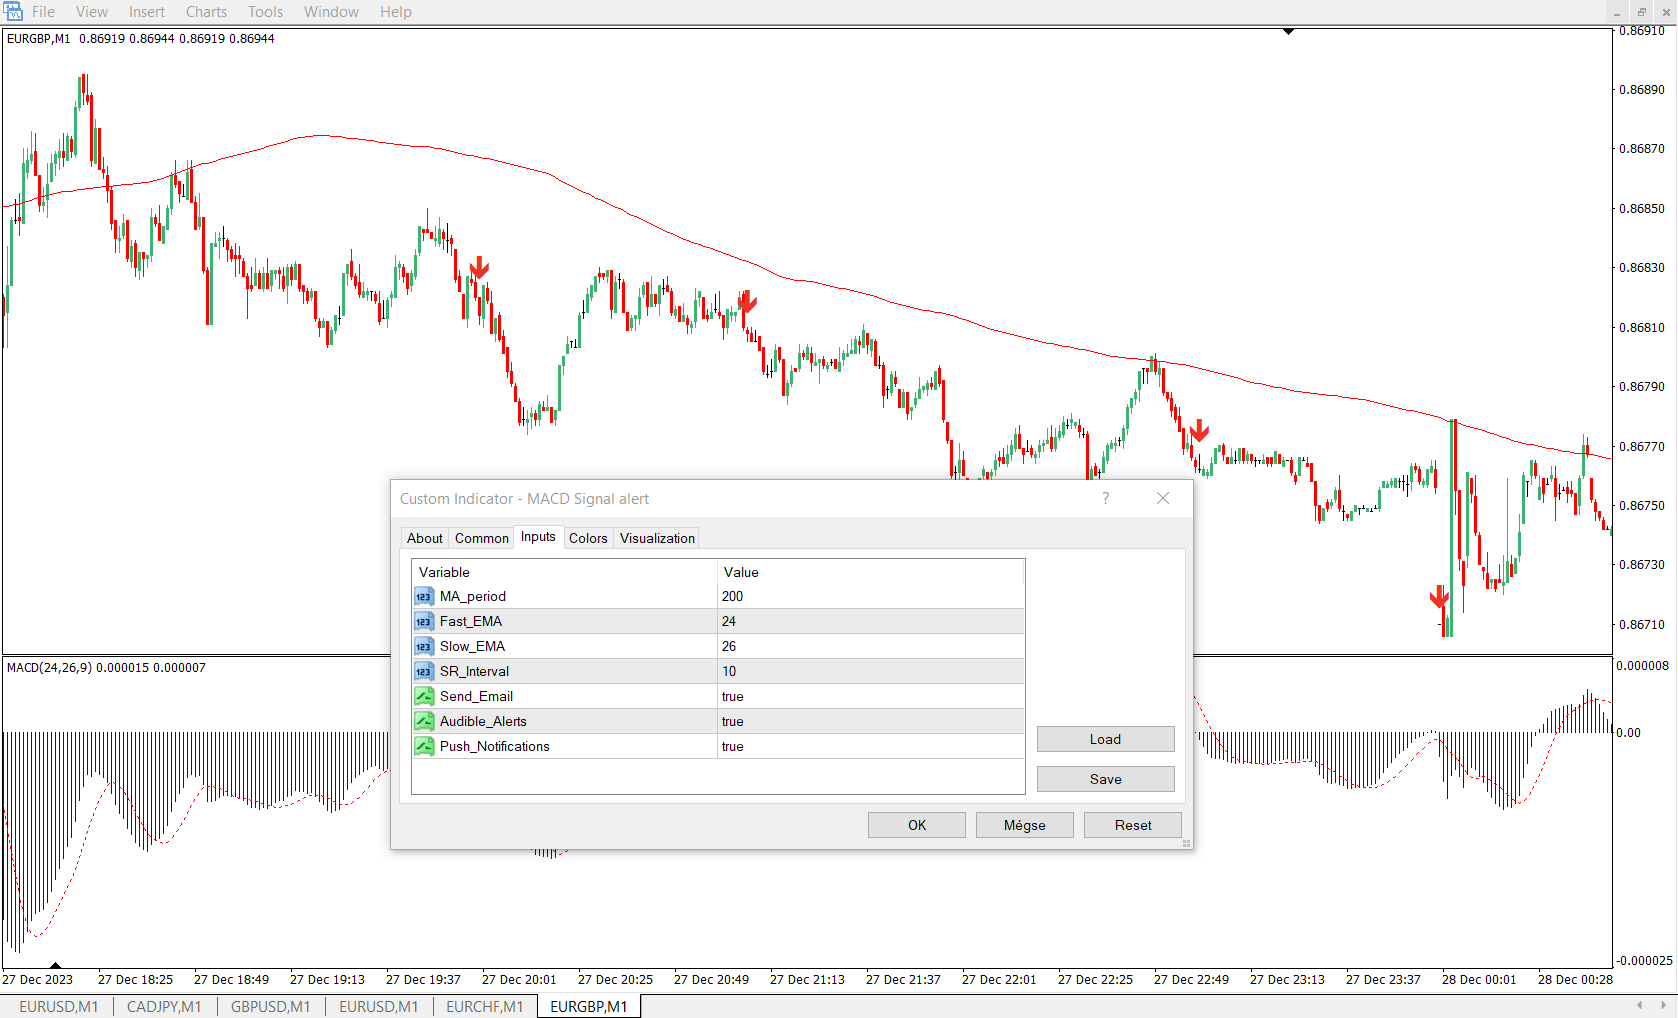
可调整的参数包括MA周期、MACD快速EMA、慢速EMA以及支撑-阻力间隔。它绘制在最近蜡烛的最低点和最高点。
默认设置如下:
- SR间隔:10,
- MA周期:200,
- 快速EMA:24,
- 慢速EMA:26。
调整这些值可能导致信号更频繁或更少,建议进行测试以确定最有效的配置。
推荐使用1小时或4小时的时间框架,但在任何时间框架上都可能有效。该指标适用于所有交易工具,包括外汇、股票和商品等。
欢迎进一步了解其详细应用和优势。此外,它还包含报警功能。