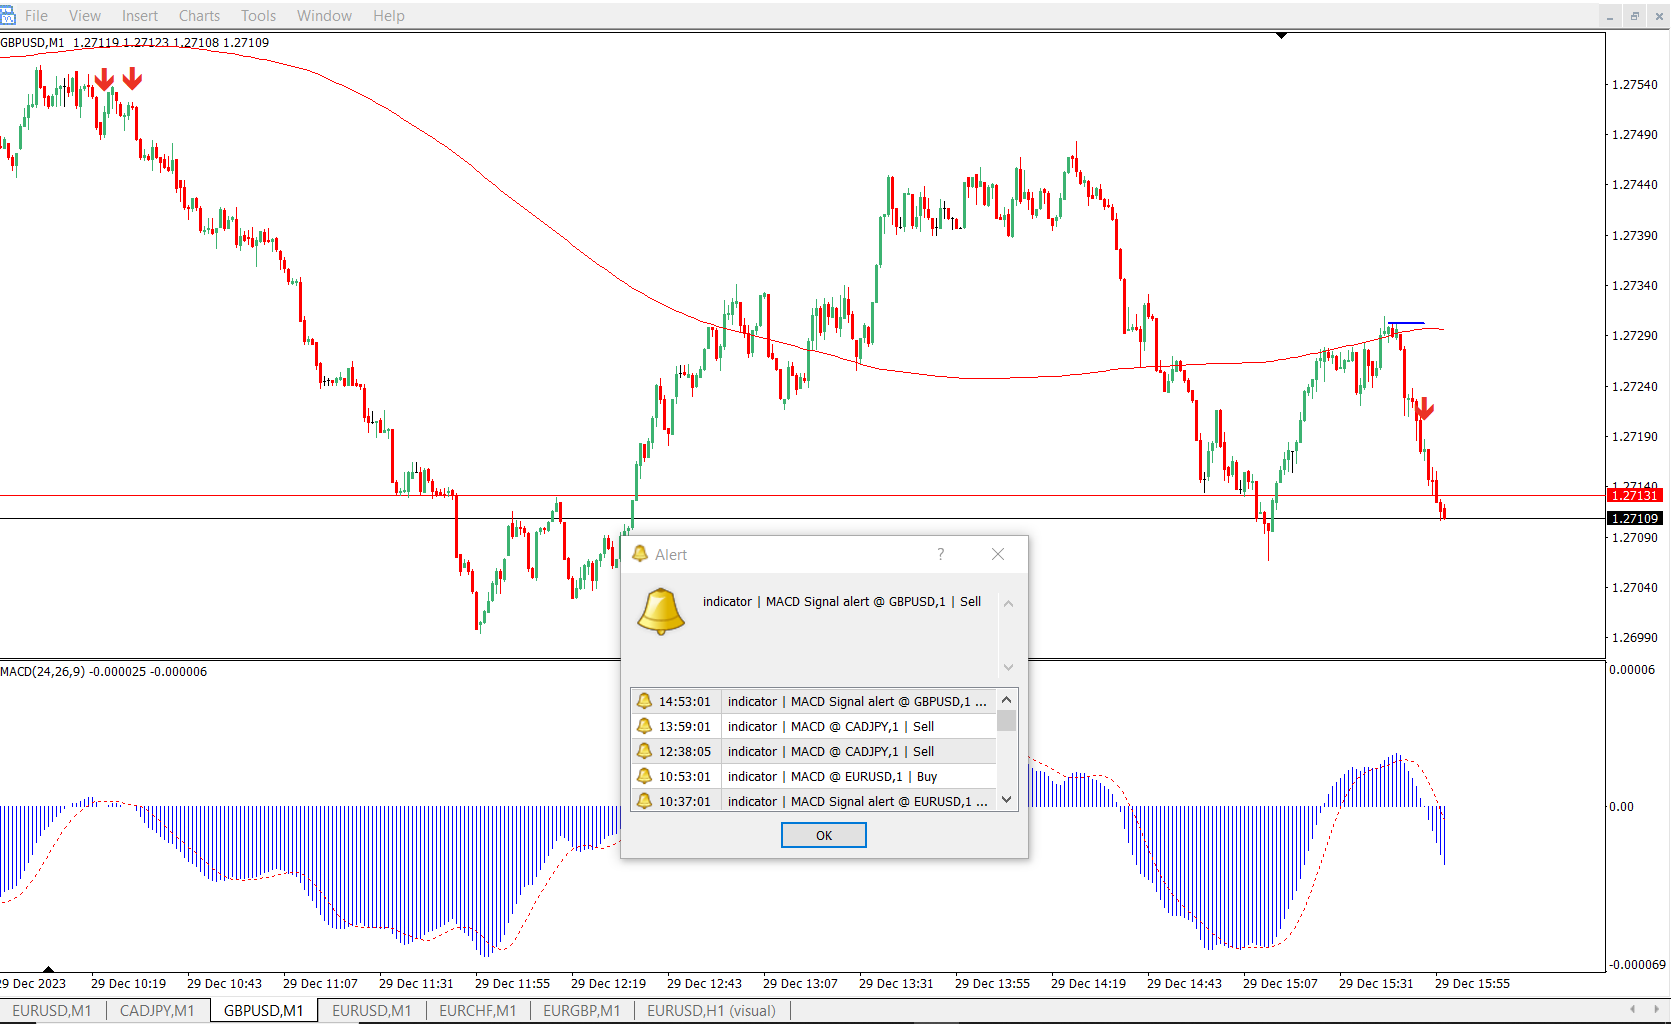
MACD Signal alert
- 지표
- Adam Zolei
- 버전: 1.0
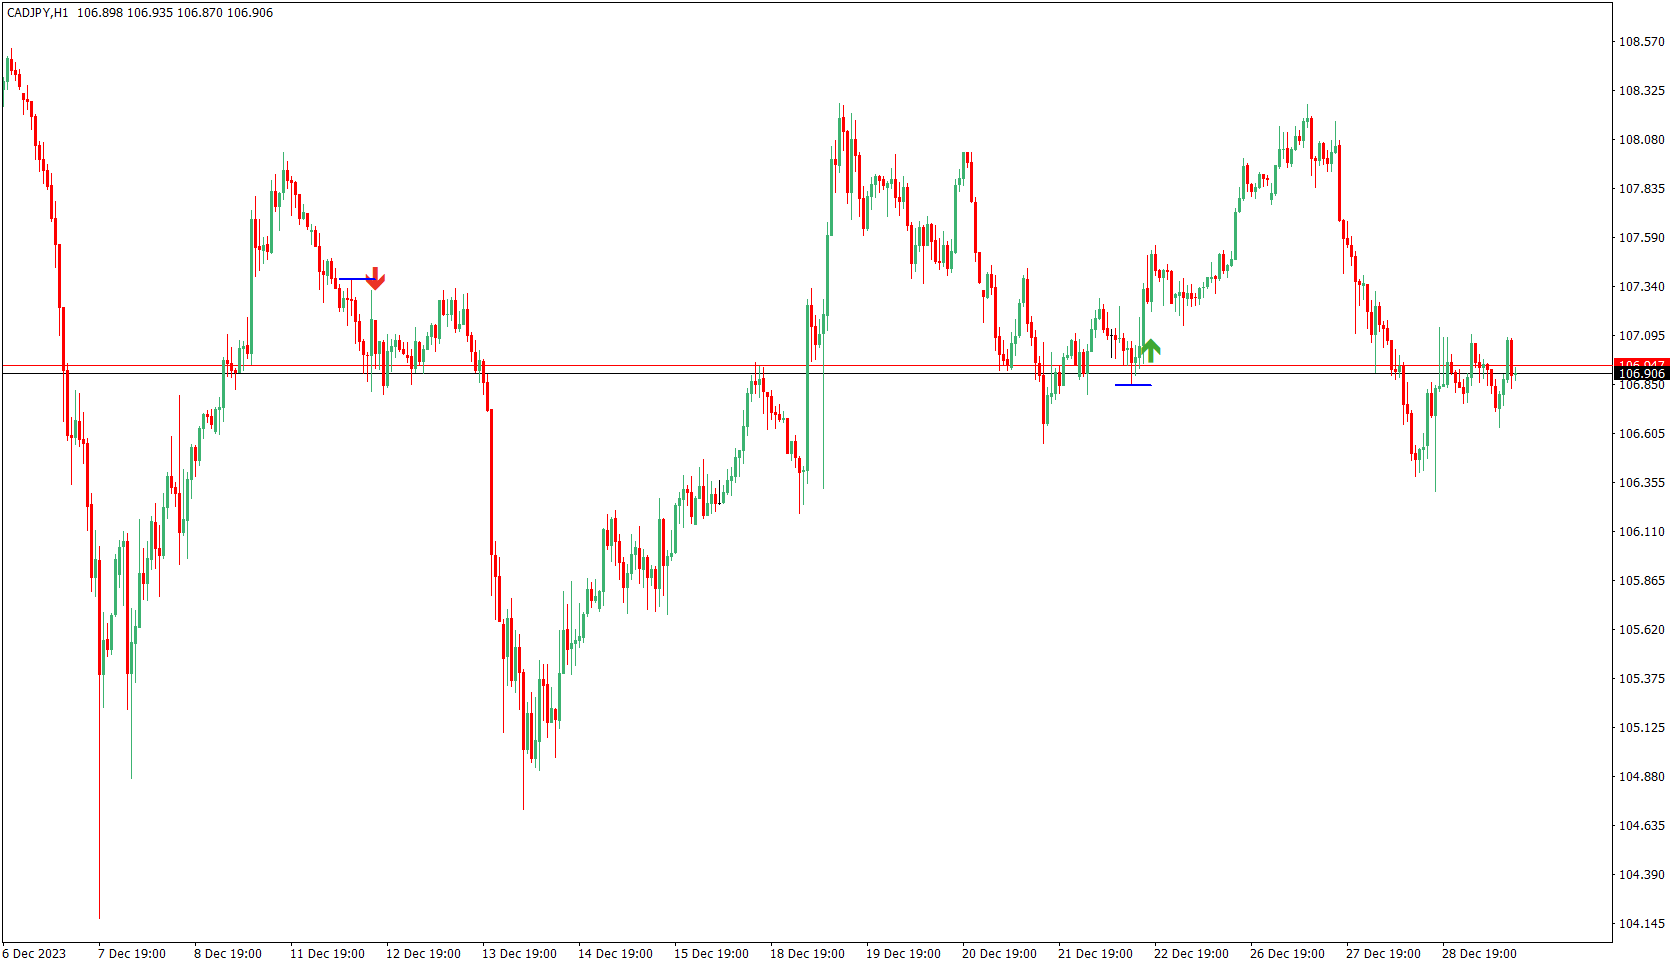
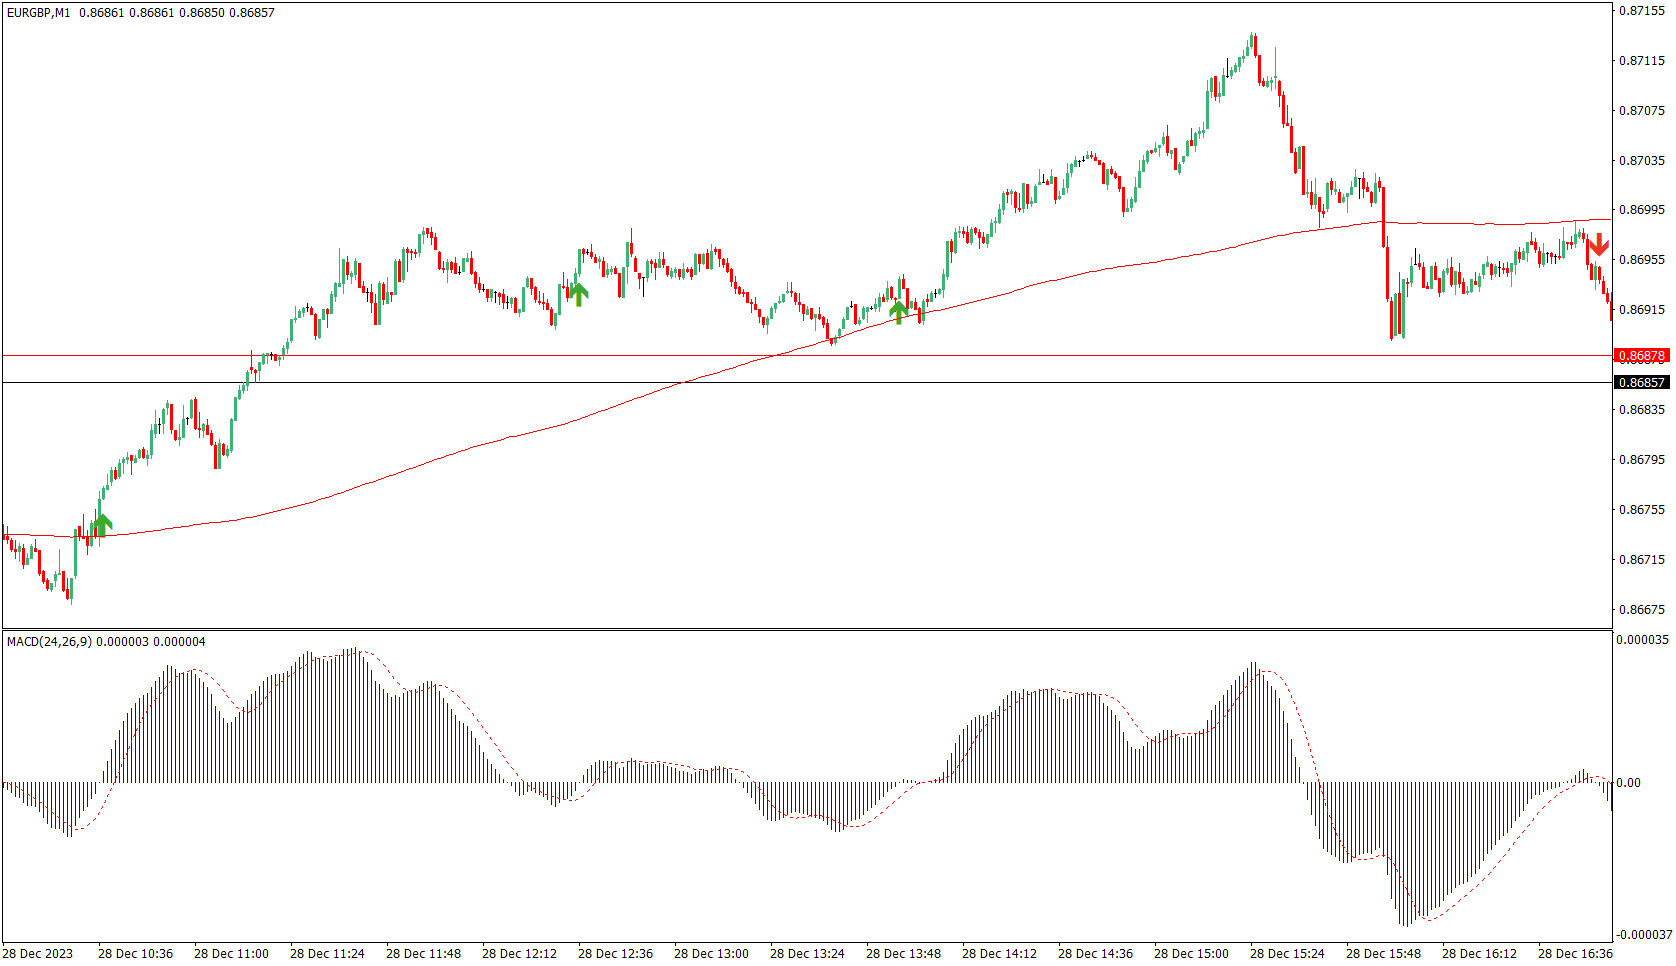
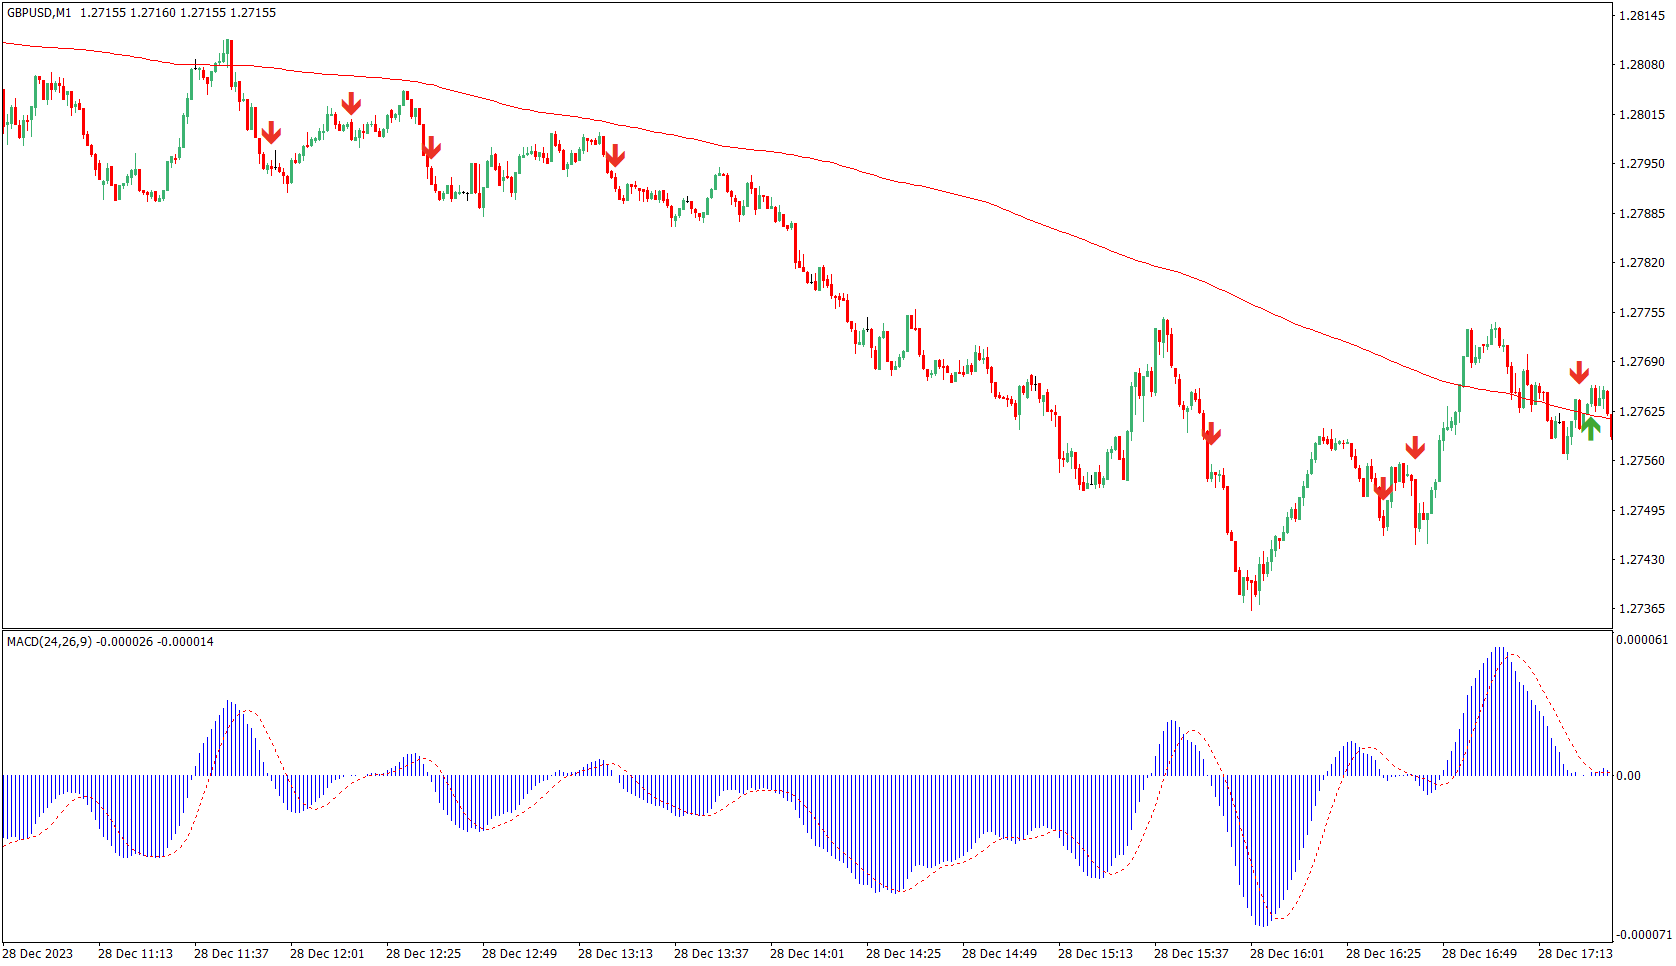
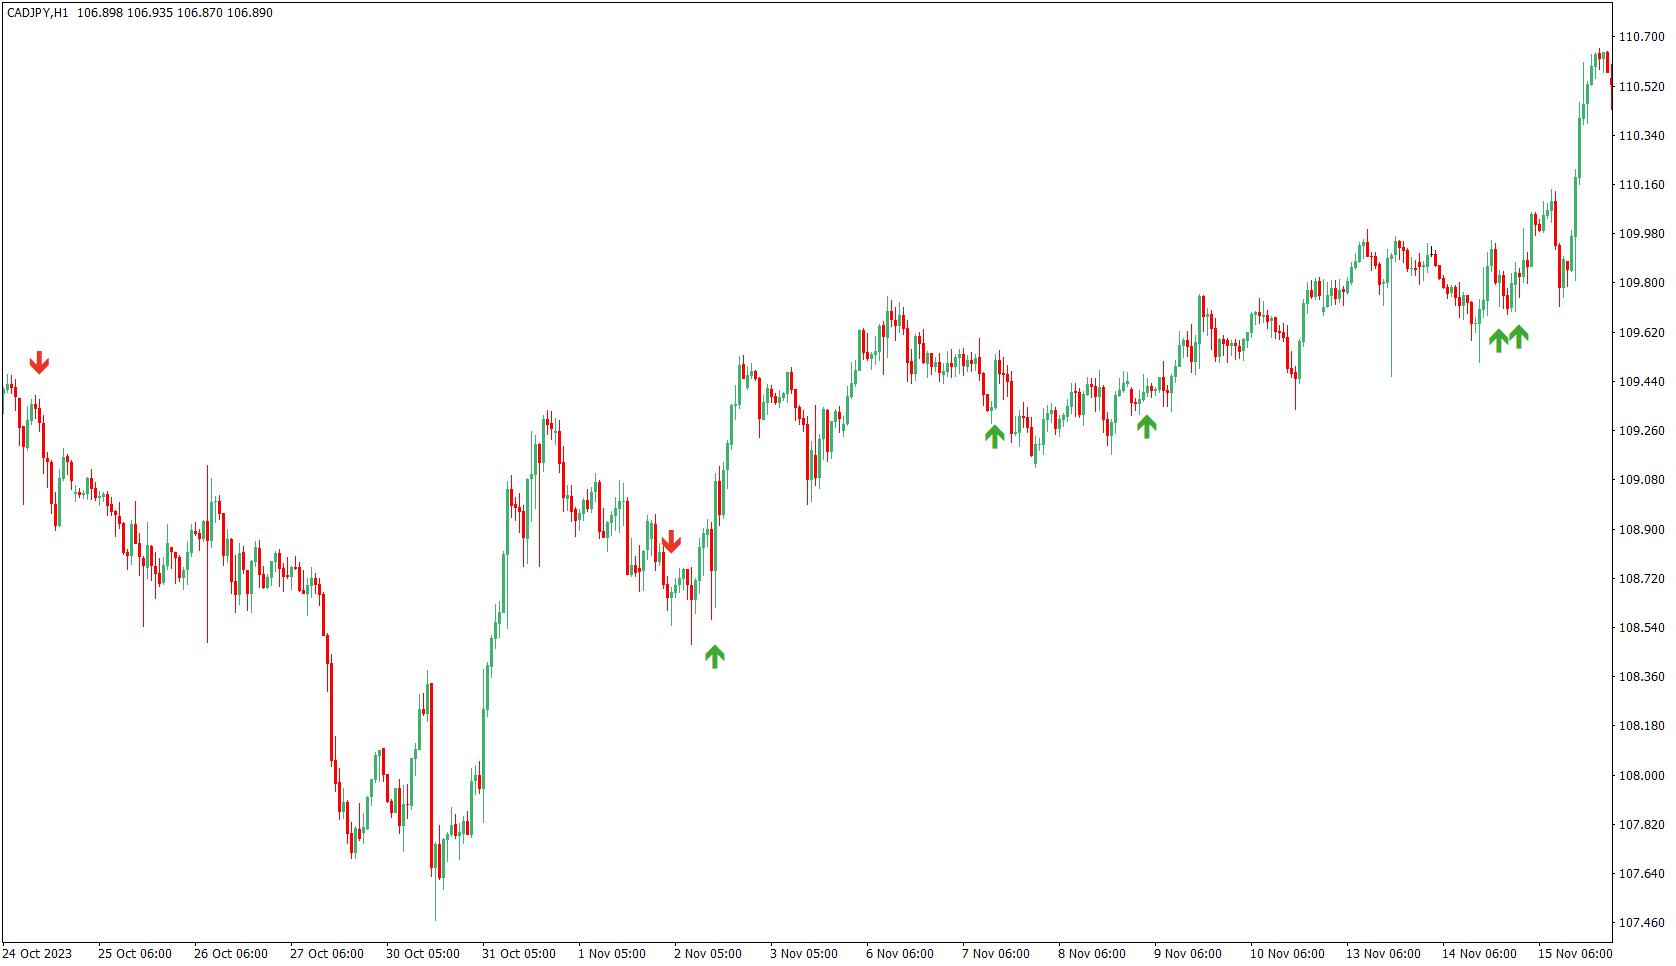
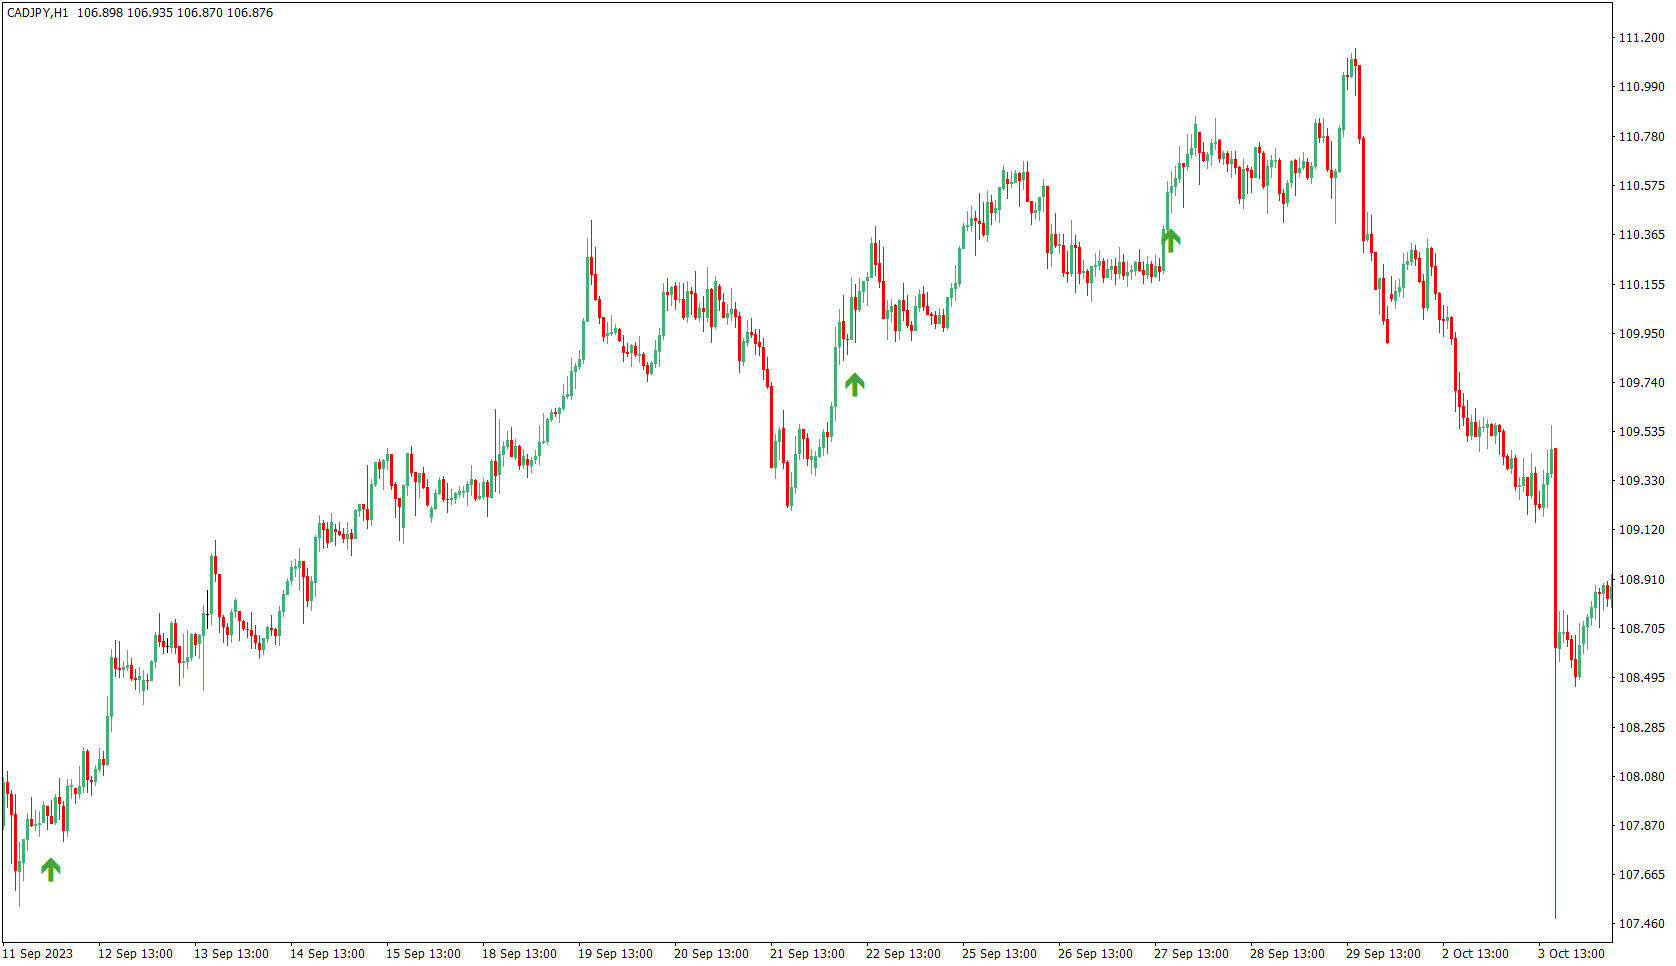
이것은 MACD를 기반으로 한 추세 추종 지표로, 200 MA를 기준으로 상위에 있을 때 매수 신호를 제공하고 하위에 있을 때 매도 신호를 제공합니다.
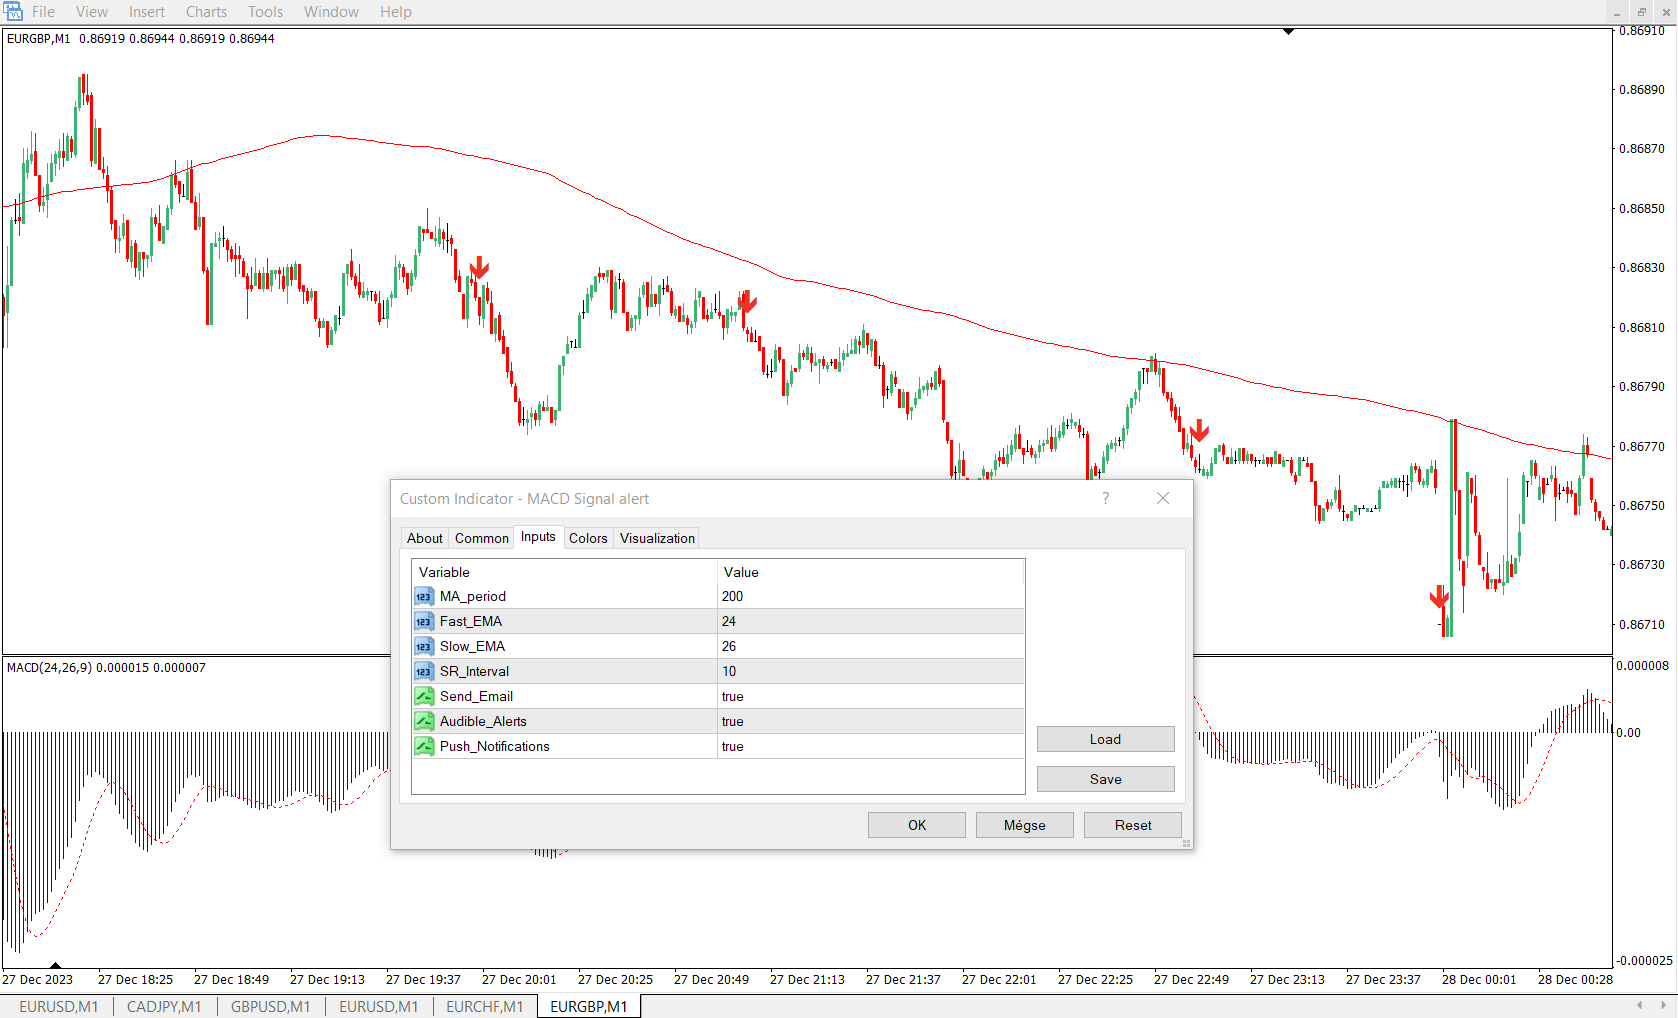
MACD가 제로 라인을 교차할 때 신호가 생성됩니다. 이 지표는 또한 서포트 및 레지스턴스 레벨을 표시하며 이는 손절로 사용될 수 있습니다. 조절 가능한 매개 변수에는 MA 기간, MACD 빠른 EMA, 느린 EMA 및 서포트-레지스턴스 간격이 포함됩니다. 최근 양봉의 최저점과 최고점에 플로팅됩니다.
기본 설정:
SR 간격: 10
MA 기간: 200
빠른 EMA: 24
느린 EMA: 26
알람 기능도 포함되어 있습니다.
이러한 값의 수정은 더 빈번하거나 덜 빈번한 신호로 이어질 수 있으며 가장 효과적인 구성을 결정하기 위해 테스트하는 것이 권장됩니다.
1 또는 4시간 프레임이 권장되지만 어떤 시간 프레임에서도 작동할 수 있습니다. 이 지표는 Forex, 주식, 상품 등을 포함한 모든 거래 도구에서 작동합니다.
다른 제품도 여기에서 확인하세요: https://www.mql5.com/en/users/8587359/seller