Indicator Waiting Volatility
- 指标
- Vitalyi Belyh
- 版本: 1.0
- 激活: 7
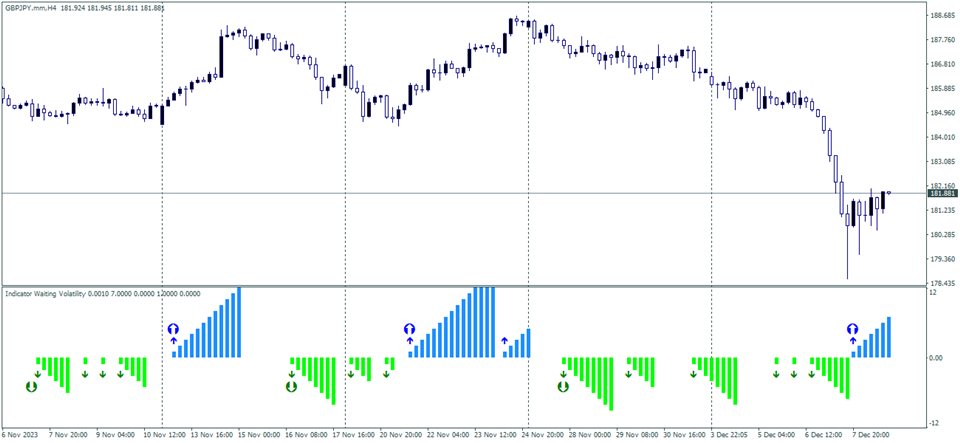
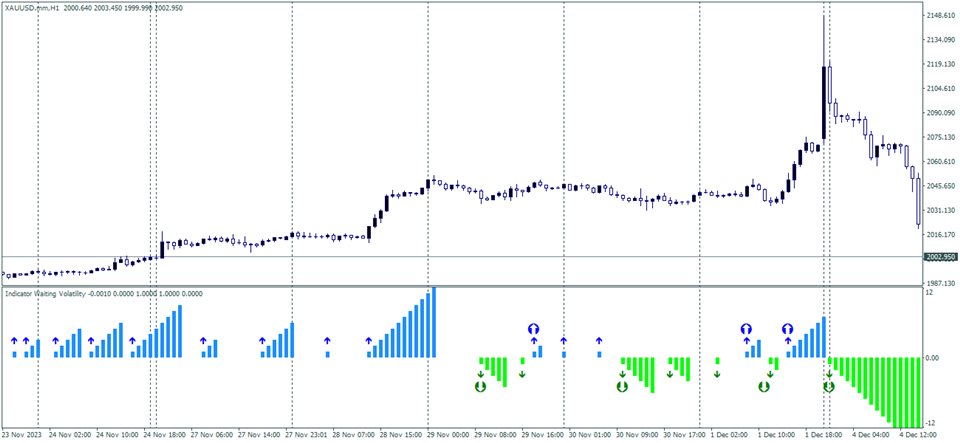
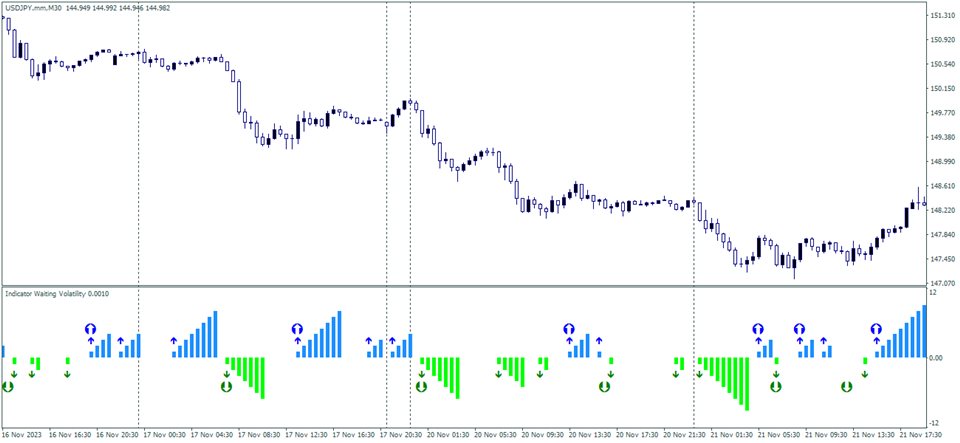
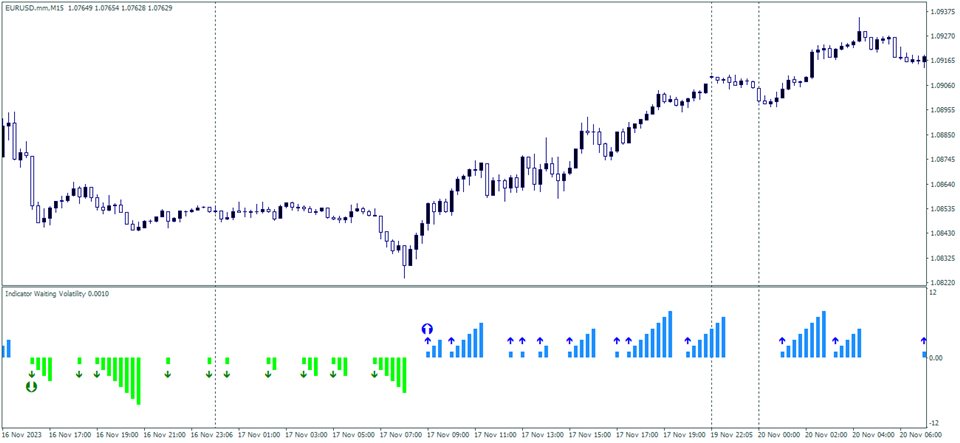
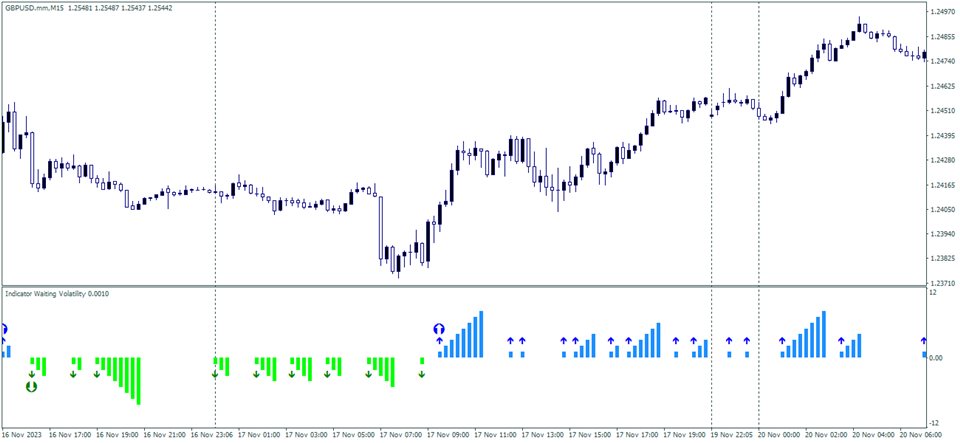
Indicator Waiting Volatility - an indicator for determining volatility zones and flat conditions.
Over time, the price on the chart is in different trends, goes down, goes up, or stays the same. The indicator helps the trader determine which trend the price is in.
In its work, it uses several tools for technical analysis; first, the direction of the trend is determined, then, in this direction, the indicator monitors changes in volatility.
If the price fluctuates within the noise, it is in tracking mode; when the price goes beyond the market noise, it shows the corresponding values.
- Trend determination is carried out by internally configured parameters, only small adjustments are possible for the desired duration of "Trend Correction". (from -1 to 10)
- You can manually configure the "Duration of Volatility" parameter, which determines how many candles to use to calculate the signal. (from 4 to 20)
- and “ Appearance of a Signal ” - determining which bar to give signals on, 0 - the signal may disappear / 1 - the signal will not disappear.
- The indicator can be used on any trading instruments; the recommended time frame is from M15 to D1.
- The indicator also provides several types of alerts.
- The indicator can be used independently, taking into account its potential trading signals or to build your own trading systems based on the indicator's volatility data.

