Scalping and Binary Signal Detector MT5
- 指标
- Vitalyi Belyh
- 版本: 1.20
- 更新: 2 十二月 2023
- 激活: 7
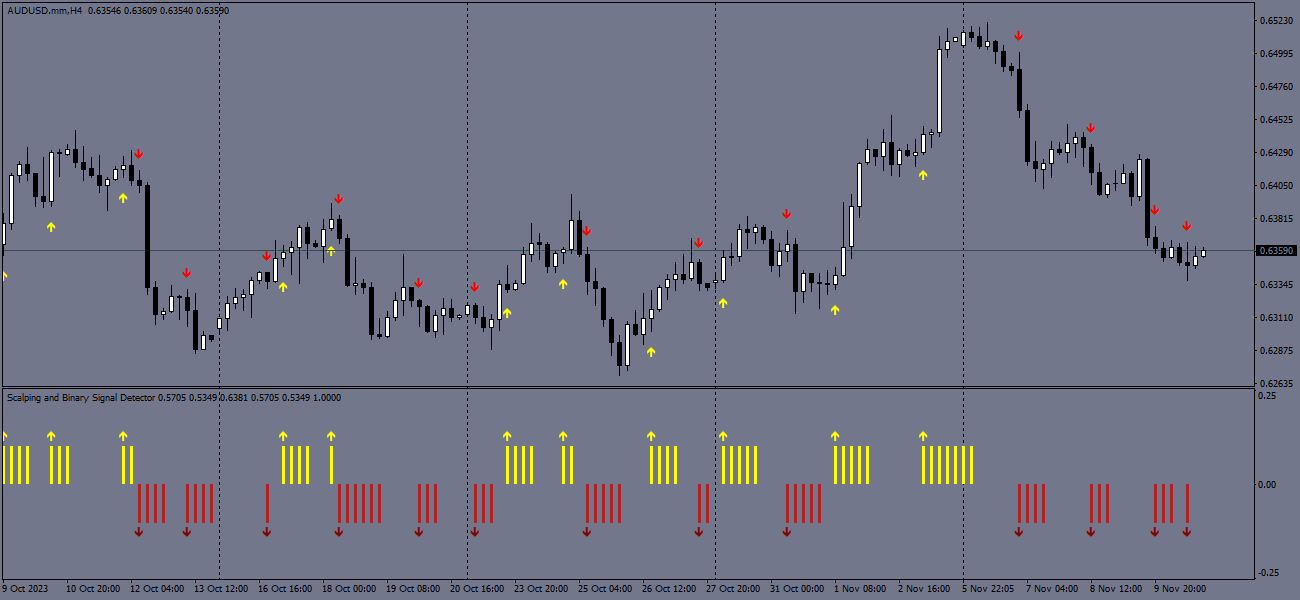
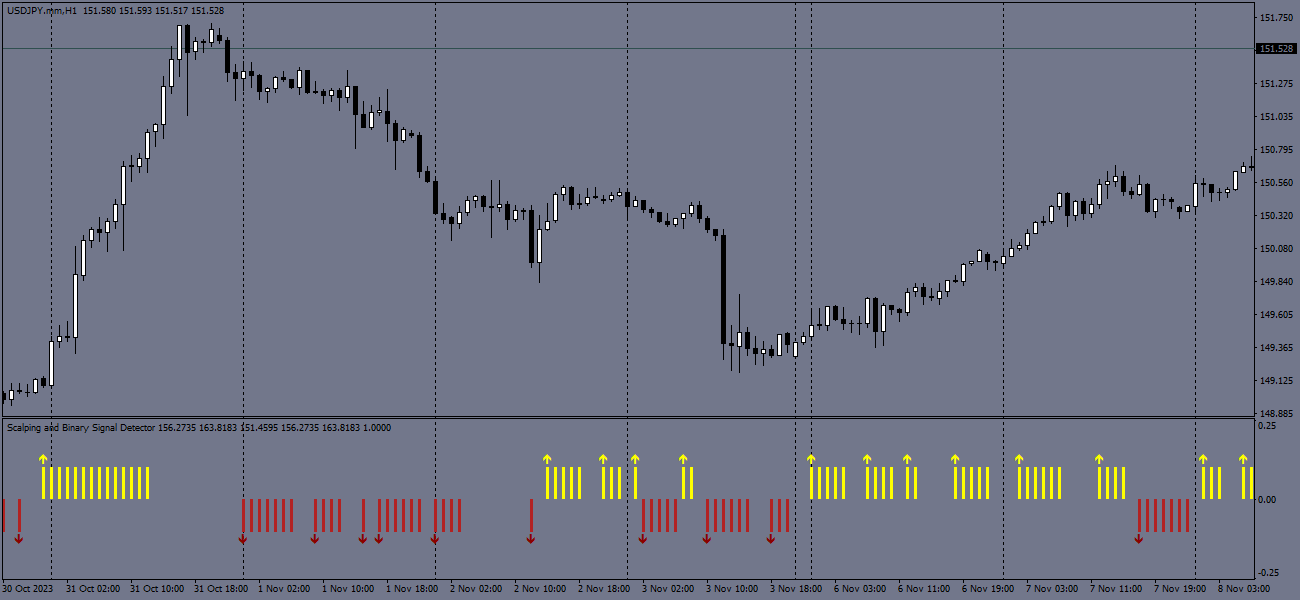
Scalping and Binary Signal Detector - Scalping indicator that gives directional signals for opening positions along the trend.
The indicator is a complete trading system that can be used for Forex and binary options.
The system of algorithms allows you to recognize intense price movements in several consecutive bars.
The indicator provides several types of alerts for arrows.
Works on any trading instruments and time frames (M5 or Higher recommended).
How to use for trading
The appearance of a yellow bar and arrow is a signal to buy, the remaining bars are the signal accompaniment.
stop loss is several points below the low of the previous candle.
The appearance of a red bar and arrow is a signal to sell, the remaining bars are the signal accompaniment.
stop loss is several points above the high of the previous candle.
You can close a position after a few candles, having received a price movement, or after an empty signal appears, when the directional movement has stopped.
Input parameters
- Appearance of a Signal - On which bar to give signals / 0 - the signal may disappear / 1 - the signal will not disappear.
- Trend Duration - Increasing the duration of the trend.
- Signal Frequency Reduction - Reducing the frequency of signals.
- Play sound / Display pop-up message / Send push notification / Send email (true/false) : Use notifications when signal points appear.
- Sound file signal - Sound file for signals