KT ATR Bands MT4
- 指标
- KEENBASE SOFTWARE SOLUTIONS
- 版本: 1.0
- 激活: 5
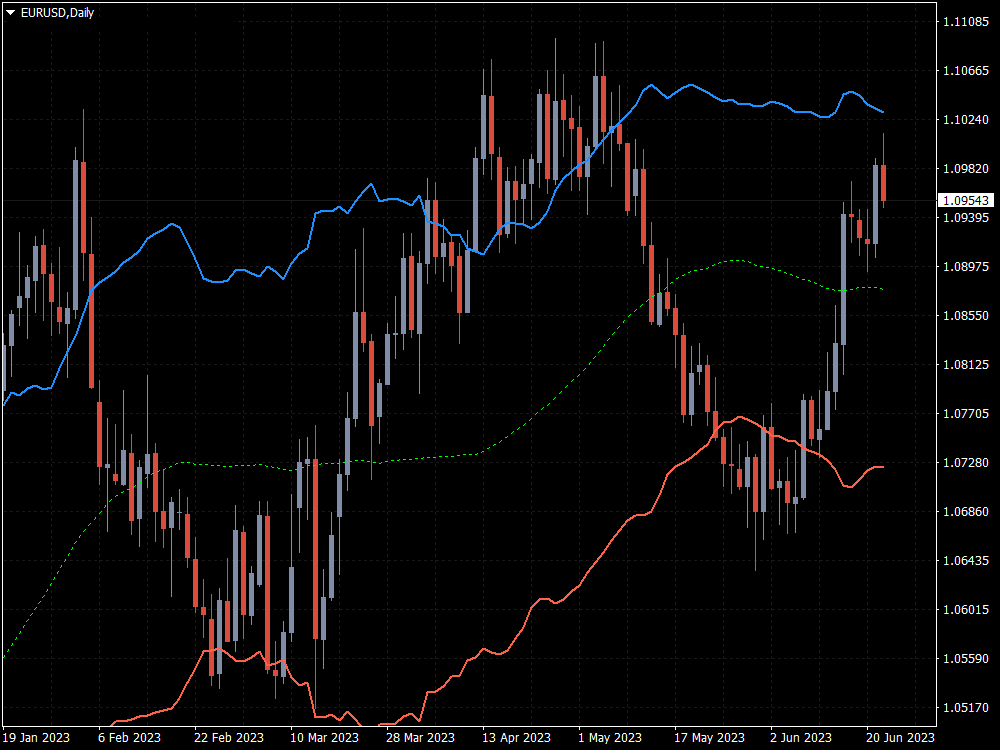
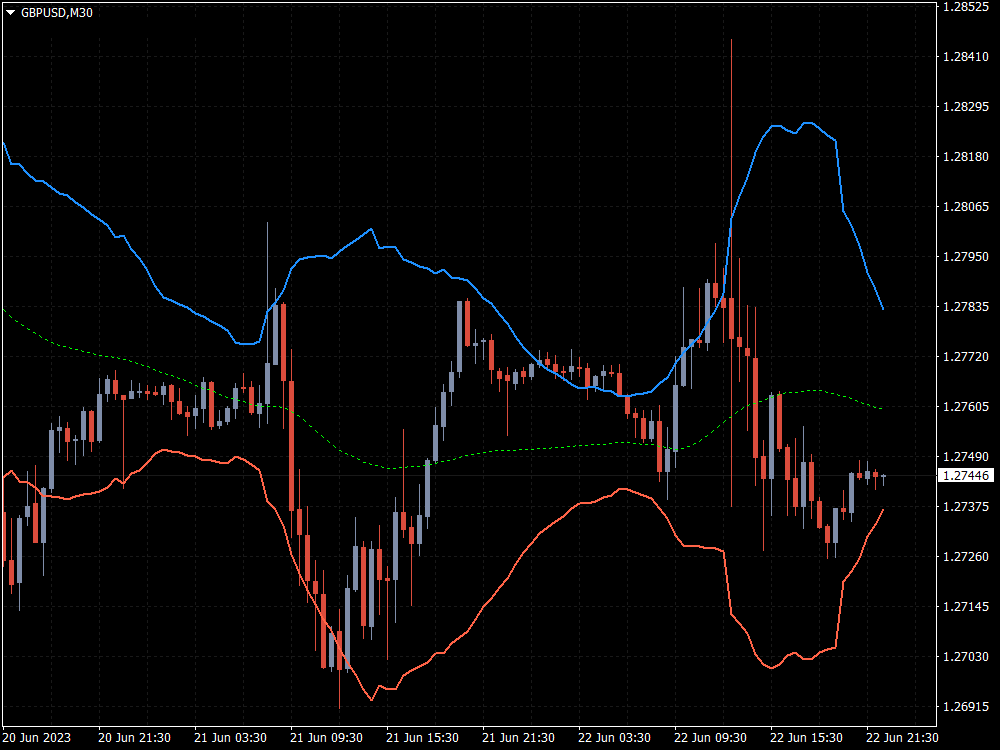
KT ATR Bands 利用平均真实波动范围(ATR)和移动平均线(MA)的组合绘制波动性通道和带状图。它们通常用于识别潜在的价格反转点以及高波动和低波动的时期。这个指标对趋势识别和风险管理都非常有帮助。
功能特点
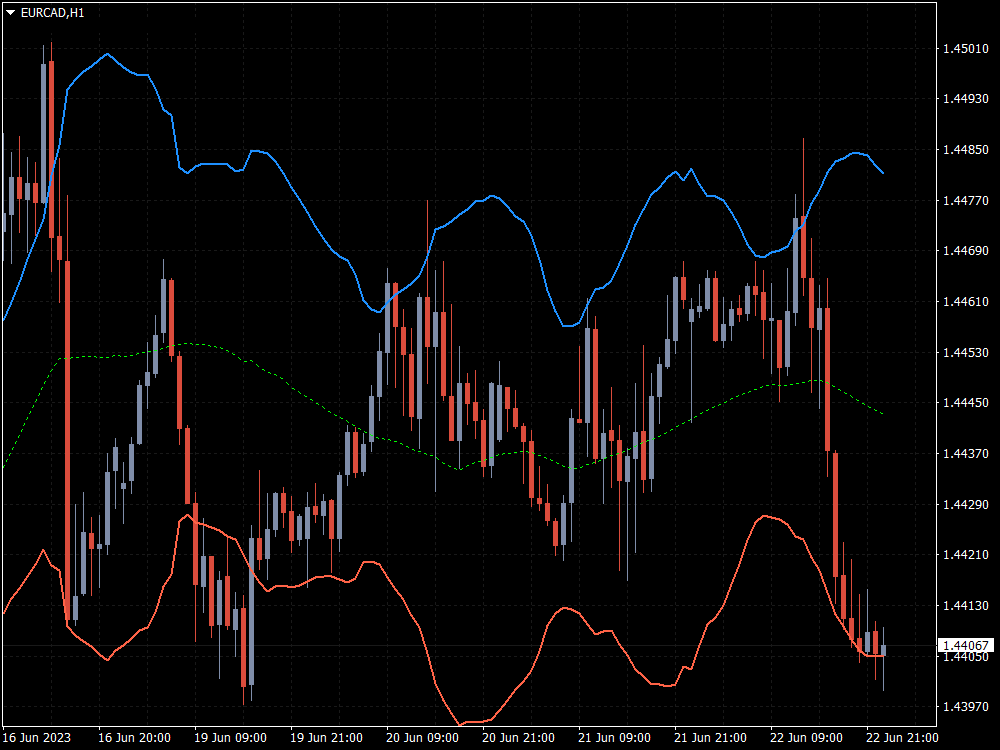
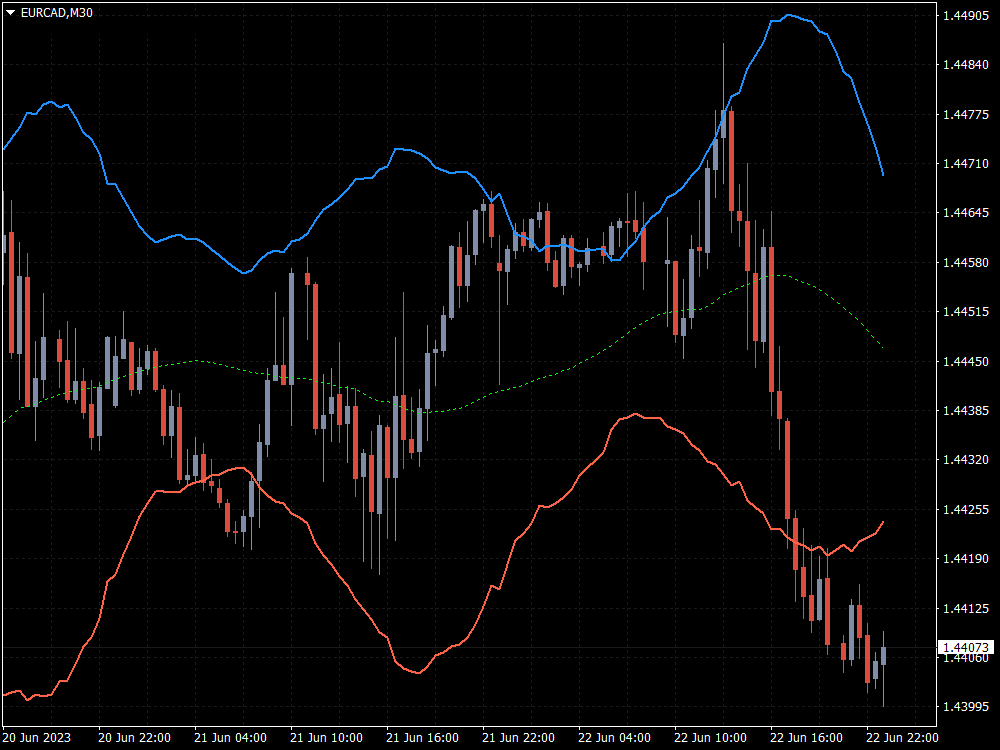
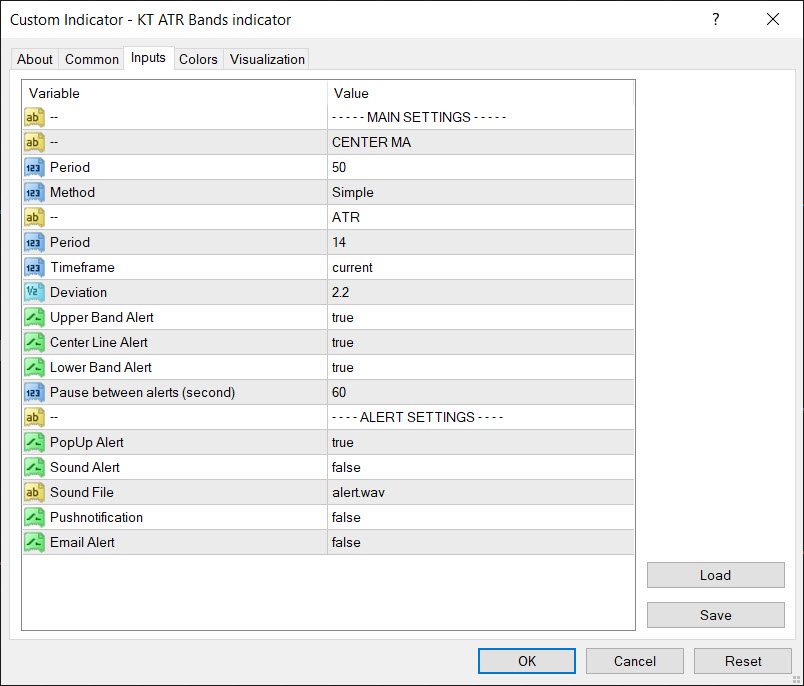
- 多时间框架支持: 例如,您可以在 H1 图表上显示来自日线图的 ATR 带。
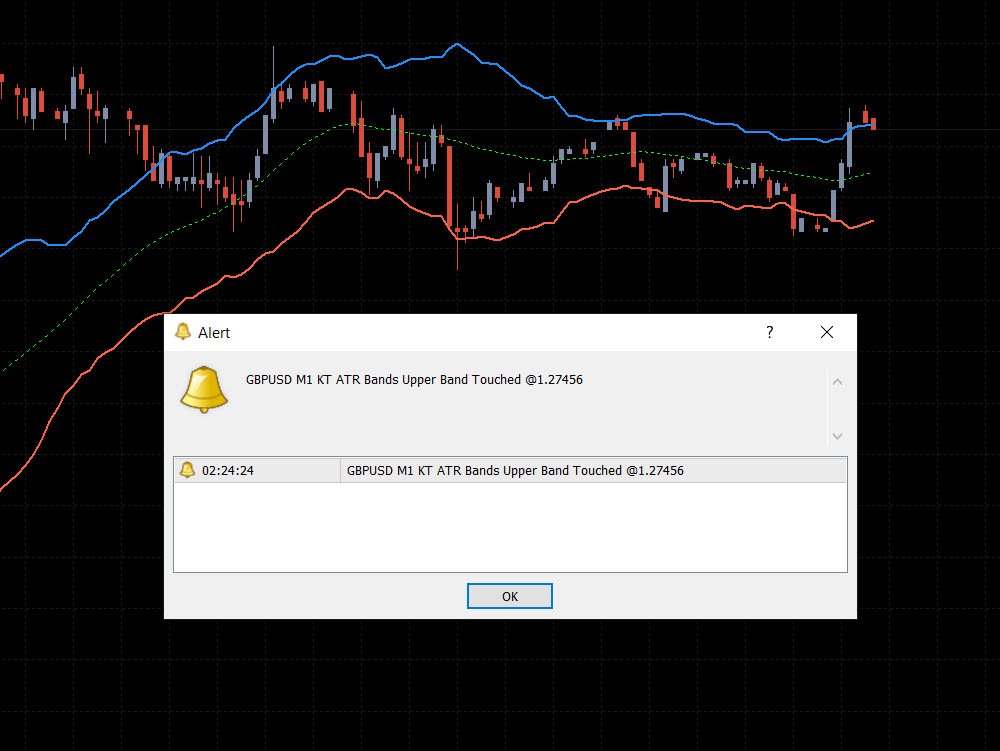
- 智能提醒: 可为每条带单独开启/关闭提醒,并设置提醒之间的最小时间间隔,以避免重复通知。
- 完全可自定义: 支持自定义 ATR 周期、MA 方法及配色方案。
- 从零开发: 指标从头编写,确保稳定性和性能,无常见Bug。
理解 ATR Bands
在外汇交易世界中,有许多旨在帮助交易者提高胜率的技术指标,其中一个非常有效的工具就是 ATR Bands。它能提供对市场波动性的深入分析。
我们将讨论如何在 MT4/MT5 平台上设置 ATR 带、制定进场策略,以及如何设定止损和止盈水平。
ATR Bands 背景
ATR Bands(平均真实波动范围带)是一种基于波动性的通道,绘制在价格上下方。
其计算基于 ATR 值,该值衡量某时间段内资产价格的整体波动幅度。
一般默认使用 14 个周期进行计算。
波动性是价格在一定时间内上涨或下跌的速率,是判断趋势强度和反转的重要因素。
通过调整 ATR 值和倍数,可以提高指标对市场波动的响应能力。
ATR Bands 类似于 Keltner 通道,是一种可靠的波动性参考工具。