KT ATR Bands MT4
- Indicateurs
- KEENBASE SOFTWARE SOLUTIONS
- Version: 1.0
- Activations: 5
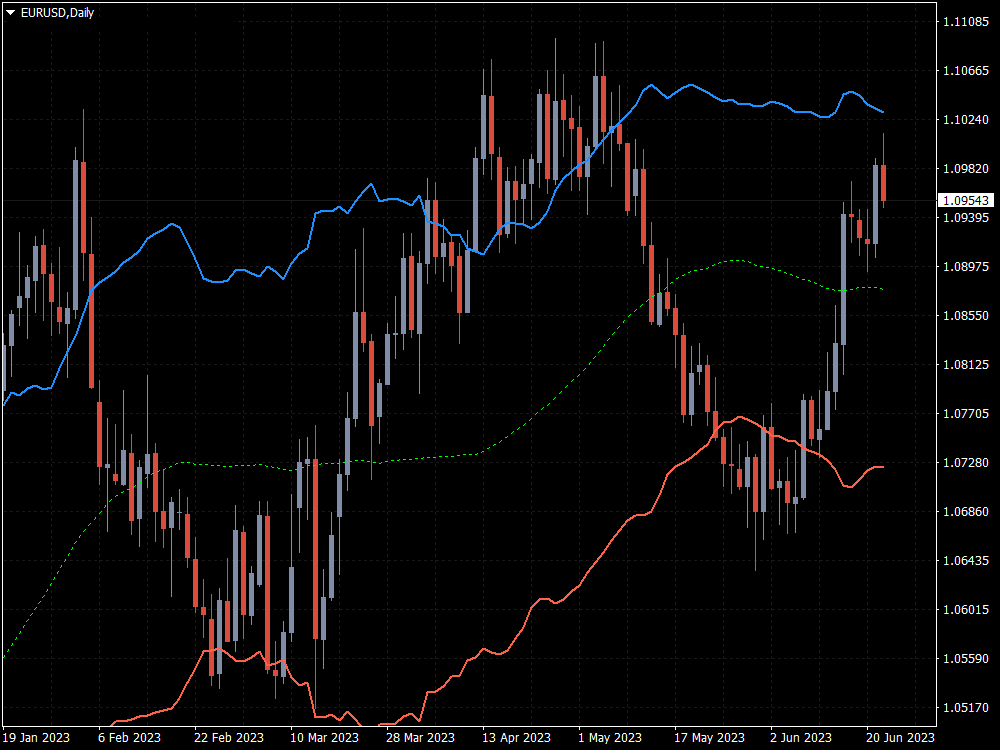
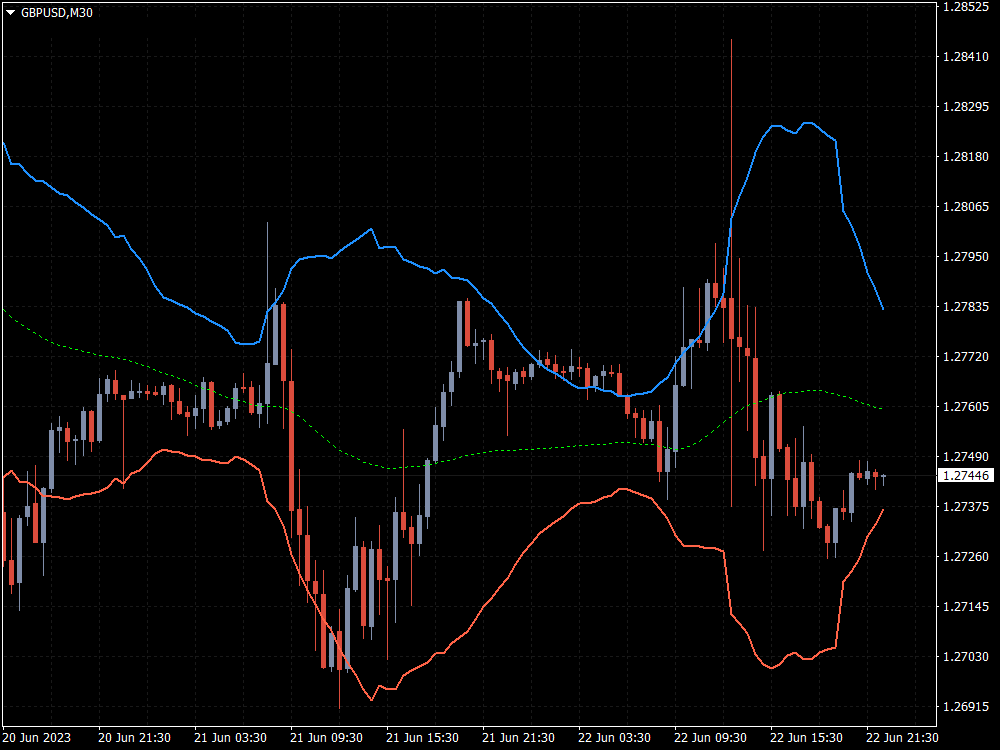
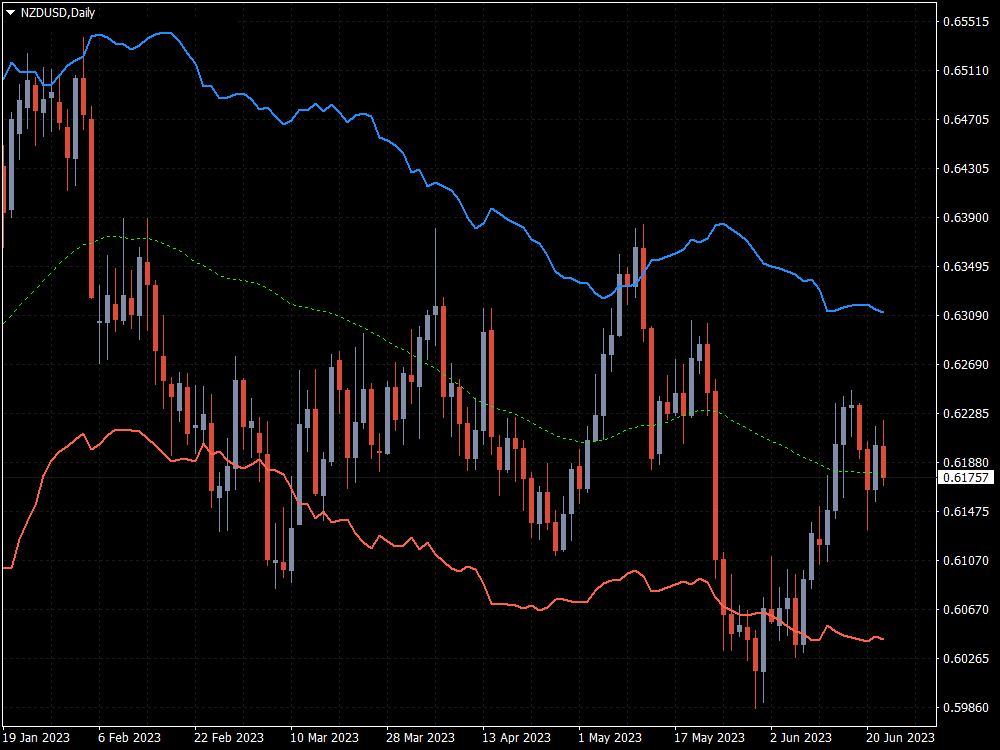
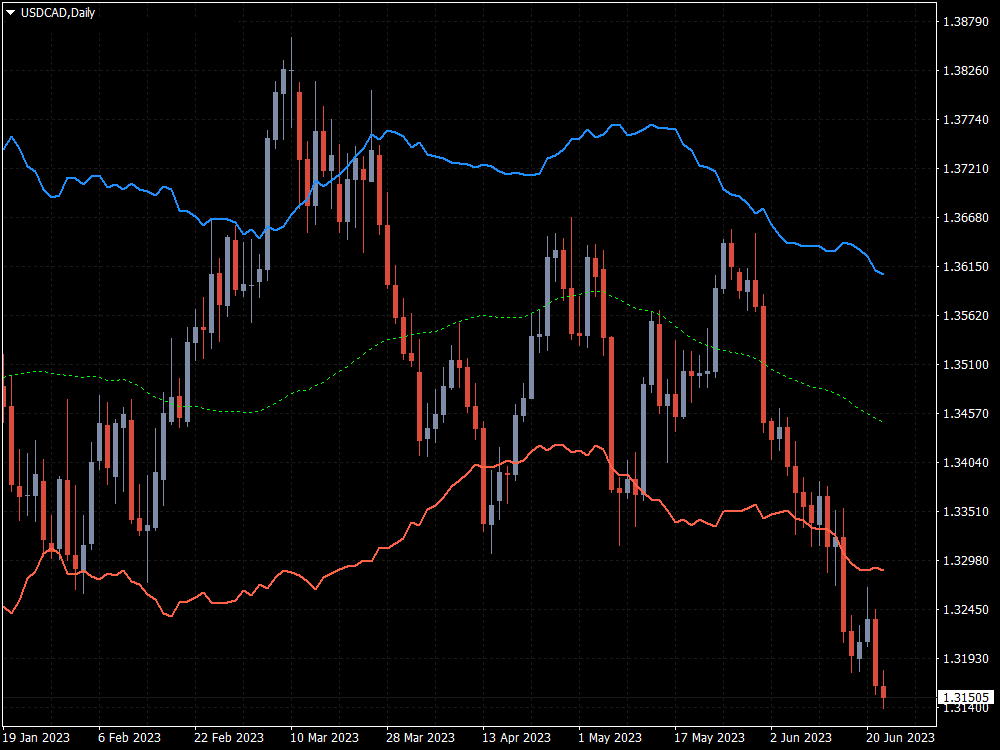
KT ATR Bands trace des enveloppes de volatilité en utilisant une combinaison de l’Average True Range (ATR) et d’une moyenne mobile. Ces bandes sont couramment utilisées pour détecter des points de retournement potentiels ainsi que des périodes de forte ou faible volatilité.
Fonctionnalités
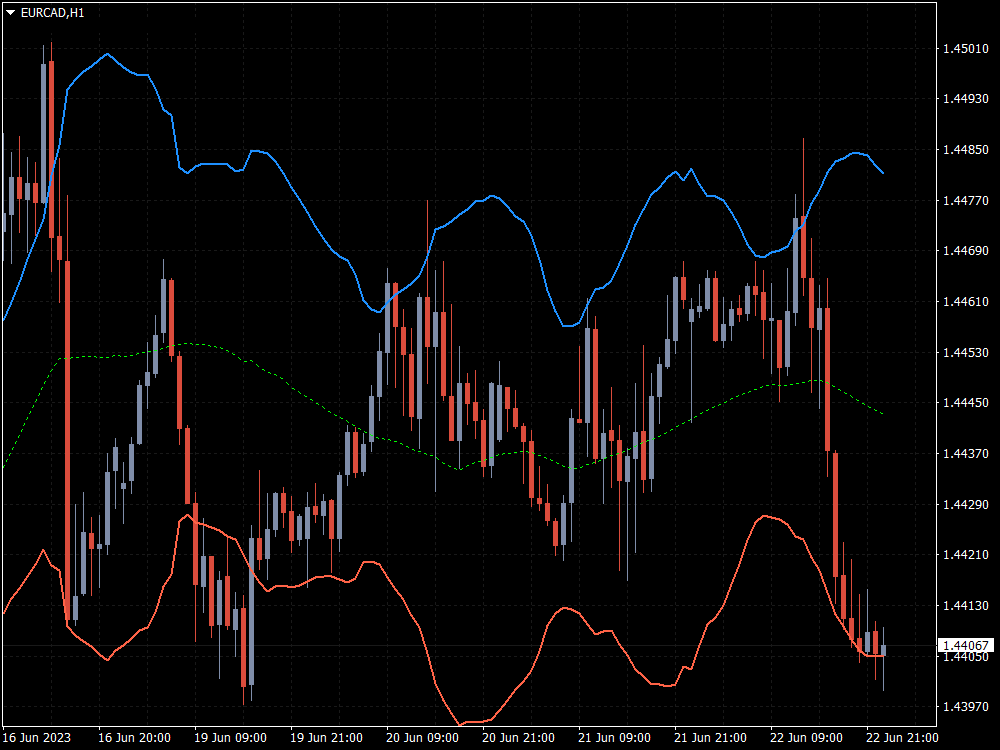
- Multi-unité de temps : Par exemple, vous pouvez afficher les bandes ATR du graphique journalier sur un graphique H1.
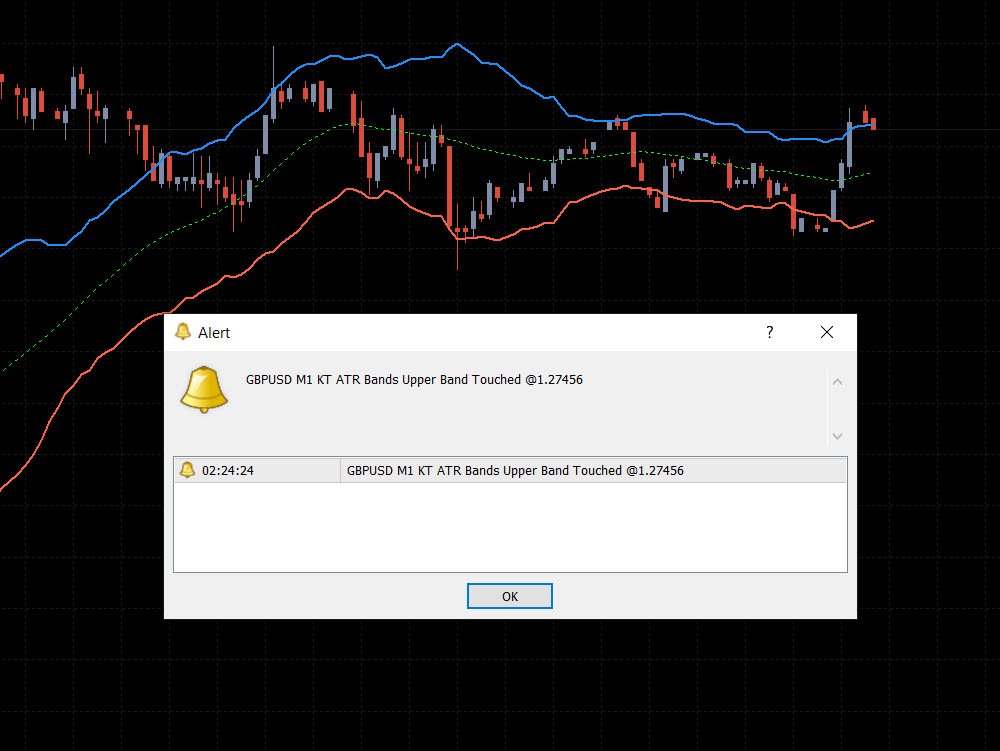
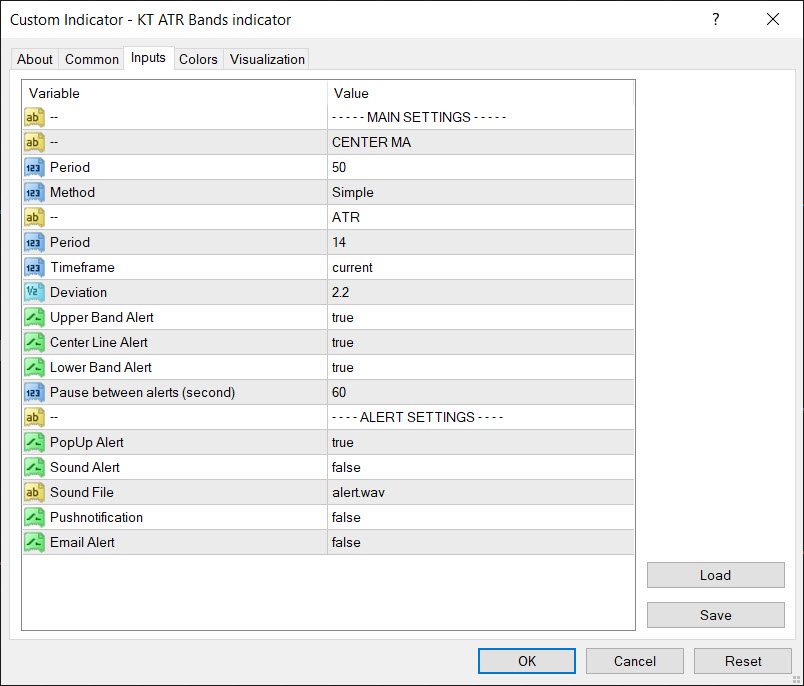
- Alertes intelligentes : Activez ou désactivez les alertes pour chaque bande, et définissez un intervalle minimum entre les alertes pour éviter les notifications inutiles.
- Entièrement personnalisable : Périodes ATR, méthodes de moyenne mobile, couleurs, etc.
- Codé depuis zéro : L’indicateur a été entièrement développé en interne pour éviter les bugs et les conflits.
Le monde du trading regorge d’indicateurs utiles. Parmi eux, les bandes ATR sont un outil populaire permettant une lecture plus précise de la volatilité du marché.
Nous verrons comment configurer les bandes ATR sur MT4/MT5, créer une stratégie d’entrée efficace et définir des niveaux clés de stop-loss et take-profit.
Origine des bandes ATR
Les bandes ATR sont des enveloppes basées sur la volatilité placées au-dessus et en dessous du prix d’un actif.
Elles se basent sur l’ATR, qui mesure la volatilité à partir de la plage totale de variation des prix sur une période donnée.
Le paramètre classique est basé sur 14 périodes.
La volatilité est un indicateur essentiel pour mesurer la force d’une tendance et détecter d’éventuels retournements.
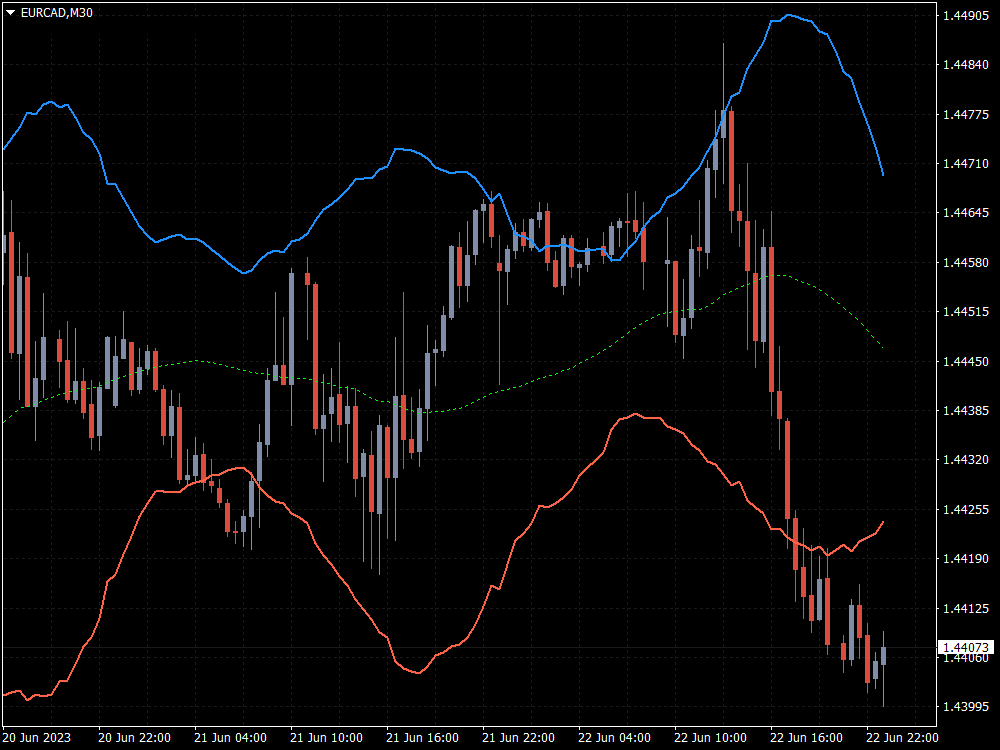
En ajustant la valeur de l’ATR et le multiplicateur, vous pouvez rendre les bandes plus ou moins réactives aux mouvements du marché.
Cette méthode est comparable aux canaux de volatilité comme le Keltner Channel.