适用于MetaTrader 5的EA交易和指标 - 74

Times and Sales Pro: 利用交易流不平衡提升您的交易表现 抓住细微的价格波动机会
Times and Sales Pro 是专为通过 Times and Trades 操作订单流的分析师打造的重要工具。它非常适合剥头皮交易者,专为那些希望以高精度捕捉细微价格波动的用户设计。通过先进的计算,该指标能够识别交易中的不平衡,为快速进出场提供宝贵的信号。 重要提示:MT5 中 Times and Trades 数据的可用性
在使用 Times and Sales Pro 之前,请确保您的经纪商提供 Times and Trades 数据访问权限。该指标依赖这些数据来进行实时精确计算,因为 MT5 不会存储历史交易记录。因此,该指标只能实时工作,提供对市场已执行交易的即时分析。 Times and Sales Pro 的优势 清晰颜色显示的高级交易流分析
Times and Sales Pro 通过特定的颜色代码简化了交易不平衡的可视化: 绿色: 代表买单。 红色: 代表卖单。 金色: 表示买单和卖单之间的不平衡。 这些颜色使得交易流的读取快速
Aydmaxx Trade Tracker Description: Aydmaxx Trade Tracker is a powerful and user-friendly tool for traders, allowing you to monitor the current profit or loss for each trade in real-time. The indicator displays the information directly on the screen, helping traders quickly assess the results of their trading operations. Key Features: Displays the current profit or loss for all open positions in real-time. Customizable corner of the screen for displaying information (default is the bottom right c
FREE

(谷歌翻译) 该指标的灵感来自 John Welles Wilder 的平均真实波动范围 (ATR) ,但包含一些额外信息。 同样,它计算真实范围的指数移动平均值,但使用标准 alpha 权重而不是 Wilder's 。 它还计算范围平均值的平均偏差,并将其显示为偏移量。 这不仅有助于更快地识别更改,还有助于确定其影响。 (谷歌翻譯) 該指標的靈感來自 John Welles Wilder 的平均真實波動範圍 (ATR) ,但包含一些額外信息。 同樣,它計算真實範圍的指數移動平均值,但使用標準 alpha 權重而不是 Wilder's 。 它還計算範圍平均值的平均偏差,並將其顯示為偏移量。 這不僅有助於更快地識別更改,還有助於確定其影響。 (Original text) This indicator was inspired by John Welles Wilder's average true range (ATR) , but with some extra information. Similarly, it calculates the exponential moving
FREE

相对强弱指数和均线交易机器人 我们推出了 RSI 和均线 (MA) 智能交易 (EA) ,这是一款强大且多功能的交易机器人,旨在在不同的时间框架和外汇货币对上提供稳定的交易表现。从 2023 年初进行的回测显示,其准确率高达 100%。只要输入正确的参数,该 EA 就能适应各种市场环境,适用于所有交易者,从剥头皮到波段交易。 低风险 - 低回报 ,让您可以自由尝试不同的手数和止盈止损比例。 促销价:$30 仅剩 2 份!最终价格:$80!节省高达 62%! 推荐设置 时间框架 : 30 分钟,1 小时 货币对 : EURUSD, GBPUSD 贵金属 : XAUUSD 设置 : 默认适用于 EURUSD,可请求针对其他货币对的优化设置文件。 手数 : 建议第一个月使用 0.01 手熟悉 EA 策略,之后可根据喜好调整手数。 优势 适用多个时间框架 – 适应不同市场条件的交易策略。
兼容多种货币对 – 可用于不同的外汇货币对,不局限于 EURUSD。
无经纪商限制 – 不受点差或交易停损的限制,可适用于任何外汇经纪商。
灵活的交易管理 – 可调整手数、止损、止盈以及

Only Exponential Moving Average at Close Price is used in standard Bulls Power limiting the possibilities of that indicator to some extent. Bulls Power Mod enables you to select from four Moving Averages and seven applied prices, thus greatly expanding the indicator's functionality.
FREE
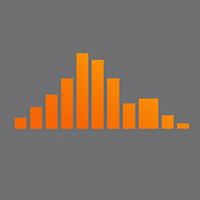
The indicator shows the price change of the current or any other instrument since the beginning of the day / week . You can choose to display it in points or as a percentage relative to the opening price of the beginning of the period . The indicator is made in the form of a histogram with two colors , for ascending and descending price changes . You can also choose which tool to show the data for . The data will be displayed on the current chart .
FREE

Swiss Holy Grail Indicator Motivation and functioning The HolyGrail indicator serves to optimize an entry. At that very moment I caught myself, that I went short in an uptrend, so I got into a trade in an anti-cyclical way. Or I have entered into a much too mature trend. This indicator should prevent such errors: One should always be aware of whether it is pro- or anticyclic entry, and one must always know about the maturity of the trend. Don't enter an old trend. Linda Raschke advises to buy th
FREE

Positions Risk Analyzer Utility
The Trade Analyzer is a powerful tool designed for real-time monitoring of your trading performance directly on the chart. It provides insights into: Total Open Positions : Number of active trades. Potential Profit (TP) : Estimated profit if all Take Profits are hit. Potential Loss (SL) : Maximum potential loss if all Stop Losses are triggered. Floating Profit/Loss : Real-time net profit or loss of all open trades. This utility dynamically updates its calculation
FREE

Spread Indicator MT5 - NS Finanças. (http://www.nsfinancas.com.br) Auxiliary tool to give Spread visibility to all types of currency pairs and timeframes. The labels are well positioned in the upper right corner of the chart so as not to disturb the visualization during the trade, however it is also possible to drag the indicator to the best place on your screen. In addition to the current spread, this indicator also monitors the minimum, maximum and average spread of the selected currency pair
FREE

Introducing the "Cybercycle Trend" Forex Oscillator, a powerful technical indicator designed to enhance your trading experience in the foreign exchange market. This innovative tool utilizes advanced algorithms to identify and analyze market trends, providing you with valuable insights and helping you make informed trading decisions.
The Cybercycle Trend Forex Oscillator is specifically designed to detect and measure cyclical price movements in the forex market. By incorporating this oscillator
FREE

This is a Free Display Dashboard for The ArbitrageATR Recovery MT5 EA. This indicator is used to track existing Total hedge positions (Account Summary) , Balance, Equity, P/L and Symbols, Correlation Status. Please adjust size and colours according to your desired preference. Feel free to message me if there are any queries required. Please note that this an indicator and not a Utility or Expert Advisor.
LINK TO THE EA: https://www.mql5.com/en/market/product/131269?source=Site+Market+Product+
FREE

布林线对冲均线趋势EA简介
“一定要设置好参数再使用且平台允许锁仓”,如果实在不清楚参数设置,可以以 2000 美金资金量为参考,针对 xauusd 品种,周期M30进行测试。参数如下:
Slippage=50(us30需要差不多500才能顺利建仓和平仓),RiskPercent=0.1,LotMultiplier=2,LotThreshold=0.3,SmallTarget=5,LongMAPeriod=60,ShortMAPeriod=30, BBPeriod=20,BBDeviation=1.0,具体最优参数各自多回测改良。
一、核心策略理念 布林线对冲均线趋势EA在市场分析中运用了随趋势马丁回调对冲的概念。这一理念结合了市场趋势追踪与风险对冲机制,旨在适应复杂多变的市场环境,有效提高对市场变化的容错能力,同时捕捉潜在的盈利机会。
二、关键指标运用 1. 布林带指标:布林带是一种广泛应用的技术分析工具,它能够直观地反映市场价格的波动范围和趋势变化。EA通过对布林带的分析,识别市场的超买超卖区域,以及价格突破或回归布林带边界的信号,为交易决策提供重要参考。 2. 双移动平
FREE
Dynamic Trailing Stop EA for MT5 – Enhance Your Trade Management Strategy Unlock advanced trade management with the Dynamic Trailing Stop EA for MetaTrader 5. Developed by Shi Xiong, this Expert Advisor (EA) offers a sophisticated trailing stop mechanism that adapts to various trading strategies, ensuring your trades are managed effectively to lock in profits and minimize losses. The trial version runs on a demo account: Download Trial Version Note: In backtest mode of MetaTrader 5, I have adde

Trade Performance Journal — Your Visual Trading Summary Tool Trade smarter by understanding your performance.
This Expert Advisor (EA) provides an instant visual summary of your trading results directly on the chart. Whether you’re a scalper, swing trader, or long-term investor, this tool helps you stay on top of your performance metrics with ease. Key Features Flexible Time Analysis
View your performance by Quarter, Month, or Half-Year. Easily switch between display modes to analyze your res
FREE

DTFX Algo Zones are auto-generated Fibonacci Retracements based on market structure shifts.
These retracement levels are intended to be used as support and resistance levels to look for price to bounce off of to confirm direction.
USAGE Figure 1 Due to the retracement levels only being generated from identified market structure shifts, the retracements are confined to only draw from areas considered more important due to the technical Break of Structure (BOS) or Change of Character (CHo

This is a demo version of the Candle Absorption Full indicator. It has limitations on operation. This indicator detects the Engulfing candlestick pattern and draws the corresponding market entry signal.
Features It works only with EURUSD on timeframes M1 and M5. The indicator analyzes a combination of 2 or 3 candlesticks depending on settings. The number of pre-calculated bars (signals) is configurable. The indicator can send an alert to notify of a found signal. Signal can be filtered by setti
FREE

Corretora recomendada para usar esse indicador: https://tinyurl.com/5ftaha7c Indicador que pinta o candle de amarelo em pontos de muita agressão no mercado. Sempre que o mercado for se movimentar o candle irá ficar amarelo. Valido para todos ativos e todos timeframes. SEE OUR RESULTS ON INSTAGRAM: https://www.instagram.com/diogo.cansi/ TELEGRAM GROUP = https://t.me/robosdsc More information by email dscinvestimentos@gmail.com or by Whatsapp 55-991372299
FREE

The utility draws reversal levels using the formulas for each of the selected number of candles:
Pivot = (high + close + low) / 3 R1 = ( 2 * Pivot) - low S1 = ( 2 * Pivot) - high R2 = Pivot + (R1 -S1) R3 = high + ( 2 * (Pivot - low)) S2 = Pivot - (R1 - S1) S3 = low - ( 2 * (high - Pivot)) H = high L = low U = if the candle is bullish, then close. Otherwise - open D = if the candle is bullish, then open. Otherwise - close
On any timeframe.
After a new candle closes on the calculated timeframe
FREE

Simple script for Sell by Market Execution on all financial instruments.
Inputs Volume - default: 0.10 Deviation - default: 10 points Stoploss - default: 50 points Takeprofit - default: 50 points Comment - default: Order by Market Confirm - default: false
Inputs Details Type Order Sell Order is preset. Deviation Maximum deviation from quoted price in points. Stoploss & Takeprofit In points value, be careful that this value will be added to minimum stop allowed by the broker. For example if you
FREE
This script will create a report with all history orders in CSV format. The report is useful for those who run multiple EA's with different magic numbers in the same account. You can define some filters to generate your orders history report: 1) Initial date for assets in orders history. 2) Final date for assets in orders history. 3) Asset name. 4) Orders magic number. 5) Add balance/costs.
QUESTIONS ABOUT THE INSTALLATION OF PRODUCTS AT META TRADER You can also find some instructions on how
FREE

A small utility displays the time in five time zones. You can customize the display of one to five time zones. For each time it is configured: show or not; name; time offset from GMT; color; In general settings, you can change: date / time format ("hh: mi", "hh: mi: ss", "yyyy.mm.dd hh: mi", "yyyy.mm.dd hh: mi: ss") font name; font size; offset from the left edge of the chart; offset from the top edge of the chart;
FREE

This spread indicator displays the actual spread of each candle. It highlights the maximum spread and the minimum spread of the chosen symbol. This indicator is very helpful to see in real time the spread evolution helping to avoid taking a trade when the spread is too high.
Inputs:
Print value in Points: if true displays the spread as a whole number
D isplay minimum and maximum spread of the past N days: select the number of days to consider the maximum and minimum spread
Automatically adj
FREE

Dear friends, I present to you my TradeFields EA adapted for Forex , modeling is based on machine learning using averaging and grid trading. The EA is a fully automatic light version and it is intended for trading in a single currency mode with a fixed micro lot and has only trading session intervals for all days of the week as external settings. You can find professional versions of advisors with many settings and many additional functions at the following links: https://www.mql5.com/r
FREE
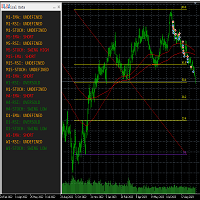
This tool helps to get a quick overview of a market. In one panel, indicators show trend, swing highs/lows and overbought/oversold information of various time frames (M1,M5,M15,H1,H4,D1,W1). Fibonacci can be used to identify different price levels. The input parameters of all indicators can be set by the user. The time frames can be changed as desired. The user can decide for himself which indicators he would like to see in the panel. Fibonacci appears on the chart at the next minute change at t
FREE

Donation: USDT (TRC20) : TJhnnAGwkJqVyAM69Uq9fuDFNxfu1X1c9x USDT (BEP20/KCC/ERC20) : 0x0b9a736E6178F47450322936170213d419C4A7c0
You can use this expert to execute Martingale orders for you open positions. This expert will add to your positions with a pre-defined loss step.
For choosing open positions you can use Symbol Name or Magic Number . Also the loss step will be defined by currency or pips. All positions that refer to a certain order will be closed by entered Profit from input section.
FREE

Highly configurable Relative Vigor Index (RVI) indicator.
Features: Highly customizable alert functions (at levels, crosses, direction changes via email, push, sound, popup) Multi timeframe ability ( higher and lower timeframes also) Color customization (at levels, crosses, direction changes) Linear interpolation and histogram mode options Works on strategy tester in multi timeframe mode (at weekend without ticks also) Adjustable Levels Parameters:
RVI Timeframe: You can set the lower/higher t
FREE
The Expert Advisor is recommended for USDCHF M15. It is based on the strategy of "waiting out", the market entry (and exit) points are determined on the basis of correlation of a number of indicators. The trading volume for opening a position depends on results of previous trades. It is possible to limit the amount of risk (the AutoMM parameter). It is also possible to set the maximum spread, above which the EA will automatically suspend trading (the MaxSpread parameter). It also has advanced fe
FREE

Tick Speed Free povides a on-chart label of tick speed to allow you to see the ebb and flow of market activity. Observing rises and falls in tick speed may allow you to better time entries to reduce slippage and re-quotes.
Options include: - colores for low-mid-high tick speeds - placement and styling - prefix & suffix to customise the speed label
Troubleshooting: - Note, in the tester environment, tick timings are limited to what is supplied by the tester environment and it's speed
- If there
FREE

The "Takeandstop" script is a powerful tool designed to streamline your trading workflow by automatically setting Take Profit (TP) and Stop Loss (SL) levels on your MetaTrader 5 chart. This script is particularly useful for traders who want to efficiently manage their risk and reward without the hassle of manually calculating and entering these levels. Key Features: Effortless TP and SL Placement: With a few clicks, the script allows you to set predefined Take Profit and Stop Loss levels for you
FREE

Algo Trader Exposure Chart Exposure Chart - 在 MetaTrader 5 中可视化监控市场敞口 Exposure Chart 是一款必不可少的工具,适用于希望在 MetaTrader 5 图表上实时可视化持仓分布和风险敞口的交易者。 通过 动态饼图 ,您可以跟踪每种交易资产,轻松管理多元化投资,并快速调整资产配置策略。 主要功能 可视化且可自定义的面板 显示交互式饼图,直观展示每种资产的持仓比例。 实时自动更新,反映交易开仓或平仓时的投资组合变化。 可自定义界面,可调整颜色和图表大小,以更好地适应 MetaTrader 5 的布局。 敞口监控 清晰直观地跟踪投资组合中的资产分布。 识别单一资产的过度集中,有助于风险管理。 兼容 外汇、股票、指数、加密货币 以及 MetaTrader 5 上的任何其他资产。 简单集成和快速设置 易于安装:只需将 Expert Advisor 添加到 MetaTrader 5,然后将其拖动到所需图表上。 在设置面板中快速启用和禁用。 提供高级自定义选项,包括更新调整、屏幕定位和面板对齐方式。 为什么选择 Exp
FREE

XAUUSD mining è utilizzato nell'ambito challengers delle PROP FIRM mantenendo sempre il DRAWDOWN MOLTO BASSO. IMPORTANTE:
prima di iniziare ad utilizzare il bot, inserite negli INPUTS il capitale con cui operare e la percentuale di rischio. Percentage of Capital Risk = percentuale di rischio per ogni operazione rispetto al Capital to risk Capital to Risk (CTR) = capitale che si vuole rischiare sul totale del bilancio
Quindi, il rischio per singola operazione si calcola così: Rischio per operaz

描述: VPS Health Check EA 是一款 MetaTrader 5 实用程序,旨在监控与经纪商的连接并及时提供有关连接状态的通知。此工具可确保您立即获悉任何连接问题,从而帮助维持交易活动的稳定性和可靠性。 特征: 连接检查模式: 选择检查每根新蜡烛的连接或一天中的特定时间的连接。 可自定义的时间: 设置计划连接检查的精确小时和分钟(24 小时格式)。 实时通知: 通过 MetaTrader 5 应用程序接收有关连接状态的即时通知。 信息显示: 直接在图表上查看最后的通知时间和消息,以便于参考。 输入: 模式: 选择连接检查的模式 Check_On_Each_Candle - 当图表上出现新蜡烛时将触发通知。 Check_At_Particular_Time- 默认选项,将在指定的经纪商时间(默认为 14:00)每天检查。 检查时间: 设置定期检查的时间(24 小时制)。 检查分钟: 设置定期检查的分钟数。 使用说明: 将 EA 附加到图表: 将 VPS 健康检查 EA 添加到 MetaTrader 5 中的任何图表。 如果您使用加密货币进行交易并且需要周末的 V
FREE
MT5用 サブウィンドウにスプレッドとBUY SWAP(BS)とSELL SWAP(SS)を表示するインジケーターです。
表示の文字フォントの大きさと色の設定、スプレッドの表示をPIPS表示もしくはPOINTS表示切替が可能ですので、チャートの色設定などに合わせて、お好みでご利用いただけます。 サブウィンドウの表示サイズに合わせて、その中央に表示するようになっています。
(ご協力お願いします!) こちらは無料でご利用いただけます。どうぞご自由にご利用ください。 もしよければ MS High Low indicator も紹介していますので、どうぞご参照の上、DEMO版のダウンロードをお試しください!
Happy Trading :)
FREE

The SpreadTracer and TimeLeft indicator is a powerful yet straightforward tool designed for traders who want to keep a close eye on market conditions directly on their chart. This custom indicator provides essential real-time information about the spread and candle time, making it easier to make informed trading decisions. Key Features: Current Spread Monitoring : The indicator constantly displays the current spread of the trading pair, helping you assess the cost of entering or exiting a positi
FREE

OrderBook Utilities is a script, which performs several service operations on order book hob-files, created by OrderBook Recorder . The script processes a file for work symbol of the current chart. The file date is selected by means of the input parameter CustomDate (if it's filled in) or by the point where the script is dropped on the chart. Depending from the operation, useful information is written into the log, and optionally new file is created. The operation is selected by the input parame
FREE
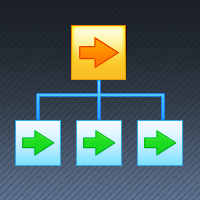
If you want something as below: Sell FOREX trading signal. Manage multiple accounts. Follow the trading from somebody. "TradeCopier_follow" and "TradeCopier_source" can help you! Features: Copying from one source (master) account to multiple follower (slave) accounts. Allow investor (read only) password for the source (master) account. There are no complicated settings and input parameters, everything is easy. Works with different Brokers. Works with different symbols (EURUSD_FX, eurusd_m, e
FREE

izi hedge is a tool that helps you manage risk, manage hedge orders and rebalance losing orders.
How it works It will place an order opposite to the order you placed with that currency pair. If the order you place is correct, the reverse order will be automatically deleted If the market unfortunately goes against your order and touches the hedge order, it will begin to calculate the hedging volume to limit the risk of the market going in reverse.
FREE

1. The Expert Adviser is built with a basic, simple and stable trading strategy with a touch of Price Action Principle that is highly effective and accurate for a sniper entry system. The EA have a good money management System.. 2. The expert advisor works best as from 5minutes time frame and above, The higher the time frame, the more accurate is the signal.... 3. The expert advisor work with all broker all currency pair and synthetic indices... 4. Use a reasonable lot size and correct settings
FREE

The Equity Closer Bot is a custom MetaTrader 5 (MT5) Expert Advisor (EA) designed to help traders manage their account equity levels automatically. It monitors the account's equity in real-time and closes all open trades when the equity reaches user-defined thresholds. This bot is ideal for traders who want to enforce strict risk management rules, protect their account from excessive losses, or lock in profits at specific equity levels. Key Features Dual Equity Thresholds : Below Equity Clos
FREE

日历新闻指标 是您进行明智交易的必备工具,可实时更新经济事件和金融新闻。以下是它为您的交易策略带来的优势: 实时更新: 通过关键经济指标、央行公告和影响市场的地缘政治事件的即时通知,保持领先一步。 全球覆盖: 追踪全球市场的经济事件。无论您交易外汇、股票还是大宗商品,都能获得全球视角,帮助您做出明智决策。 影响分析: 一目了然地查看即将发生事件的预期影响。指标会突出显示高、中、低影响事件,方便您根据优先级进行关注。 指标描述:经济日历部门图标 此指标通过将经济日历事件分类为特定部门来提供直观的事件展示。每个部门都有独特的符号表示,使交易者无需详细文字描述即可快速解读市场影响。以下是各部门使用的图标: 市场 () – 表示影响整个金融市场的一般市场事件。 GDP () – 与国内生产总值相关的事件,反映经济增长和生产力。 就业 () – 突出就业数据,包括工作岗位增加和失业率。 价格 () – 表示价格指数,包括通货膨胀和生活成本调整。 货币 () – 涉及货币政策公告、利率和金融流动性。 政府 () – 涵盖政府决策,包括财政政策和影响市场的政治事件。 商业 () –
FREE

如果您喜欢这个免费工具,请留下 5 星评级! 太感谢了 :) “风险管理助手”EA 集合是一套全面的工具,旨在通过有效管理各种市场条件下的风险来增强交易策略。 该系列由三个关键组件组成:平均、转换和对冲专家顾问,每个组件都针对不同的交易场景提供独特的优势。
该 EA 是市场上标准风险管理策略的发展
https://www.mql5.com/en/blogs/post/756961
1.“平均助手”EA: MT4: https://www.mql5.com/en/market/product/115468 MT5: https://www.mql5.com/en/market/product/115469 2.“切换助手”EA: MT4: https://www.mql5.com/en/market/product/115478 MT5: https://www.mql5.com/en/market/product/115428 3.“对冲助手”EA: MT4: https://www.mql5.com/en/market/product/115466 MT5: https://
FREE

Simple script for Buy by Market Execution on all financial instruments.
Inputs Volume - default: 0.10 Deviation - default: 10 points Stoploss - default: 50 points Takeprofit - default: 50 points Comment - default: Order by Market Confirm - default: false
Inputs Details Type Order Buy Order is preset. Deviation Maximum deviation from quoted price in points. Stoploss & Takeprofit In points value, be careful that this value will be added to minimum stop allowed by the broker. For example if you s
FREE

RSI Scanner, Multiple Symbols and Timeframes, Graphical User Interface An indicator that scans multiple symbols added from the market watch and timeframes and displays result in a graphical panel. Features: Multi symbol Multi timeframe Alerts and Notifications Live Monitoring Sorting modes One click to change symbol and timeframe Inputs for RSI and scanner settings
FREE

Time Range Breakout EA AFX – Precision Trading with ORB Strategy! Capture Market Trends with High-Precision Breakouts!
Time Range Breakout EA AFX is a powerful and fully automated trading system based on the Opening Range Breakout (ORB) strategy. It identifies key market movements and executes trades with precision and safety —without risky martingale or grid methods! Why Choose Time Range Breakout EA AFX? Proven ORB Strategy – Used by professional traders worldwide.
No Martingale /

The Available Range Bands Technical Indicator draws two lines on the chart indicating the maximum limits (bands) expected for buying and selling for the current period (candle). These limits can be accessed by buffers 0 and 1 respectively.
In addition, it displays in the lower right corner the current average values of the real volatility, the last price, the predicted range of movement available for buying (% and points) and the predicted range of movement available for selling (% and points)
FREE

Простейший индикатор для ручной торговли. Для комфортной торговли так же имеется эксперт https://www.mql5.com/ru/market/product/41133
Суть идикатора: уровни строяться на основе Moving Average с выбранным периодом по ценам High и Low. На разнице между High и Low строятся следующие уровни выше и ниже. В случае если бар не выходит за уровни, помечается зеленой меткой. Данную метку и уровни можно использовать для выставления отложенных ордеров когда цена на долго застревает между уровнями. Входные
FREE

To download MT4 version please click here . This is the exact conversion from TradingView: "RSI versus SMA" By "JayRogers". This indicator lets you read the buffers for all Lines on chart. Note: This is an indicator, Not an expert. Meaning It does not take trades. If you want the EA please contact via message. You can easily use the indicator to understand the logic behind trades that the TradingView strategy takes. The strategy is profitable if this indicator is applied to the right symbol at
FREE

This is a rate of change chart from the baseline. features. comparison of max 5 symbols. free baseline with drag. free timeframes of the sub window. reverse chart selectable if you need.
i.e. set symbols "-US100" notes In the sub window, you can't believe datetime on the chart, because the numbers of bars are different. You can check the baseline if you click symbol name. The dragged baseline is temporary. You must set it to indicator's parameter if you need.
FREE

xCalper Economic Calendar brings economic calendar information to your Terminal chart and Experts from online sources. Just add it to your chart to see detailed news without losing attention or automate reading of calendar information to improve trading decisions.
Main Features Support data sources: Forex Factory. Filtering by day, impact or currency of news. Visual alert of upcoming news. Platform notification of upcoming news.
Parameters Filters Impact expected - Show/Hide by impact: Low, Me
FREE

The ColorBars Indicator paints bars with different colors depending on the volume changes. If the volume has increased, the color is green, overwise the color is red.
FREE

Time to Trade Trading timing indicator is based on market volatility through 2 ATR indicators to determine the timing of a transaction. The indicator determines the times when the market has strong volatility in trend. When histogram is greater than 0 (blue) is a strong market, when histogram is less than 0 (yellow) is a weak market. Should only trade within histograms greater than 0. Based on the histogram chart, the first histogram value is greater than 0 and the second histogram appears, this
FREE

When the market breaks the glass ceiling someone has to use the broom and pick up the glass from the floor.
Broom is the system that detects this break and collects the crystals.
Being a very aggressive scalping system, it should only be used in pairs with a low spread and low commissions.
This system is suitable for small accounts and can be used with only $ 100.
You can download the demo and test it yourself.
Very stable growth curve as result of smart averaging techniques.
"Safety f

This simple indicator helps defining the most probable trend direction, its duration and intensity, as well as estimate the possible range of price fluctuations. You can see at a glance, at which direction the price is moving, how long the trend lasts and how powerful it is. All this makes the indicator an easy-to-use trend trading system both for novice and experienced traders.
Parameters Period - averaging period for the indicator calculation. Deviation - indicator deviation. Lag - calculatio

The Expert Advisor is used to create Renko chart, realtime updates, easy for technical analysis. Backtest your strategy with all indicators with Renko chart in MetaTrader 5.
Parameters Box Size : input the number of box size. Show Wicks : if true , draw a candle with high/low. History Start: input the date to creat first candle.
Maximum Bars: limit number of bars on renko chart
How to use Attach the Expert Advisor to a chart (timeframe M1), for which you want to create a renko. Input box size a
跟单->方便快捷的界面交互,用户上手即用 ->>>> 推荐在windows电脑,或者VPS Windows上使用 特色功能: 多样化个性跟单设置: 1.对不同的信号源可以设置不同的手数模式 2.不同的信号源分别设置正向反向跟单 3.信号分别设置注释 4.是否根据合约手数校准手数 多样化个性跟单设置2: 1.对不同的品种可以设置不同的手数模式 2.不同的品种分别设置正向反向跟单 3.信号分别设置注释 4.是否根据合约手数校准手数
注释过滤,MAGIC过滤,信号手数过滤,本地品种过滤 工作时间设置 反向同步接收端的平仓 订单绑定功能:任意订单可以绑定到设置信号源订单上(双击表格更改) 账户风险控制 基本功能: 跟单正常交互速度0.5s以下 自动检测信号源,并显示信号源账号列表 自动匹配品种,不同平台常用交易品种(后缀不同等特殊情况)95%自动匹配,基本无需手动设置,品种映射表可随意双击更改对应品种.(映射表具有快速搜索品种功能) 4种手数计算模式(1.倍率 2.固定手数 3.自适应资金风险 4.源账户资金比例风险) 特殊手数模式:可以根据止损资金风险反算手数(可能止损过小计算的
FREE

The indicator measures and displays the difference in the number of "Bid" and "Ask" prices changes in the form of digital, analog and graphic indicators. Designed for market research and for determine the moments of position closing during scalping trade with H1 or less timeframe. Use with bigger timeframe is not prohibited, but it is not informative because of a large number of accumulated values. Theory
"Bid" and "Ask" prices do not change simultaneously for most symbols. Often you can see ho
FREE

Este indicador imprime 2 médias com distância de 1 ATR (Average True Range) da média principal. As demais médias móveis só são mostradas se estiverem fora desse intervalo. Parâmetros: mediaprincipal = Média que será criado o intervalo, não será mostrada. mediasec1, mediasec2, mediasec3 = médias secundárias. periodatr: periodos do ATR Este indicador faz parte do Trade System MarketStrengthRadar
FREE

Looking for a way to manage account drawdown for Prop Firms or general risk management purposes? Look no further; this simple expert advisor does exactly that!
Account Balance Percentage Limit If your current account balance is $5000 and you set a 10% limit ($500), Equity Sentinel will close all trades when the account equity reaches equal or less than $4500 and close all charts.
Floating Drawdown Percentage Limit If your current account balance is $5000 and you set a 5% limit ($250), Equity S
FREE

Price live on the Chart Description: The Real-Time Price Display is a powerful tool for MetaTrader 5 users that provides continuous updates of the current bid (SELL) and ask (BUY) prices directly on your trading chart. This script is ideal for traders who need to stay updated on market prices at a glance. Key Features: Live Price Updates : Displays the latest bid and ask prices for your selected trading symbol in real-time. Customizable Display : Adjust the horizontal and vertical position of th
FREE

Quick Close Pro by one click: * Close Buy positions * Close Sell positions * Close Win positions * Close All positions * Close All pending orders * Close All by Mobile: Select true to close all positions quicky from your Mobile by closing any position on Mobile. To close all positions by one click from your Telegram, please refer Master Close . Join my channel here for more useful EAs. Thank you!
FREE

How to Use All Symbols Opener Preparation : Open any symbol chart in your MetaTrader 5 platform. Select your preferred time frame for the open chart (e.g., M5, H1, D1). Launch All Symbols Opener : Attach the All Symbols Opener utility to the currently open chart: Drag and drop it from the Navigator window under Experts onto the chart. Alternatively, double-click All Symbols Opener from the Navigator to activate it. Automatic Operation : The tool will detect the active chart’s time frame and appl
FREE

The indicator shows the current spread of the symbol, the minimum, average and maximum values for the current bar in the form of digital, analog and graphic indicators. Has two modes of operation: fixing the system spread, or calculating the spread as the difference between the "Bid" and "Ask" prices on each incoming tick. Parameters The indicator has a single input parameter: Type of calculation - type of spread calculation. It can take the following values: System spread - the spread value
FREE

It is the very same classic Stochastic indicator, but with a little twist: NO NAME and data is shown in the sub window. It could be stupid, BUT, if you are running out of space in Micro windows like Mini Charts, where the indicator's name is totally useless, you came to the right place. And that's it! I know it seems stupid but I needed the classical version of Stochastic indicator without that annoying name on my Mini Chart, so I did it that way... The original formula is right from Metaquote's
FREE

Advanced Trend Builder is a trend indicator using the original calculation algorithm. ATB can be used on any data and timeframe. My recommendation use for calculation numbers 4 - 16 - 64 - 256 and so on ..., but this is only recommendation. The middle of the trend wave is a special place where market behavior is different, when developed ATB was main idea to find the middle of the wave trend. Input parameters: Bars will be used for calculation - number of bars used for a trend line calculation.
FREE
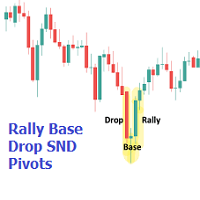
The Rally Base Drop SND Pivots indicator uses "Rally", "Base", and "Drop" Candles to determine pivot points at which supply and demand (SND) levels are drawn. (Figure 1) USAGE Figure 2 Rally, Base, and Drop (RBD) candles create a formula for seeing market structure through a fixed methodology. We are able to use this concept to point out pivot areas where Rallies and Drops directly meet.
The RBD SND Pivots are similar to traditionally identified "fractal" pivot points, with one key differ

Attention! Contact me immediately after purchase to receive detailed setup instructions! Deriv Synergetic MT5 Advisor is your reliable assistant on the Forex market. It uses key market patterns, such as price reversal after sharp movements in any direction. This is a fully automated trading system that requires no special skills from you. Simply launch the advisor and enjoy your free time — it will handle everything for you. Trading pairs: AUDCAD
Minimum deposit: The higher the deposit, the mor

FREE

A scalping indicator based on mathematical patterns, which on average gives signals with relatively small SL, and also occasionally helps to catch big moves in the markets (more information in the video)
This indicator has three main types of notifications: The first type warns of a possible/upcoming signal on the next bar The second type indicates the presence of a ready signal to enter the market/open a position The third type is for SL and TP levels - you will be notified every time price re

A simple and efficient indicator that plots and updates the 50% of the current day, for those who use this point as a reference in day trading.
On trend days the 50% region tends to be a good resistance point, ideal for making new entries.
On non-trend days (sideways) the 50% region is great for carrying out positions.
In addition, for study or back-testing criteria, you can define the amount of previous days to be plotted by the indicator.
For questions or suggestions, please contact us. A
FREE

The custom Bollinger Bands Height indicator measures and displays the current state of the Bollinger Bands indicator, showing whether the bands are widening (moving away from each other) or narrowing (starting to converge). Contraction, indicated by the narrowing of the bands, suggests that the current market movement is losing momentum and hints at the potential start of a new strong movement. This can be a signal to look for an opportune moment to enter a position, as a sharp price change may
FREE
MetaTrader市场是 出售自动交易和技术指标的最好地方。
您只需要以一个有吸引力的设计和良好的描述为MetaTrader平台开发应用程序。我们将为您解释如何在市场发布您的产品将它提供给数以百万计的MetaTrader用户。
您错过了交易机会:
- 免费交易应用程序
- 8,000+信号可供复制
- 探索金融市场的经济新闻
注册
登录