适用于MetaTrader 5的EA交易和指标 - 69

Probability emerges to record higher prices when RVi breaks out oscillator historical resistance level. It's strongly encouraged to confirm price breakout with oscillator breakout since they have comparable effects to price breaking support and resistance levels; surely, short trades will have the same perception. As advantage, a lot of times oscillator breakout precedes price breakout as early alert to upcoming event as illustrated by last screenshot. Furthermore, divergence is confirmed in
FREE

共 10 份,仅剩 2 份,价格为 99 美元! 此后,价格将上调至 199 美元。
- 真实信号: 50K 实时信号: 点击这里 Your Last Hope 是一款可靠的 EA,采用经过 10 多年数据测试的成熟入场策略,每天进行一次高质量交易。它专注于保持可控的风险 所有交易均使用止损比率,而不采用网格或马丁格尔等风险方法。EA 可在任何时间范围内工作,但建议使用 H4 以获得基于较低时间范围内数据分析的最佳性能。 限价 99 美元,仅限前 10 笔销售。10 笔销售后,价格将上涨 +100 美元。Gold Scalper Trading 的最终价格为 1999 美元。 外汇EA交易频道: 更新我的最新消息
一些特点:
- 请勿使用任何危险的交易方法:无网格、无马丁格尔......只需一笔交易
- 订单始终受到止损保护 - 使用默认设置优化 EA - 易于使用 - 智能时间过滤器,避免意外下跌、上涨、差距...... ...
该策略在 2014 年至 2024 年期间使用基于 MT5 中真实报价的每一个报价进行了回测,采用 Dukascopy 真实
The Equity Closer Bot is a custom MetaTrader 5 (MT5) Expert Advisor (EA) designed to help traders manage their account equity levels automatically. It monitors the account's equity in real-time and closes all open trades when the equity reaches user-defined thresholds. This bot is ideal for traders who want to enforce strict risk management rules, protect their account from excessive losses, or lock in profits at specific equity levels. Key Features Dual Equity Thresholds : Below Equity Clos
FREE
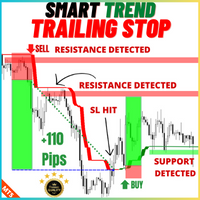
Smart Trend Trailing Stop Indicator, Forex trend tracking tool, Trend-following stop loss, Trend band visualization, Stop loss optimization, Trend trading strategy, Trailing stop technique, Smart stop placement, Trend continuation tool, Band for trend tracking, Forex trend analysis, Stop loss below trend, Trend following without premature stop loss hit, Smart stop loss placement, Trend squeeze strategy, Trailing stop for trend trading, Forex trend optimization, Band for trend tracing, Maximize

Recovery System EA The advisor is designed to automate the process of recovering losses on the current symbol. It can be used if there is a current loss, as well as to accompany other advisors. This product can also be used as a stand-alone advisor.
Recovery System EA contains in the settings an option to select the operating mode: Recovery MA Cross Stochastic Bollinger Bands Non-indicators When working in Recovery mode, the advisor removes a losing position from a drawdown using the method sho

Coulter_Precision — Enhance Your Market Potential with Precision and Control Coulter_Precision is a professional trading advisor designed for traders who seek to control every aspect of their strategy on the market. By working exclusively with pending orders, this EA allows you to focus on planning entry points and managing risks, leaving the mechanical part of the work to an automated assistant. The unique feature of Coulter_Precision is that it does not make decisions on its own about the trad

Heikin Ashi candlesticks are a powerful tool for traders, offering a clear and smooth visualization of market trends. Unlike traditional candlesticks, they filter out market noise, providing a cleaner view of the market's direction and strength, which helps traders make more informed decisions. The Hull Heikin Ashi Smoothed indicator from Minions Labs takes this a step further by integrating the Hull Moving Average for enhanced smoothing and precision. This indicator not only simplifies trend id

Definition :
Risk Monitor is an expert for Analyzing, monitoring, controlling account risks.
Strategy :
Analyze Each Currency Volume and Direction on Account and Sort Them Find and Suggest Best Three Symbols in Opposite Direction (Hedging Positions) for Controlling Risk. Analyze User-Defined Position and preview effect before placing /Closing
Features of EA :
Graphical Interface Show Risk Graph for each currency Smart Analyze and suggest best hedging positions
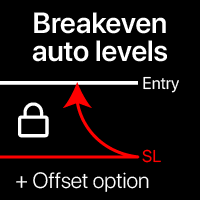
Automatic Breakeven levels Using this utility , y ou can activate the automatic SL movement, when the trade reaches a desired profit. Especially important for a short -term traders. Offset option is also available: some profit may be protected. My #1 Utility : 65+ features, including this tool | Contact me if you have any questions | MT4 version The process of activating the automatic breakeven function: 1. Select the Symbol or Trade for which the Auto BE function wil

这是一个组合指标分析趋势、支撑阻力、买卖点。运用了均线MA、布林带、KDJ、CCI、RSI。 主图上下线是布林带上下线,采用的是20周期和2.3标准差可以用来支撑阻力。 中间的是分析趋势的均线,趋势分析是用均线多周期: 为涨趋势,反之为下跌趋势。在同一种颜色,基本说明趋势没有发生变化。 子图是由 KDJ、CCI、RSI三个指标组成,大于70超买,小于30超卖, 智能提示是运用了算法,主要计算布林带, KDJ、CCI、RSI指标
有三个或四个指标超出市场常态就会发出提示行情可能反转。 子图指标运用了很多数据,刚刚开始加载会有点慢,耐心等待就可以 这个指标是主图指标,还要再下我发布的RCD分析,这样就刚刚好组成一套分析 电脑分辨率的文本大小请设置100%,不然字体会不一样
FREE

Volume is a widely used indicator in technical analysis, however there is a variation that is even more useful than Volume alone: the Moving Average of Volume.
It is nothing more than a moving average applied to the popular Volume indicator.
As the name says, Volume + MA serves to display the transacted volume (purchases and sales executed) of a certain financial asset at a given point of time together with the moving average of that same volume over time.
What is it for? With the Volume + M
FREE

HiperCube Tornado is here! Discount code for 25% off at Darwinex Zero: DWZ2328770MGM HiperCube Tornado is a simple but effective indicator that helps you to identify when a new bull or bear power is near. Easy to use Custom Colors Separate windows indicator TEMA is used to do calcs Custom Periods Custom Method Chat GPT and AI used to be developed Strategy Wait to TI+ cross the TI- Thats means ,signal to buy
Wait to TI- cross the TI+ Thats means , signal to sell
Remmenber combines this with
FREE

EA to help traders stay within tight risk management.
Asks only for account's initial balance and Stop Out DD. This is meant for prop firm traders, but will help any trader who is looking for a simple risk manager.
Trasks and reports daily PnL and will advise you to stop at 1% daily loss. Will advise you to wait if you have too many open trades.
Based on the open chart (symbol and timeframe) will recommend size and SL distance in order to risk the desired cash risk. See screenshot for example
FREE

The DuettoFXTompson indicator is designed to work with two instruments that have a high level of correlation. the indicator can be used for pair trading on currencies, stocks, and other financial instruments. The indicator shows the moment when the instruments diverge and the sum of the two instruments (yellow line). additionally, the parameter of the Average MA value is calculated.
Recommended timeframe for M5 operation. Contacts for communication 777basil@mail.ru we will prepare an expert, an
FREE
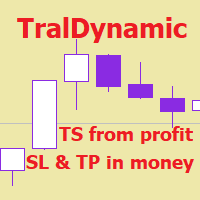
The utility for managing open positions can work with stops (take profit and stop loss) in money, percentages or points. The built-in trailing stop starts working from profit, the size of which can be set in currency or as a percentage. With the help of the built-in trading simulator, you can check how the utility works in the strategy tester. Benefits setting stop loss and take profit in the deposit currency, as a percentage of the account balance or by points; adding stop loss and take profit

You've probably heard that different brokers give different results? But what is the main problem when brokers have approximately the same trading conditions for spreads and commissions,you have the same ping.. but the results of trading on real accounts are very different. What's the matter?
There are situations when even good advisors give bad results and the point here may not be in the adviser, but in the broker and you can draw the wrong conclusion about the adviser without getting a good
The Expert Advisor is recommended for USDCHF M15. It is based on the strategy of "waiting out", the market entry (and exit) points are determined on the basis of correlation of a number of indicators. The trading volume for opening a position depends on results of previous trades. It is possible to limit the amount of risk (the AutoMM parameter). It is also possible to set the maximum spread, above which the EA will automatically suspend trading (the MaxSpread parameter). It also has advanced fe
FREE

Live Monitoring: https://www.mql5.com/en/signals/2252642 Quant ML JP225 is a bot tailored for instruments related to the Tokyo / Nikkei index, operating on the H1 timeframe. This bot is created and validated using machine learning algorithms, with a focus on maintaining strategy stability. It: Utilizes only market entries with fixed ATR-based SL and TP levels. Does not employ trailing stops, breakevens, martingale, grid, or adding additional positions when the initial position is in the red
FREE

The indicator generates early signals basing on ADX reading data combined with elements of price patterns. Works on all symbols and timeframes. The indicator does not redraw its signals. You see the same things on history and in real time. For better visual perception signals are displayed as arrows (in order not to overload the chart).
Features The best results are obtained when the indicator works on two timeframes. For example: M30 – the indicator shows the main trend; M5 – the indicator gen
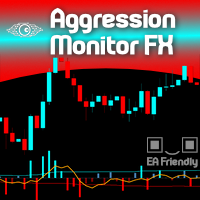
Would you like to monitor the aggression between Buyers and Sellers, minute by minute? Now you can! Welcome to the Aggression Monitor FX ! The Aggression Monitor FX indicator was developed for those markets that do not provide REAL data Volume, i.e. like the Forex market. We developed a way to use 1-minute Tick Volume data generated by Forex (and other) Brokers and manipulate it into "aggression" information in a very visual histogram with additional analysis lines. And it worked! (but hey! you

FXRog = Forex Running On Growth
Expert Advisor description ShortTerm : Yes MidTerm : Yes LongTerm : Yes TargetProfit : By Money, value can be changed in the parameter StopLoss : By Maximum Open Position, all position will closed when maxtrade is reach, value can be changed in the parameter
Parameter description StartTrade : begining time to start trading EndTrade : last time ea to open a position MoneyManagement : 1 = FixLot, 2 = VolumeLot FixLot : lot of transactions with a fixed amount
FREE

Looking for a way to manage account drawdown for Prop Firms or general risk management purposes? Look no further; this simple expert advisor does exactly that!
Account Balance Percentage Limit If your current account balance is $5000 and you set a 10% limit ($500), Equity Sentinel will close all trades when the account equity reaches equal or less than $4500 and close all charts.
Floating Drawdown Percentage Limit If your current account balance is $5000 and you set a 5% limit ($250), Equity S
FREE

Algo Trader Exposure Chart Exposure Chart - 在 MetaTrader 5 中可视化监控市场敞口 Exposure Chart 是一款必不可少的工具,适用于希望在 MetaTrader 5 图表上实时可视化持仓分布和风险敞口的交易者。 通过 动态饼图 ,您可以跟踪每种交易资产,轻松管理多元化投资,并快速调整资产配置策略。 主要功能 可视化且可自定义的面板 显示交互式饼图,直观展示每种资产的持仓比例。 实时自动更新,反映交易开仓或平仓时的投资组合变化。 可自定义界面,可调整颜色和图表大小,以更好地适应 MetaTrader 5 的布局。 敞口监控 清晰直观地跟踪投资组合中的资产分布。 识别单一资产的过度集中,有助于风险管理。 兼容 外汇、股票、指数、加密货币 以及 MetaTrader 5 上的任何其他资产。 简单集成和快速设置 易于安装:只需将 Expert Advisor 添加到 MetaTrader 5,然后将其拖动到所需图表上。 在设置面板中快速启用和禁用。 提供高级自定义选项,包括更新调整、屏幕定位和面板对齐方式。 为什么选择 Exp
FREE

An indicator for analyzing different currency pairs simultaneously Forex is a complex market that requires several currency pairs to be analyzed simultaneously Determine the number of currency pairs yourself Determine the currency pair you want to analyze to analyze 4 of the most important and similar currency pairs at the same time. For direct and simple analysis, some currency pairs have changed (EURUSD>>>USDEUR) Do not doubt that to succeed in this market, you must analyze several currency pa
FREE

A Swing Failure Pattern ( SFP ) is a trade setup in which big traders hunt stop-losses above a key swing high or below a key swing low for the purpose of generating the liquidity needed to push price in the opposite direction. When price 1) pierces above a key swing high but then 2) closes back below that swing high, we have a potential bearish SFP . Bearish SFPs offer opportunities for short trades. When price 1) dumps below a key swing low but then 2) closes back above that swing low, we have
MT4 Version Available Here: https://www.mql5.com/en/market/product/48040
Telegram Channel & Group : https://t.me/bluedigitsfx
V.I.P Group Access: Send Payment Proof to our Inbox
Recommended Broker: https://eb4.app/BDFXOsprey
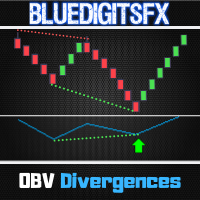
* Non-Repainting Indicator To Trade Divergences for any Newbie or Expert Trader ! BlueDigitsFx's OBV Divergence draws divergence lines on the chart and on the On Balance Volume (OBV) Indicator. Performs Amazingly at significant price areas such as support and

SlopeChannelB – 一种技术分析工具,构建倾斜的价格运动通道,为评估当前市场状况和寻找交易信号提供独特机会。 指标的主要特点: 倾斜的价格运动通道 :
该指标有助于可视化支持和阻力水平,这些水平可能表明潜在的反转点或趋势持续。 线条颜色多样和背景突出显示 :
倾斜的支持和阻力级别以不同颜色显示,通道本身还通过背景额外突出,简化图表的视觉分析。 三种计算线条的选项 :
指标使用回归分析来构建通道线。您可以选择以下三种方法之一: Robust (默认) – 对异常值具有鲁棒性的方法。 OLS (普通最小二乘法) 。 Median (中位数计算) 。 最优模型选择 :
SlopeChannelB根据五个质量标准的分析自动选择最适合的通道线变体。
质量参数直接在图表上显示,帮助您评估结果。您还可以使用按钮手动切换通道构建选项。 双信号系统 : 第一信号 – 当价格达到倾斜的阻力或支持级别时发生。 第二信号 – 记录价格从级别到通道中心的移动。
这些信号有助于寻找反弹的入场点,但始终需要其他工具的确认。 与其他指标联合使用 :
建议将SlopeChannelB与振荡器或趋势

Highly configurable Volume indicator.
Features: Highly customizable alert functions (at levels, crosses, direction changes via email, push, sound, popup) Multi timeframe ability Color customization (at levels, crosses, direction changes) Linear interpolation and histogram mode options Works on strategy tester in multi timeframe mode (at weekend without ticks also) Parameters:
Volume Timeframe: You can set the lower/higher timeframes for Volume. Volume Bar Shift: you can set the offset of the l
FREE

You may have found after a carefully planned trade something happened. An unexpected event... You forgot to look the web calender or use any kind of program. This fills this gap in its own way. Features: - show all events as vertical lines - low, medium or high events... with different colors. -name of the events and numbers associated with the event are also shown such actual value, forecast value and previous value.
The calendar information is obtained from your broker. It is a built-in serv
FREE

--- StudentK Sync Chart --- 1. Move charts at the same time 2. Cross check among different Symbols and Timeframes 3. Plan your own trading strategies
=== Simple (Free) Version ===
1. Allow USDJPY only
2. Support M5 and M15
3. * Contact StudentK for unlocking all timeframes *
--- Context --- StudentK is not indicated as a master or K Sir for knowledgeable person who claims for winning all the time. (But lots of traders should know the fact that it is rarely truth, especially in fluctuated per
FREE

Versión Beta El indicador técnico Non Lag MA MTF (Non-Lagged Moving Average Multi-Time Frame) es una versión avanzada del Non Lag MA que permite visualizar la media móvil en varios marcos temporales simultáneamente. Pros: - Visión integral: Proporciona una visión más completa al mostrar la media móvil en diferentes marcos temporales en un solo gráfico. - Anticipación de tendencias: Ayuda a anticipar cambios de tendencia al observar la convergencia o divergencia de las medias móviles en distint
FREE

NOW FREE!!
Introducing RichRush EA, This expert advisor, armed with cutting-edge trading strategies, can assist on your path to navigating the forex market. Optimized specifically for EURUSD, RichRush EA operates on moving averages, and calculated lot sizes to manage risks. The EA interprets market movements, adjusts to volatility, and aims to identify entry points. As part of our commitment to providing top-tier trading tools, we invite you to explore our range of premium products designed to
FREE

NoLoser是根據信號產生器做出交易決定後再根據現有的資金量調整下單的單量 只支持歐美貨幣對使用
NoLoser設計目的希望所有參與交易的交易者,都能夠獲取合理的利潤 值得注意的是,過去的歷史回測匯或許會有相當大的利潤發生.但是將來的行情型態是不可知的.所以不要盲目地相信EA會創造出絕對的利潤,但也不要一昧地認為自動交易就是不可取的
特點 自適應的交易信號: 根據市場狀況自動調節信號產生的條件 自適應的單量計算: 根據現有資金狀況調整可以進場的單量.資金量高的時候,獲利隨之增加,反之資金量減少時,虧損隨之減少. 簡單的設定方式: 只需簡單的設定,調整信號的計算範圍即可.
啟動資金必須在2000美金以上 才能確保交易帳戶的安全
購買後聯繫賣家,可提供進階的工程版,可以做更完整的歷史測試.
FREE

This is an EA (Expert Advisor) supporting Trailing Stop. Key Parameters: Trailstart (Point): The starting point of trailing from the average price of buy or sell orders. Trailstep (Point): The Trailing Step value. Comm (Point): Commission fee per lot for the account, typically calculated in USD. However, you need to convert it into points. For example, if the EU pair's commission per lot is $7, you convert it to 7 points. Times to modify real StopLoss (seconds): The time interval for modifying
FREE
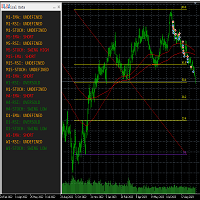
This tool helps to get a quick overview of a market. In one panel, indicators show trend, swing highs/lows and overbought/oversold information of various time frames (M1,M5,M15,H1,H4,D1,W1). Fibonacci can be used to identify different price levels. The input parameters of all indicators can be set by the user. The time frames can be changed as desired. The user can decide for himself which indicators he would like to see in the panel. Fibonacci appears on the chart at the next minute change at t
FREE

Smart Trend Line Alert , available for MT5 is a unique professional Trend Line, Support Line and Resistance Line Touch and Break out Alert with awesome Alert History feature, designed to help traders easily manage many charts and symbols without staring at the monitor.
Features Candle Break Out Alert, Price Touch Alert and Time Line Alert; 1 click for converting any drawn line into an alert line (Trend line and Horizontal line or Trend Line By Angle); Alerts History able to re-open closed chart
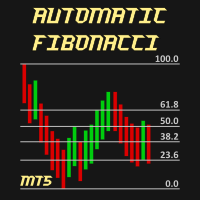
Automatic Fibonacci is an indicator for automatic Fibonacci Levels drawing. It is fully customizable by user. User can also select different Fibobonacci Levels by user settings or can use multiple Automatic Fibonacci indicator in one chart.
All details can be found >>HERE<<
Instructions Move Indicator to the chart (simply drag and drop) When pop up window appears select desired settings. Confirm settings and enjoy the Automatic Fibonacci indicator.
Features Any chart Any time-frame Custom

This indicator solves the problem of chart scaling where the bar becomes too thin and it becomes difficult to determine the bar's open and close prices.
Thick Bar indicator - allows you to change the thickness of the lines and the color of the stroke, due to which you can get a thicker bar on the chart. The default indicator has a bar thickness of 2 and preset colors that can be changed in the settings
FREE

Volumeku is a Volume-based analysis tool. Its use and purpose is very simple, it is clear that with large volumes of trading some event happens in the market, sometimes a reversal happens, sometimes the beginning of a strong movement. You who are greater, where X is a variable. Let's take the value of 6500 on the H1 chart as an example, put this measurement on your chart and see with your own eyes what happens to the price every time it hits such a level. Download now, it's free and very cool! D
FREE

The Oscar, one of my favorite indicators. This is my enhanced Version of it with more options and better visuals. Many different averaging methods Oscar changes color on signal cross, but not too volatile (3% extra threshold) Adaptable Divisor, higher numbers lead to more signals, due to higher fluctuations. Its a fast but quite accurate trend direction indicator. Play around with the settings and make it match to your setup. GL trading Please follow me on Twitter https://twitter.com/semager and
FREE

The CandleStick Scanner is a tool that allow you to perform a market scan and search any candlestick pattern that you already created in the current chart, You can perform a quick search in the current chart (500 bars will be scanned), This is a lite version of CandleStick Factory for MT5 . The full version video can be found here : https://www.youtube.com/watch?v=fq7pLXqVO94 The full version can be purchased here: https://www.mql5.com/en/market/product/75434
How it works You can
FREE

SSACD - Singular Spectrum Average Convergence/Divergence This is an analogue of the MACD indicator based on the Caterpillar-SSA ( Singular Spectrum Analysis ) method. Limited version of the SSACD Forecast indicator. Limitations include the set of parameters and their range.
Specificity of the method The Caterpillar-SSA is an effective method to handle non-stationary time series with unknown internal structure. The method allows to find the previously unknown periodicities of the series and make
FREE

快量子指标 一个 创新开创 SSC模型 实时跟踪追击趋势 , 基于 创新SSC模型和 实时跟踪追击 支撑位和阻力位的突破。 这是一个创新开创策略在所有类型的市场上交易。 快量子人工智能交易( Fast Quantum AI Expert Trading Robots )事事成( EVERYTHING IS SUCCESSFUL) Fast Quantum Indicators is a innovate initiate SSC model Real time tracking pursuit trend ,based on innovate SSC model and Real time tracking pursuit the breakouts of support and resistance levels. It's a innovate initiate traded on all types of markets. Fast Quantum AI Expert Trading Robots EVERYTHING IS SUCCESSFUL
FREE
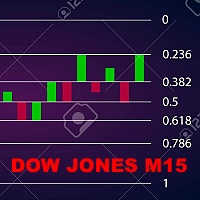
This EA has been developed, tested and traded live on DOW JONES (US30) M15 TF. Everything is ready for immediate use on real account. Very SIMPLE STRATEGY with only FEW PARAMETERS. Strategy is based on FIBO BREAKOUT . It enters if volatility raise after some time of consolidation . It uses STOP pending orders with FIXED STOP LOSS and TAKE PROFIT. To catch more profits there is a TRAILING PROFIT function in the strategy. EA has been backtested on more than 10-year long tick data
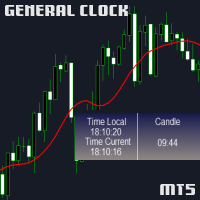
A Simple clock that on the left side "Time" shows r espectively the TimeCurrent, followed beneath by the TimeLocal. On the right hand side we have the remaining minutes and seconds of the current candle. TimeLocal is synced every 500 miliseconds however, the TimeCurrent and the time left on the candle are synced every tick, so this can lead to inconsistencies on the readings so keep that in mind.
This indicator have no plots or buffers so it cannot be used in any time based EA.
FREE

We have all seen a currency pair enter the overbought or oversold territory and stay there for long periods of time. What this indicator does is gives you the emphasis. So if you are looking for reversals then you may want to take notice when oversold territory is entered into with a bullish engulfing candle or if the trend is your thing then check for bearish engulfing candles while entering oversold. This indicator will show a downward arrow when it detects a bearish engulfing candle while cro
FREE

The "Takeandstop" script is a powerful tool designed to streamline your trading workflow by automatically setting Take Profit (TP) and Stop Loss (SL) levels on your MetaTrader 5 chart. This script is particularly useful for traders who want to efficiently manage their risk and reward without the hassle of manually calculating and entering these levels. Key Features: Effortless TP and SL Placement: With a few clicks, the script allows you to set predefined Take Profit and Stop Loss levels for you
FREE

QuantumAlert RSI Navigator is a free indicator available for MT4/MT5 platforms, its work is to provide "alerts" when the market is inside "overbought and oversold" regions in the form of "buy or sell" signals. This indicator comes with many customization options mentioned in the parameter section below, user can customise these parameters as needful. Join our MQL5 group , where we share important news and updates. You are also welcome to join our private channel as well, contact me for the priva
FREE

The ICT Concepts indicator regroups core concepts highlighted by trader and educator "The Inner Circle Trader" (ICT) into an all-in-one toolkit. Features include Market Structure (MSS & BOS), Order Blocks, Imbalances, Buyside/Sellside Liquidity, Displacements, ICT Killzones, and New Week/Day Opening Gaps. It’s one kind of Smart money concepts. USAGE: Please read this document ! DETAILS Market Structure Market structure labels are constructed from price breaking a prior extreme point. T

Price Alert EA for MT5 – Intuitive On-Chart Alert System The CFN Price Alerts EA for MetaTrader 5 is a professional, easy-to-use tool designed to simplify price monitoring and trading decisions. It allows traders to set customizable price level alerts directly from their charts—no more manual setup through MetaTrader's native alert system. With a clean, interactive panel, you can quickly add, manage, and remove alerts. Alerts are visually displayed on the chart and saved between sessions, pr
FREE

********* 60% discount. you can buy this amazing EA at $280 now. (the price before the discount was $700). *********
Ultimate Trader MT5 is a completely automated trading robot that has been designed and created based on our best strategies in forex trading. All trades are protected by stop loss. the EA uses one same stop-loss for all the trades in one circle so the risk is limited with a safe lot size. The EA contains a special DrawDown control function. Users can use a fixed lot or aut

FOREXBOB AUTO CLOSER is a very handsome tool for :- Scalping Correlation Hedging Those who use averaging methods As this utility tool will help you by closing all your running trades when the universal floating P/L reaches a certain value that you will put in inputs. This tool consider all the trades that running on the your account either opened MANUALLY or with help of an EA.
Inputs USD - Put numeric value for required profit Group Mode - False Magic No. - Zero (0) to consider manually opene
FREE

Sends price alerts conveniently to your Android/IOS device. Make sure push notifications are enabled in Metatrader settings and the PC/VPS is online 24/7. Price levels are updated automatically, but you can modify them in global variables, if needed. Suitable for any market instrument, but if notifications are too frequent, increase point value of the indicator parameter.
FREE

Introducing the MetaTrader 5 Expert Advisor with Bull Signal Filter, Customizable Candle Size, Advanced Equity Management, and 1% Entry Price Calculation!
Are you searching for a comprehensive trading solution that combines powerful features and precise entry price calculation? Look no further! Our MetaTrader 5 Export Advisor is designed to provide you with advanced functionalities, enabling you to refine your trading strategy and effectively manage your equity.
The Bull Signal Filter remains
FREE

Este indicador imprime 2 médias com distância de 1 ATR (Average True Range) da média principal. As demais médias móveis só são mostradas se estiverem fora desse intervalo. Parâmetros: mediaprincipal = Média que será criado o intervalo, não será mostrada. mediasec1, mediasec2, mediasec3 = médias secundárias. periodatr: periodos do ATR Este indicador faz parte do Trade System MarketStrengthRadar
FREE

Se você está procurando uma maneira de melhorar seus resultados de negociação, então o indicador VWAPiEagleVision é o que você precisa! Este robô é programado para rastrear o VWAP em tempo real e usar essas informações para identificar tendências e oportunidades de negociação lucrativas.
O VWAP (Volume Weighted Average Price) é um indicador amplamente utilizado pelos traders para determinar o preço médio ponderado pelo volume negociado. Ele é comumente usado por traders institucionais e pode
FREE

ATR is an excellent indicator to visualize if volatility is increasing or decreasing. But what if you want to compare the volatility to another pair or instrument? Since each pair with different quote currency has different pip value, the output of the ATR doesn't really say that much. Comparing pairs to other instruments is even harder. What you as a trader care about is how much the pair has moved up or down in percentage, therefore normalizing ATR to percent would make things much easier. T
FREE

Este poderoso indicador analisa o gráfico e mostra zonas de Rejeição de Preços! Isto é, locais onde o preço foi, mas não foi aceito pelo mercado! A visualização desta zona de Rejeição, facilita o entendimento do trader na tomada de decisões de onde operar e como operar!
O indicador é composto por 4 linhas, sendo classificadas em 2 grupos: Linhas Vermelha e Amarela: Denotam os extremos onde o preço conseguiu chegar, mas não foi aceito! Linhas Laranja e Azul: A partir delas, denotam o Início da z
FREE

The "Moving Average Range Painter" is a robust MetaTrader 5 (MT5) indicator meticulously crafted to illustrate the fluctuating range between an exponential moving average (EMA) and a simple moving average (SMA) on any financial chart. This tool offers traders a comprehensive visual depiction of the price range within which an asset is oscillating. Here's a succinct interpretation of what this range signifies for technical analysis: Trend Dynamics : The range delineated by the EMA and SMA unveils
FREE
This is a utility for storing the data on open interest (OI), ratio of buyer/seller orders' number and the ratio of buyer/seller orders' volumes on the Russian FORTS futures market. This is the first product of the series. Now, you can trace history of the specified data in real time in МТ5 terminal. This allows you to develop brand new trading strategies or considerably improve the existing ones. The data received from FORTS market is stored as a database (text CSV or binary one at user's discr
FREE
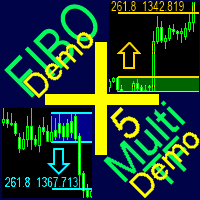
A ready-made multitimeframe trading system based on automatic plotting and tracking of Fibonacci levels for buying and selling any symbol. Demo version - calculation of the last 390 bars is not performed.
Advantages Determines the trend direction based on a complex of 14 indicators ( Cx ), extremums of ZigZag ( Z ), RSI ( R ), Impulse ( I ) Displaying the values of 14 indicators comprising the trend direction ( Cx ) Plotting horizontal levels, support and resistance lines, channels View the plo
FREE

超值交易顾问 - PA超级机器人 PA 超级机器人 是一款基于价格行为的交易顾问。 它能够交易任何外汇货币对和金属品种。我们推荐使用主流货币对:美元、英镑、日元、欧元、澳元、加元和黄金。 用户可以同时运行多个交易品种。 它不使用网格、马丁格尔或对冲策略。 账户类型:净额结算或对冲。始终使用净额结算规则。 用户水平要求:从新手到专家交易者均适用。PA 超级机器人建议用户熟悉 MetaTrader 5 的优化工具,因为我们建议在实盘交易之前进行参数优化。 所有其他时间框架也可使用。 所有交易均自动设置止损订单。绝不会让您在单笔交易中亏损超出预设风险。 用户可以选择每周的哪些天进行交易。 用户可以选择交易时间窗口 - 开始/结束时间。 多种获利计算方法。 多种开仓止损和移动止损计算方法。 多种应对大幅价格波动(正向或负向)的方法。 风险管理 多种计算风险资金和手数的方法。 支持专户交易商:每根跳动都会检查每日最大亏损限额和账户最大亏损限额。 如果每日亏损限额接近,它将关闭仓位并暂停交易至次日。 如果账户最大亏损限额接近,它将关闭仓位并停止交易。 如果达到专户交易商的目标,它将停止交易(可选

DoubleMACD DoubleMACD DoubleMACD DoubleMACD DoubleMACD DoubleMACD DoubleMACD DoubleMACD DoubleMACD DoubleMACD DoubleMACD DoubleMACD DoubleMACD DoubleMACD DoubleMACD DoubleMACD DoubleMACD DoubleMACD DoubleMACD DoubleMACD DoubleMACD DoubleMACD DoubleMACD DoubleMACD DoubleMACD DoubleMACD DoubleMACD DoubleMACD DoubleMACD DoubleMACD
FREE

Would appreciate a review of the product if possible.
This program, is designed to automatically log and monitor trading account performance metrics in MetaTrader 5. It tracks daily balance and equity, calculates performance metrics, and records them in a CSV file for later analysis. Key Features: 1. Initialization: • Inputs for account name ( Account_Name ), starting day balance ( Start_Day_Balance ), and equity ( Start_Day_Equity ) are accepted. • If the starting balance or equity is not prov
FREE

This Renko is: Live : constantly updated on the market prices Dynamic : updating on each new ATR value Backtestable : Generating the chart during backtest, allowing Real Ticks Accuracy and Time Period Accuracy Guppy Built-in : GMMA with 12 EMA built-in This is what you are looking for! RENKO A Renko chart is a type of chart, developed by the Japanese, that is built using price movement rather than both price and standardized time intervals like most charts are. It is thought to be named a
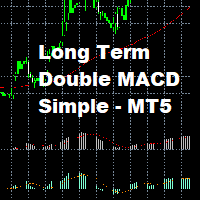
Long Term Double MACD Strategy with EMA Trend Confirmation
This strategy uses a leading and lagging MACD indicator. The leading indicator gives the entry signals, and the lagging indicator gives the exit signals. This Expert does not use any account management and as such you should make sure to set good stop losses.
Works best on longer timeframes on low volatility pairs.
FREE

Close Manager EA for MetaTrader 5 Introduction: Welcome to the Close Manager EA, an essential tool designed exclusively for MetaTrader 5. This expert advisor has been meticulously crafted to streamline and enhance the trade closure process. Whether trades are initiated manually or by other EAs, this tool offers a diverse range of customizable criteria, empowering traders with enhanced control over their trade exits. You can find the MT4 version here Key Features: Logs Capture (SHOW_LOGS): Enable
FREE

ORB Breaker EA (Opening Range Breakout) ORB Breaker is a robust and secure Expert Advisor (EA) for MetaTrader 5, built upon the time-tested and highly successful Opening Range Breakout (ORB) strategy. This EA efficiently calculates the opening range based on your selected trading session and identifies precise breakout points, offering traders a conservative and reliable trading approach. Important Note: The EA includes optimized set files tailored specifically for each trading instrument, whic

Introducing the Ultimate Trade Panel MT5 - Your All-in-One Trade Manager for MQL5 Trading Are you a trader looking to streamline your trading activities and gain a competitive edge in the market? Look no further! The Ultimate Trade Panel MT5 is here to revolutionize your trading experience on the MQL5 platform. With a plethora of unique and time-saving features, this expert advisor is designed to be your reliable companion for day-to-day trading activities. Key Features: Indicator Manager: Say g

The Chandelier Exit, introduced by Charles LeBeau, is described in "Come into My Trading Room" book.
It calculates each stop on a long position in an uptrend from the highest point reached during that rally, and gets its name from the chandelier, which hangs from the highest point in the room. The Chandelier Exit uses a multiple of the Average True Range (ATR), subtracting it from the highest high since the trade was entered. It creates a new trade whenever the previous trade is stopped out. Cha
MetaTrader市场提供了一个方便,安全的购买MetaTrader平台应用程序的场所。直接从您的程序端免费下载EA交易和指标的试用版在测试策略中进行测试。
在不同模式下测试应用程序来监视性能和为您想要使用MQL5.community支付系统的产品进行付款。
您错过了交易机会:
- 免费交易应用程序
- 8,000+信号可供复制
- 探索金融市场的经济新闻
注册
登录