适用于MetaTrader 5的EA交易和指标 - 51

Simple ATR Modern 一个简化的工具,用于更清晰地跟踪市场波动性,适合日内交易和波段交易。 它是开始交易或初学者的最佳指标。
视觉指标颜色:ATR Daily - 蓝色 通过结合 Volatility Vision 指标增强分析。 精确测量市场状况的波动,对日内交易和波段交易决策至关重要。 利用基础的 14 天(可配置)简单移动平均真实范围指标确保准确性。 适用于在交易系统中实施开仓或退出策略。 为什么 ATR 指标优于其他指标: 使用简单:ATR 指标易于设置和理解,即使是新手交易者也能轻松上手。 多功能性:适用于日内交易和波段交易,在各种交易策略中提供灵活性。 可靠性:ATR 提供准确的市场波动数据,帮助交易者做出更明智的决策。 可定制性:能够调整移动平均周期,使交易者能够根据自己的特定需求和偏好调整指标。 可组合性:ATR 易于与其他指标结合,如 Volatility Vision ,进行更深入的市场状况分析。

使用 The Strat 进行交易时,关注多个时间范围很重要。 该指标将显示每个时间范围内当前蜡烛的每日、每周、每月和每季度状态。 圆圈图标表示该时间范围内的蜡烛目前是内部蜡烛,或 TheStrat 术语中的类型 1。 Inside Day 蜡烛正在巩固价格走势,我们正在寻找该范围的突破。 指向上或下的三角形图标是趋势蜡烛,或 TheStrat 术语中的类型 2。趋势蜡烛可以是看涨或看跌,表明它已经突破了之前的蜡烛范围,现在正朝着一个方向发展。 方形图标是外部蜡烛,或 Strat 术语中的类型 3。这表明两件事,一是价格在该时间范围内的方向未定,可能相当波动,二是在较短的时间范围内,可能有很好的交易空头反转机会。该正方形将是看涨或看跌的颜色,以显示当前获胜的一方。 每个图标使用的颜色都可以根据您的喜好进行配置,文本和图标的大小也是可配置的。 设置
时间范围选择 每小时显示 当为 True 时,显示每小时蜡烛状态。 每日秀 当为 True 时,显示每日蜡烛状态。
每周秀 当为 True 时,显示每周蜡烛状态。 每月显示 当为 True 时,显示每月蜡烛状态。 季刊 当为 True 时

工作逻辑 该指标的重要性在于它可以让您了解“仪器上还剩下多少燃料”。想象一下这样的情况,你留在一辆半放电的汽车里,平均来说,这个能量通常足够一辆汽车行驶250公里,所以如果你愿意,你无法克服700公里的距离。因此,对于每种工具,每天都有一定的价格变动,并且作为统计观察的结果,显示资产每天通过 1 ATR 的情况有 95%,而每天通过 2 个或更多 ATR 的情况只有 5%。
例如,每日 ATR EURUSD = 682 点。您进入交易,例如突破 500 点 TP 的水平,似乎您设置了正确的 TP 大小,但您没有考虑到资产已经超过了其每日 ATR 的 90%交易开始的时间,因此,该工具很可能没有足够的能量来接收你的 TP,如果你看到该工具只剩下 10% 的电量,你很可能要么调整 TP,要么根本不参与交易。
动力储备指示器计算仪器用完惯性的百分比和点数以及剩余多少。
指示器本身以电池充电指示器的形式制成,我们习惯于在电子设备中看到它。 Recommended Robot Scalper - https://www.mql5.com/en/market/product/77

Média Móvel que possui todos tipos de Cálculo comum: Simples Exponencial Suavizada Ponderada Conta com suporte para aplicação sob outros indicadores!
Seu principal diferencial é o esquema de cores em GRADIENTE que, de acordo com a mudança no ângulo da média, altera suas cores conforme demonstrado nas imagens abaixo. Com isso, espera-se que o usuário tenha uma percepção mais suavizada das pequenas alterações.
Bons trades!!
FREE

该指标检测平仓,并在发现的区域画上一个彩色的矩形。
该指标的主要思想是,当价格填满图表上的某个区域时,检测出一个平盘。
输入参数:
Color rectangle - 要着色的矩形的颜色。
Bars in rectangle - 矩形中允许的最小条数。
Density in % - 扁平的密度,设置为矩形区域的百分比。 __________________________________________________________________ __________________________________________________________________ ________________________
Mt4 Version : https://www.mql5.com/en/market/product/107249
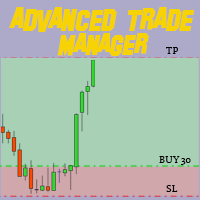
使用我们的 MT4 和 MT5 高级交易管理器彻底改变您的交易 通过我们的 MT4 和 MT5 高级交易管理器这一终极工具来增强您的交易策略,实现精确度和控制。 与传统的交易管理器不同,我们的交易管理器不仅可以动态适应市场条件,而且可以在您进入交易时设置自动止损和止盈水平。
主要特征:
自动入场策略:通过我们的交易经理的自动入场策略立即抓住机会。 当您进行交易时,系统会策略性地设置预定义的止损和止盈,从一开始就确保严格的风险管理。
动态止损管理:实时响应市场变化。 当您的交易利润达到 +0.50% 时,系统会自动将您的止损减半,保护您的收益,同时控制风险。
收支平衡保护:+1% 的利润让您高枕无忧。 我们的高级交易经理将您的止损调整至盈亏平衡,确保您的初始资本并让您的利润持续运行。
优化利润锁定:毫不费力地最大化回报。 当利润为 +2% 时,交易经理会将您的止损调整为 +1%,以确保确保利润和允许市场波动之间的健康平衡。
高效的入场和

Trading ICT's OTE Concept is simplified with the ICT Optimal Trade Entry Tool. This semi-automatic EA/utility allows trading with manually defined Fibonacci retracement levels. Simply anchor the Fibonacci between swing highs and lows, select your desired entry level in the graphical panel, and the tool automatically opens positions based on your predefined direction. No more waiting in front of charts for price action to reach your entry levels; set the Fibonacci, enable your chosen entry level,

1. 此 EA 是自动止盈、止损、追踪止损和利润锁定,带有退出策略(反向/对冲)鞅。
2. 适用于电脑图表或移动交易的手动交易(当在 VPS 上时)
3. 变量输入以点子为单位
4. 第一个仓位将由您自己手动开仓(买入/卖出)。此后将设置 TP、SL、TS 和利润锁定。
5. 如果您的第一次手动交易(失败)并且与您的趋势相反,则有 2 种退出策略。
(a) 当您的第一次手动交易(买入)达到 SL 时,反向鞅(卖出)被激活。
(b) 当您的第一次手动交易(买入)达到 SL 时,对冲马丁格尔(买入)被激活。
*反之亦然,当第一次手动交易(卖出)达到 SL 时。
6. 当您的第 1 次手动交易符合您的趋势但突然逆转时,会激活追踪止损和追踪步骤。
7. 利润锁定是锁定当前同对多笔订单中一定数量的利润(百分比)。如果您打开 4 个订单,它会在达到利润锁定时关闭任何 2 个订单(当百分比设置为 50% 时)。
8. 启用警报
9. 为任何交易启用推送通知到您的手机。

该多时间框架和多交易品种指标可识别随机指标信号线何时穿过随机指标主线。作为替代方案,它还可以在随机指标离开(没有信号线穿过主线)超买/超卖区域时发出警报。作为奖励,它还可以扫描布林带和 RSI 超买/超卖交叉。结合您自己的规则和技术,该指标将允许您创建(或增强)您自己的强大系统。 特征 可以同时监控市场报价窗口中可见的所有交易品种。仅将指标应用于一张图表即可立即监控整个市场。 可以监控从 M1 到 MN 的每个时间范围,并在识别出交叉时向您发送实时警报。支持所有 Metatrader 本机警报类型。 该指示器包括一个交互式面板。请参阅单独的屏幕截图以获取解释。 指标可以将信号写入文本文件 或全局变量 专家顾问 (EA) 可以使用它 进行自动交易。比如 这个产品 。 输入参数
输入参数的描述和解释可以 在这里 找到 。 重要的
请注意,由于多功能性,安装指标的图表上不会绘制买入和卖出建议,也不会绘制线条和箭头。相反,这些对象将绘制在单击图表面板中的信号时打开的图表上。 强烈建议将指标放在干净(空)的图表上,上面不要有任何其他可能干扰扫描仪的指标或 EA 交易。

该工具在您的头寸上设置止损
通过 Metatrade 策略测试器快速测试。 如果多头头寸,您的止损将在最后一个底部 或者在空头头寸的情况下,您的止损将在最后一个顶部
此外,该工具还管理您未平仓头寸的尾随。 始终将止损设置在最后形成的高点或最后形成的底部
要创建顶部和底部,我使用免费指标“支撑线和阻力线”,可通过此链接下载: 下载 metatrade 5 的免费顶部和底部指标
该工具移动资产上所有未平仓头寸的止损位置 gāi gōngjù zài nín de tóucùn shàng shèzhì zhǐ sǔn
tōngguò Metatrade cèlüè cèshì qì kuàisù cèshì. rúguǒ duōtóu tóucùn, nín de zhǐ sǔn jiàng zài zuìhòu yīgè dǐbù huòzhě zài kōngtóu tóucùn de qíngkuàng xià, nín de zhǐ sǔn jiàng zài zuìhòu yīgè dǐngbù
cǐwài, gāi gōngjù hái guǎnlǐ n

AITradeMaster is an advanced Expert Advisor (EA) system developed on the MQL5 platform, utilizing the latest advancements in neural networks and deep learning. Designed for maximum automation and ease of use, AITradeMaster requires no additional settings from the user, allowing even novice traders to benefit from its functionality.
Key Features: Automatic Settings : All trading parameters are automatically generated by the implemented neural network. The user does not need to worry about con

货币强度计,为您提供当前哪些货币强,哪些货币弱的快速视觉指南。 该仪表测量所有外汇交叉货币对的强度,并对它们进行计算以确定每种货币的整体强度。 我们根据 28 对的趋势计算货币的强度。
.货币强度计是指标的通用名称,用于显示您是在处理强货币还是弱货币。这种基于算法的指标依赖于各种货币对的汇率来提供每种货币的强弱程度。
通过访问我们的 MQL5 博客,您可以下载该指标的免费版本。 购买前试用,不受 Metatrader Tester 限制: 单击此处
1. 文档 所有趋势货币强度文档(说明)和策略详细信息均可在我们 MQL5 博客的这篇文章中找到: 单击此处。
2. 联系方式 如果您有任何问题或需要帮助,请通过私信联系我。
3. 作者 SAYADI ACHREF,金融科技软件工程师,Finansya 创始人。

創造、探索、賺錢! EA 交易允許您基於強大且通用的指標構建全自動交易系統,以平滑工具的價格。使用集成到 EA 中的一組規則創建您自己的交易系統。在策略測試器中測試您的想法。將其用於實際交易以獲取利潤或作為附加工具。 2021 年 10 月 19 日,我們為 MetaTrader 5 發布了一個完全免費的 UniversalMA 指標。UniversalMA 是具有大量自定義選項的移動平均線。 10 種類型的平滑。 12 種價格可供選擇。由此產生的移動平均線離散化的可能性。快速和優化的代碼。事實證明,該指標非常方便,用戶喜歡它。 該指標允許您基於它創建任何 EA 交易,沒有任何限制。儘管如此,我們還是收到了大量關於創建基於該指標的全自動 EA 交易的請求和建議。問題在於用戶使用該指標的方式多種多樣。 因此,決定為 MetaTrader 5 創建一個基於 UniversalMA 指標的交易策略構建器,而不是傳統的交易機器人。使用此工具,您可以非常輕鬆地編寫自己的交易策略。 UniversalMA EA 適用於任何時間框架和工具(符號)。合適的賬戶類型是 NETTING 和 HEDGING

Ez 通道 指标是趋势跟踪交易者的重要工具,因为它会自动识别图表中的真实趋势通道。使用此指标,您不再需要花费数小时在图表上手动绘制趋势线。它可以为任何交易品种和时间框架快速绘制趋势通道,从而节省您的时间和精力。 Ez Channel 的主要功能之一是其迷你控制面板,可让您根据自己的喜好轻松调整时间段。此控制面板还使您能够在新的市场变动发生变化之前保存已识别的渠道。此功能确保您可以轻松跟踪和分析市场趋势,而无需重新绘制趋势线。 Ez Channel适用于所有交易品种和时间范围,使其用途广泛,适用于各种交易策略。它为您提供了保存已识别频道以供将来使用的便利,并且您可以在任何时间范围内查看这些已保存的频道。此功能允许您比较和分析不同时间范围内的趋势,从而增强您的交易决策过程。 无论您是经验丰富的交易员还是新手,Ez Channel 都提供用户友好的界面和易于调整的参数。它旨在简化趋势跟踪策略,让您轻松跟踪趋势并做出明智的交易决策。该指标在识别趋势通道方面的准确性和可靠性有助于其作为交易工具的有效性。 凭借其强大的功能和用户友好的设计,Ez Channel 是任何想要最大化其趋势跟踪策略的交易

RSI 交叉警报 是一个功能强大的通知系统,专为在其交易策略中使用 相对强度指数 (RSI) 的交易者而设计。该指标侧重于识别 RSI 交叉,当快速 RSI 线穿过慢速 RSI 线上方或下方时发生。通过结合这些交叉点,该指标可以有效地过滤掉错误信号,让交易者做出更准确的交易决策。 RSI 交叉警报提供了几个增强其功能和可用性的关键功能。它适用于任何时间框架和交易品种,为交易者提供灵活的交易方式。该指标还拥有用户友好的参数,允许交易者根据自己的喜好和交易策略轻松定制其设置。此外,该指标可以在图表上绘制之前的信号,使交易者能够分析历史交叉模式。 为确保交易者不错过重要的交易机会,RSI Crossover Alert 包含一个快速通知系统。该系统提供及时的弹出消息提醒,让交易者了解潜在的 RSI 交叉和信号机会。通过及时收到这些警报,交易者可以立即采取行动并利用有利的市场条件。 该指标的参数设置包括调整快速RSI周期、慢速RSI周期、RSI应用价格、起始蜡烛指数、历史计算周期、箭头距离、买入箭头字符、卖出箭头字符、买入颜色、卖出颜色和警报重置周期的选项.交易者可以微调这些参数以符合他们个

Технический индикатор "Reversal patterns" является математической интерпретацией классических разворотных паттернов: Pin Bar, Harami и Engulfing. То есть «Разворотного бара», «Харами» и «Поглощения». Данный индикатор позволяет определить момент разворота котировок на основе рыночной динамики и победителя между «быками» и «медведями». Индикатор отображает момент разворота на локальных максимумах и минимумах графика любого таймфрейма, что позволяет повысить точность сигнала. Также индикатор имеет

5/10份,30美元--->下一个50美元// MT4版本
Forex Vigor 是一个技术指标,评估8种主要货币(欧元、英镑、澳元、新西兰元、美元、加元、瑞士法郎、日元)的动能强度。该指标依靠数学计算来衡量28种货币对之间缺乏相关性的情况。为了计算它们的价值,它使用线性加权平均法(LWMA)加上一个统计系统来分析收盘价之间的百分比差异,该系统消除了模型中不代表意义的价值。这种方法提供了一个加权平均值,使最近的价格变动具有更多的意义。通过考虑这个百分比的差异,该指标提供了一个衡量货币动量的强度和方向。
由于它能够评估主要货币的动能强度,并对市场动态提供有价值的见解,该指标可以帮助交易者识别潜在的交易机会,做出更明智的交易决定,并有效地管理风险。
特点 无重绘 新数据到来时,该指标不改变其数值 交易对 28个交易对 时间框架 所有 (M1, M5, M15, M30, H1, H4, D1, W1, MN) 交易时间 每天24小时
配置
ma_period:这个参数影响算法的计算,按照你的意愿使用它。默认情况下,你不需要改变它。 ma_delta:这个参数会影

!!!ATTENTION TRADERS!!! Bug hunters will get an EA of their choice FOR ABSOLUTELY FREE!!! If you purchase any of my EAs and happen to find a bug, report it to me and I'll gift you one of my EAs here on MQL5 for ZERO dollars, no strings attached! Download the entire trade journal in csv format here → drive.google.com/file/d/12rs2Ymff1Wt2YDgJf1HyLSxQJV1XwfXa/view I recommend you to open it with LibreOffice Calc if Microsoft Excel gives you an error. Description: Regenerat0r is a novel trading rob

自动化供需交易。做一个市场。
这个 EA 的制作和灵感来自于每个人都在销售和模仿的流行供需指标。 EA 继续交易和对冲,做市。也可以在非对冲账户上交易。需要评估风险并使用时间框架、手数、对冲能力。我已经在一个月左右的时间里一次断断续续地交易了多对。
系统概念:
EA 交易供需水平。水平发生变化,因此 EA 将继续交易新水平。在手数较低的多对之间进行分配是该系统的一项功能。在保持稳定收益的同时,应避免大幅回撤。 SL 可以使用,但我解释的对冲方面允许这是一种选择。我在多对小手上得到的回撤是 4%,这是没有止损的。较大的地块显示为 6%。因此,较小的尺寸是保守的,而较大的则更具侵略性。这些是保持交易手数低于余额的原因。行业需要发展空间。
特征:
贸易计数 固定手数 音量上限 止损 获利

CATAPULT This is a one-of-a-kind expert based on trend. It is based on the successful grid expert, with the help of a multilayer perceptron, the entry point has been refined. Several auxiliary proprietary indicators have been added. The Expert Advisor opens trades variably. How to use the EA
The EA has been optimized for the best performance. Just attach the EA to EUR/USD chart and let it operate by itself. All the required settings have been considered after careful back testing and live t
FREE

ACCOUNT FLIPPER EA A trading bot for GBPUSD Lot size is calculated by multiplying the lot factor by each 1000 USD on account. Advisable to use account sizes of USD 1000 and above. Account types: Hedge accounts, Standard accounts are preferred i.e. no commissions, Use well regulated brokers eg ICMarkets. all this provides room for the strategy to work smoothly for stabilized results and removing the possibility of the model crashing. ADJUST The Time settings to your own time zone because the
FREE

VR Calculate Martingale 指标是一款强大的订单和头寸计算器,用于计算盈利或亏损。 在订单和头寸计算器的帮助下,交易者可以计算任何外汇货币、股票或加密货币的平均价格。 您已经可以连接指标并启动在真实订单和头寸上叠加虚拟订单的功能。 通过创建其他虚拟头寸,您将能够计算任何事件的发展。 该指标包括手数计算器、持仓平均计算器、止盈和止损水平计算器。 在特殊功能的帮助下,您可以模拟当前价格在任何方向的变动,并计算一个或多个仓位的利润或亏损。 你有很多买入和卖出头寸吗?VR Calate Martingale-将计算平均价格,您可以在零或小额利润中平仓所有仓位。 您将能够按平均价格对订单进行分组,并找到最有利可图的解决方案来平仓一个或多个仓位。 技术支持,设置,演示版本的程序可以要求在作者的配置 文件。. 使用指示器是简单直观的,大多数操作都是用鼠标执行的。 该指标安装简单,适用于初学者和专业交易者。 VR Calculate Martingale 使用虚拟订单工作,这允许您自动进行所有计算,而无风险。 指示器的特点: 使用订单链法计算交易。 同时按照买卖的方向建立权证链条。
Equity monitor
This is a simple means change informer. I wrote it for myself, maybe someone will need it...
1. Displays the change in funds for the day. Every day, when the terminal is first launched, it remembers the current funds and monitors changes throughout the day.
2. The first day of the month, well remembers the money and, within months, to monitor changes.
3. Well, it displays the profit of the open position.
To work, you need to create 4 global variables: gvarEqityDay ,
FREE

Este indicador imprime 2 médias com distância de 1 ATR (Average True Range) da média principal. As demais médias móveis só são mostradas se estiverem fora desse intervalo. Parâmetros: mediaprincipal = Média que será criado o intervalo, não será mostrada. mediasec1, mediasec2, mediasec3 = médias secundárias. periodatr: periodos do ATR Este indicador faz parte do Trade System MarketStrengthRadar
FREE

This is an OLD indicator which was rather efficient to be paired with MA Cross, Bollinger Bands, Dochian Channel and many other strategies and this provides you with market change of BEAR and BULL trends. Since there isn't much listed in MT5 Market, I would like to share my very own indicator for your usage. Please feel free to comment or criticize for better and improvement of the indicator listed.
FREE

RSI Currencies is an indicator that is based on the RSI concept but with a totally different approach. It calculates its values calculating all RSI values of all pairs related to the same currency and making an average between them: the goal is to obtain a more solid and trustable information about what each currency are doing lowering the impact of market noise and extreme euphory on a particular pair to analyze the whole basket. It works on 28 forex majors and minor pairs related to these curr
FREE

The Point-Percent Price Channel (PPPC or PP Price Channel) indicator is designed to display on the chart a channel whose width is specified both as a percentage of the current price and in points. Its appearance is presented on slide 1. When the market moves up, the upper border of the channel is built at the price of High candles. In this case, the lower boundary follows the upper one at a strictly specified distance. When the price touches the lower border of the channe
FREE

The EA does not use grid, martingale, and arbitrage. The trading system is suitable for both experienced traders and beginners. The EA includes protection against high spread. Works well with the default settings. Provides a SAFE approach towards risk management with enabled Trailing stop. Expert Advisor will only use 1% of your free margin as risk and hence results in low trade volume but LOWER Drawdown as well
Important Information Revealed By purchasing this Expert Advisor you are entit

无忧外汇方法的完整交易面板。这个面板囊括了你执行自己的NNFX算法所需的几乎所有东西,帮助你更快、更容易地进行交易。它有3个部分。 符号面板
按下图表中的任何符号名称,即可快速切换到该符号。 额外的信息可以显示在面板上:当前打开的交易,这些交易与其他符号的相关性(除了他们的止损是在收支平衡或正数)和即将到来的消息(下一个每日蜡烛,当在蜡烛收盘时交易)。 这些新闻是从Forex Factory导入的,默认的过滤新闻是VP在No Nonsense Forex中推荐的。如果你想改变新闻,考虑到任何包含你完整的自定义新闻(区分大小写)的新闻将被显示。 时区是EET/EEST(与Metatrader相同),显示的新闻在12:00(下午)改变。那么,在中午之前,新闻对应的是同一根蜡烛,而在中午之后,它们对应的是第二天的新闻。 NNFX交易小组 交易面板执行NNFX系统中的典型操作:买入/卖出按钮打开2个相同手数的订单,以最佳方式调整到您想要的风险(账户的百分比),止损为1. 5*ATR,其中一个订单的获利为1*ATR;收支平衡按钮将订单的止损设置为开盘价(如果可能),追踪止损按钮按照VP的规则

The Netsrac Correlation Trade Indicator (NCTI) was created to trade correlations between different assets. NCTI offers five different strategies to do this. Five different correlation trading strategies with two or three assets Fast access your assets with one click via asset buttons Your profit/loss at a glance Configurable alerts via screen or mobile You can use the indicator with every timeframe. Higher timeframes give fewer but better signals. If you have some questions or suggestions - plea
FREE

Advanced Indicator Scanner is a multi-symbol multi-timeframe scanner that works with hundreds of custom indicators available across the web including mql5 website market and codebase indicators.
Advanced Indicator Scanner features:
Scans your indicator in 28 customizable instruments and 9 timeframes. Monitors up to 2 lines(buffers) of an indicator. Showing of indicator value on buttons. You can choose between 3 alert modes: Single symbol and timeframe Multiple timeframes of a symbol Multipl

Bonus when buying an indicator or an advisor from my list. Write to me in private messages to receive a bonus. Manual Assistant MT5 is a professional manual trading tool that will make your trading fast and comfortable. It is equipped with all the necessary functions that will allow you to open, maintain and close orders and positions with one click. It has a simple and intuitive interface and is suitable for both professionals and beginners.
The panel allows you to place buy and sell orders
FREE

Get all benefits of a grid strategy and none of its disadvantage | Built by a grid trader >> for grid traders.
This is MT5 version, click here for Blue Sonic Donchian MT4 (settings and logics are same in both versions) Real monitoring signal --> Sonic Gold | Sonic Fx Intro BlueSonic Donchian EA ('Sonic') is a next-gen multi-currency multi-timeframe EA base on Donchian indicator. Other than normal one-off entry, users would have option to activate grid series to maximize return f

A flexible BB indicator You're no longer limited to the built in default of using BB off a SMA method, now you can choose from: SMA - SMMA - EMA - LWMA - ADAPTIVE - FRACTAL ADAPTIVE - DEMA - TEMA - VARIABLE INDEX DYNAMIC
You now also have 2 standard deviation levels. A more featured version is available with 5 deviation levels, color gradients to lines and filling as well as candles, with full alerts too: Bollinger Bands Max MT5
Options: - MTF - 9 choices of MA to base the BB off
- 2 adjust
FREE

Ultimate Reversal Scanner (Multi Pair And Multi Time Frame) : ---LIMITED TIME OFFER: NEXT 25 CLIENTS ONLY ---46% OFF REGULAR PRICE AND 2 FREE BONUSES ---SEE BELOW FOR FULL DETAILS Reversal patterns are some of the most widely used setups in the institutional trading world.
And the most (statistically) accurate pattern of them all is called the ' Three Line Strike '. According to Thomas Bulkowski ( best selling author and a leading expert on candlestick patterns ),
the ' Three Line Strike '
Unlock Your Trading Potential with Our Risk Management Tool! Revolutionize your trading experience with our game-changing solution. Designed for traders who prioritize precision and control, our Risk Management Tool lets you effortlessly calculate the perfect lot size or volume, ensuring confident trades even in volatile markets. Seamless Trade Execution : Input your stop loss and risk level, and let our tool handle the rest. No more manual calculations – just efficient trading. Optimal Risk-Rew
FREE

Spire - показывает трендовый, сигнальный, свечной прорыв в сторону верхней или нижней границы канала, а так же временную или долгую консолидацию в виде прямоугольного канала. Сигналы тренда не перерисовываются. В основу идеи индикатора входит Bollinger Bands.
Изменяемые параметры Signal trend -изменение цветовой гаммы сигнального символа тренда Lower limit - изменение цветовой гаммы нижней границы канала Upper limit - изменение цветовой гаммы верхней границы канала Internal field -изменение
FREE

This version is 30 usd
British Fakeout EA is a trading strategy for GBPUSD. Strategy aims to catch fake movements and make a profit from them. For this purpose, it opens lots, these lots can be made with Fixed, Martigale or Equity Based Lot calculation. You can adjust the distance between lots with the GRID DISTANCE option. Live Signal
-Recommended Time Frame: 4H -Currency: GBPUSD -Recommended fixed lots for 1000 USD is 0.02 -Recommended equity lots for 50x leverage = 200 -Recommended equit
FREE

The FREE version works on Demo account and only CADCHF and NZDCHF pairs.
The indicator predict the future candles direction, by scanning past candle movement. Based on the principal: “ The history repeat itself”. Programmed according to Kendall Correlation. In the settings menu, different scanning options are available. When the indicator find a match, start painting future candles from the current candle to the right, also from the current candle to the left as well, showing you the candle
FREE

IAMFX offers the ultimate solution to make trading easier and more flexible on IAMFX Web using IAMFX Agent .
With our exclusive IAMFX-Agent and IAMFX-Center, you can effortlessly manage your trading anytime, anywhere through web and mobile interfaces. Fully compatible with both web and mobile environments, IAMFX allows real-time multi-account management and monitoring with a simple installation. IAMFX Benefits Manage multiple MT5 accounts Easy orders with market, stop and limited Manage ord
FREE

Smart Range Breakout EA is a fully automated time range breakout strategy, which uses calculated trailing stop-loss to trade high volume moves on the market. The strategy comes with not overly optimized default settings, however it can be experimented with. This expert advisor does not use any martingale, grid or similar techniques, therefore there are no spikes in the relative equity drawdown. LIVE PERFORMANCE : https://www.mql5.com/en/signals/1823580 The strategy works best on USDJPY and EURU

The indicator highlights in color the places on the chart where the price moves in one direction continuously from the selected number of candles.
You can specify the number of points from the beginning of the movement to select only movements from this amount.
It can be useful for looking for reversals or sharp impulses.
I also recommend purchasing this utility to determine local weekly / monthly trends and support and resistance lines. https://www.mql5.com/en/market/product/61401
FREE
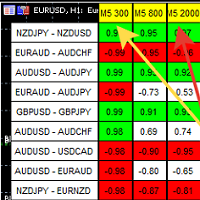
A script showing the correlation for three selected zones at once (TF-bar) In the parameters, select 3 options The data is displayed sorted by the first zone The script also creates a file in which it writes all the data without sorting. In this way, you can expand the number of zones to any number and perform the analysis in exsel
Parameters:
TF_Trade1 =PERIOD_M5; BarsCor1 = 300; TF_Trade2 =PERIOD_M5; BarsCor2 = 800; TF_Trade3 =PERIOD_M5; BarsCor3 = 2000; K = 0.8; WindSize
FREE

EA to help traders stay within tight risk management.
Asks only for account's initial balance and Stop Out DD. This is meant for prop firm traders, but will help any trader who is looking for a simple risk manager.
Trasks and reports daily PnL and will advise you to stop at 1% daily loss. Will advise you to wait if you have too many open trades.
Based on the open chart (symbol and timeframe) will recommend size and SL distance in order to risk the desired cash risk. See screenshot for exam
FREE

The Moving Average Slope (MAS) subtracts the moving average level n-periods ago from the current moving average level. This way, the trend of the moving average can be drawn on the moving average line.
Features Observe uptrends and downtrends at a glance. The indicator is non-repainting. Returns buffer values for the trend of the moving average to be used as part of an EA. (see below)
Inputs Moving Average Period : The period of the moving average (MA). Slope Period : Number of periods betwe
FREE

Title : Surefire Hedging Expert Advisor for MT5 Description : Introducing the Surefire Hedging Expert Advisor (EA) for MetaTrader 5, a sophisticated algorithm designed to minimize risk and maximize profits in the Forex market. This EA is perfect for traders who seek a reliable, robust, and user-friendly solution to enhance their trading experience. Key Features : Advanced Surefire Hedging Strategy : The EA employs a proven Surefire Hedging strategy, which involves opening multiple trades in

THE GOAT INDICATOR ON THE MQL5 MARKET! ️ GET THIS INDICATOR AND STOP LOOKING FOR ANOTHER INDICATOR ️ ️ GET IT NOW BEFORE PRICE INCREASE! ️ SPECIAL DISCOUNT FROM 138$ -> NOW ONLY 88$!!! 2020 Breakthrough Indicator! Imagine that indicators can move the price/market! This indicator use for predict price movement! Using special algorithm for predicting the next price movement! This indicator can be used in any timeframes and any symbols! You can use it for binary option signal

Ultimate Pinbar Scanner (Multi Pair And Multi Time Frame) : ---LIMITED TIME OFFER: NEXT 25 CLIENTS ONLY ---46% OFF REGULAR PRICE AND 2 FREE BONUSES ---SEE BELOW FOR FULL DETAILS A strong pinbar is clear evidence that the institutions are rejecting a particular price level.
And the more well defined the pinbar, the higher the probability that the institutions will
soon be taking prices in the opposite direction.
Pinbar patterns are widely used by institutional traders around the world.

The indicator displays the value of ROC (Rate of change) from the selected price or moving average as a histogram. You can plot the moving average ROC values for smoothing indicator.
Displayed Data ExtROC - rate of change ExtMAROC - smoothing line
Parameters You can change the price, on which the indicator is calculated.
Inputs InpMAPeriod - in case you want to calculate the moving average ROC, enter averaging period. Enter 1 for the calculation of the specified prices. InpMAMethod - smoot
FREE

MACD直方图指标是MACD指标的更新版本,旨在使交易者更容易理解市场趋势和动量变化。与原始MACD不同,此版本包括一个直方图,该直方图是显示两条线之间差异的条形图:MACD线和信号线。 它的工作原理如下:当MACD线高于信号线时,表明市场看涨,直方图条显示为绿色。另一方面,当MACD线低于信号线时,表明市场看跌,直方图条变为红色。 MACD直方图指标的有趣之处在于,当市场动量发生变化时,条的颜色也会发生变化。因此,当从看涨动量转变为看跌动量时,条从绿色变为红色,反之亦然。 另一个有用的功能是,它使检测价格运动和MACD指标之间的差异变得更加容易,突出显示可能的差异,这可能表明市场的潜在反转。 该指标还可以根据用户的偏好隐藏MACD线和信号线以及直方图,从而增强指标的自定义性和灵活性。 总之,MACD直方图指标为交易者提供了一种更简单的市场趋势分析方法,通过清晰的视觉信号和颜色变化帮助做出更明智的交易决策。

Highly configurable OBV indicator.
Features: Highly customizable alert functions (at levels, crosses, direction changes via email, push, sound, popup) Multi timeframe ability Color customization (at levels, crosses, direction changes) Linear interpolation and histogram mode options Works on strategy tester in multi timeframe mode (at weekend without ticks also) Adjustable Levels Parameters:
OBV Timeframe: You can set the lower/higher timeframes for OBV. OBV Bar Shift: Y ou can set the offs
FREE

The EA is designed to work only with USDCAD - M15. It is neither martingale nor grid, each operation has TP and SL.
EA uses stochastics and pin bars as signals to open positions. It is recommended to test and configure it as you see fit.
Beware that past results are no guarantee of future results, you could lose all the money in your account. Trade very carefully.
Enjoy EA.
FREE

The Commodity Channel Index computes the deviation of the typical price of each bar from the average price over a particular time period. Multiplying the median deviation by 0.015 facilitates normalization, which makes all deviations below the first standard deviation less than -100, and all deviations above the first standard deviation more than 100. This adaptive version is based on the indicator described by John Ehlers, in the book Rocket Science for traders. The indicator uses the homodyne
FREE

Displays Forex Calendar events on the chart in the form of multi-colored lines, depending on the importance of the news. Displays the currency and the impact of the news (if available).
[OPTIONS:] Display only news on a currency pair or All news. Display news by major currencies (optional). Setting the time interval of displayed news. Selecting the importance of displayed events. Displaying the effects of news (Impacts) and currency on the chart.
FREE

After purchasing, you can request and receive any two of my products for free!
После покупки вы можете запросить и получить два любых моих продукта бесплатно! The utility is designed for manual placement of pending orders at the high and low of yesterday. The program has a built-in trailing stop, virtual take profit and stop loss. Unworked orders are deleted at the end of the day or manually. You may be interested in my other products: https://www.mql5.com/ru/users/vypchela/seller
Settings
FREE

ALPS is a multi timeframes trend and momentum indicator that lets your profits run . It combines Gator Oscillator, ADX and RSI over multi timeframes in an innovative way. You can trade with full confidence on a rapid timeframe chart with insight and benefits of trend and momentum over a larger timeframe. To keep the chart clear and comprehensible, you can toggle any timeframe ON/OFF instantly at any time point. Different color trend bars mark slow, normal or strong trend based on ADX. Overbought
FREE
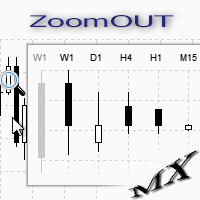
ZoomOUT allows you to have a quick look at a selected bar on a higher timeframe in a pop-up window. After the launch, the indicator works in the background mode occupying no place in the chart and consuming no resources. When activating the indicator by Shift + o (customizable), a pop-up window with a chart displaying bars of higher timeframes is created. To hide a pop-up window, left-click on any clear place on the chart. The indicator is simple and requires no settings.
FREE

。。。。。。。。。。。。。。。。。。。。。。。。。。。。。。。。。。。。。。。。。。。 This indicator is based on Bollinger Bands indicator. It helps user clearly know the Band is expand or contract.
The method of use is the same as the traditional Brin channel index. Users can use different color areas to distribute forest channel indicators in expansion or contraction stage. -------------------------------------------------------------------------------------------
FREE

Fundamentação teórica Rate of Change - taxa de mudança (ROC) O ROC é um oscilador que flutua acima e abaixo de uma linha de zero, medindo a variação percentual de preços ao longo de determinado período. O ROC de 20 períodos mede a variação percentual de preços ao longo de 20 períodos, quanto maior a diferença entre o preço atual e o de 20 períodos atrás, maior o valor do ROC. Quando o indicador está acima de zero, a variação percentual é positiva indicando tendência bullish, se o indicador está
FREE

交易中的点差是市场上金融工具的购买价格和销售价格之间的差额。 点差是交易者为交易机会向经纪人支付的佣金。
每个经纪人都提供自己的交易条款,这已经不是什么秘密了。 价差的大小很重要。 有很多顾问(特别是黄牛)在不同的经纪人表现出不同的结果。 我们一再遇到这种情况。 因此,使用此实用程序,找出您的经纪人在特定工具期间提供的价差。
运行该实用程序几天。 检查日志中的屏幕上的消息,以及在数据文件(。.\MQL5\Files)。
实用程序输入参数:
type_account -账户类型的名称,所有经纪商可能有不同的缩写(ECN,PRO,VIP,RAW等。) actual_spread -仅为活动期间选择数据(这是从2-22小时) save_file_result -将数据保存到文本文件
FREE
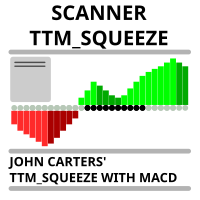
Market scanner based on the indicator published here Download the 'John Carters TTM Squeeze with MACD' Technical Indicator for MetaTrader 5 in MetaTrader Market (mql5.com) . Only the instruments that are in the Market Watch window are scanned. Maximum number of scanning tools up to 5000. The scan timeframe is selected from the timeframe panel of the terminal. To use it, open any chart and attach the Expert Advisor to the chart, the 'Search' button will appear in the upper left corner. When you
FREE

It is the simplest indicator in existence. It has only one function: report the seconds elapsed since the last minute end in a very convenient way, with a label that can be moved in the chart, so that the trader does not have to take his eye off the forming candle. It is used on M1, but also on larger intervals, for those interested in opening/closing positions at the best time. Sometimes an intense movement in the last 10" of the minute gives indications of future trend, and can be used for sc
FREE

you can close all your positions in profit or lost when you use this robot. 1.you set your max profit and max lost for all your positions. 2.the robot show you in a window beside your chart. 3.when your equity reach your target close all your positions. 4.you can use one of them or both (profit or lost)togather. 5.this robot close all your positions. ((if you have any idea or want somthing i can help you)) i hope you win in all your times of life. best regard
FREE

The Emerald is a Comprehensive utility integrated with a number of tools including the Currency Strength Meter, Trade/directional signal, signal strength, Current bar countdown timer, Forex market sessions time converter and many more.
Can be used in all time frames and all markets The currency strength meter helps you identify which currencies are strong and which currencies are weak. All the 10 major currencies are monitored in real-time. The Emerald can used to predict currency movements wh
FREE

Wizard Poverty Sanitizer is a moving average based indicator, using three EMA'S being 2OO EMA which is the slow EMA, the 21 EMA which is the median and the 10 EMA which is the fast. When the median and the fast EMA cross a signal is given, when the fast EMA goes above the Median EMA a buying signal is given and when the fast cross below the median a selling is given. Note that you can change the moving averages to you own choices of moving averages, allowing you to set your own MA strategy. a
FREE

Simple indicator used in technical strategies to analyze tops, bottoms and reversal or continuation points. Developer information:
Line values and colors:
Buffer 0 : ZigZag line value;
Buffer 1 : ZigZag color value;
Buffer 2 : Median line value;
Buffer 3 : Median color value; Buffer to get the values of each top and bottom. Buffer 4 : Top value;
Buffer 5 : Bottoms value;
Buffer that returns the type of the last direction.
Buffer 9: 0 = Not updated, 1 = High, -1 = Low;
FREE

The News Breakout Strategy is an advanced, automated trading solution designed to capitalize on market movements during specific time intervals. Developed for the MetaTrader platform using MQL5, this strategy identifies key breakout points within a user-defined time range and executes trades accordingly. Additionally, it adjusts the timing based on news events related to two currencies, enhancing its responsiveness to market conditions.
FREE

Market tops are characterized by Volume Climax Up bars, High Volume Churn and Low Volume Up bars (also called Testing). Market bottoms are characterized by Volume Climax Down bars, High Volume Churn and Low Volume Down bars (Testing). Pullbacks, in either up or down trends, are similar to market topping or bottoming patterns, but shorter in duration and with simpler volume patterns.
FREE

This indicator draws the high intraday price and the low intraday price of the first n minutes of the day. The chart shows the days with vertical lines and two horizontal lines to indicate the max and the min close price of the n first minutes of the day. The max/min lines start and end with the day calculated. With this indicator you can see how starts the day compared with the previous days. It is valid for any market inasmuch as the start time is calculated with the data received.
Paramete
FREE

This indicator will show the the change of volumes via 2 lines of SMA: . Fast line (default is 5 candles) . Slow line (default is 13 candles) We can use the crossing point of fast line and slow line to know investors are interesting in current price or not. Pay attention: The crossing point is not signal for entry. Absolutely that we must use in combination with other indicators for sure. Parameters: . Fast line periods: the periods (candles) to calculate SMA of fast line . Slow line periods: th
FREE
您知道为什么MetaTrader市场是出售交易策略和技术指标的最佳场所吗?不需要广告或软件保护,没有支付的麻烦。一切都在MetaTrader市场提供。
您错过了交易机会:
- 免费交易应用程序
- 8,000+信号可供复制
- 探索金融市场的经济新闻
注册
登录