Conheça o Mercado MQL5 no YouTube, assista aos vídeos tutoriais
Como comprar um robô de negociação ou indicador?
Execute seu EA na
hospedagem virtual
hospedagem virtual
Teste indicadores/robôs de negociação antes de comprá-los
Quer ganhar dinheiro no Mercado?
Como apresentar um produto para o consumidor final?
Expert Advisors e Indicadores para MetaTrader 5 - 51

>>> Aproveite um EA gratuito como parte da nossa promoção de seleção de produtos EW! <<< Este EA implementa a estratégia Turnaround Tuesday , uma abordagem comprovada que aproveita a tendência do mercado de reverter direção às terças-feiras. Desenvolvido dentro do framework Edgellence, inclui: Tamanho automático de lotes Funções de gestão de dinheiro e risco Ponto de equilíbrio e trailing stop Rastreamento diário e total de retornos Integração com ForexFactory Suporte multilíngue
Esta estraté
FREE

Funcional no mercado Forex. Funcional no mercado B3 - Bolsa Brasil Balcão. Motivação O indicador Price Guide é uma ferramenta que auxilia a inserção de pontos de suporte e resistência no preço escolhido e na quantidade que desejar, ele vai da agilidade em seu setup. Essa versão DEMO ira funcionar no Meta Trader 5 conta Demo e Testador de estratégia. Adquira a versão Full que funciona em conta Real clique em: https://www.mql5.com/pt/market/product/111897 Funcionamento
Metodologia dissemin
FREE

Transforme sua análise de gráficos financeiros com nosso inovador Indicador de Coloração de Candles. Este poderoso recurso permite que você visualize instantaneamente as tendências de mercado com base nos preços de fechamento em relação a uma média personalizada. Coloração Personalizada: Escolha as cores que melhor se adequam ao seu estilo de análise. Destaque candles acima da média em uma cor vibrante de sua escolha e os candles abaixo da média em outra cor distintiva. Média Ajustável: Adapte
FREE
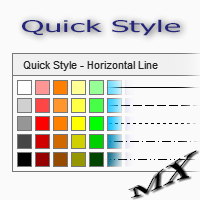
The Quick Style utility is designed for facilitation and acceleration of working with the properties of graphical objects. Left-click a graphical object while holding the Shift key to open the quick access window for configuring the object properties. In the window, you can change the color, style and line width with one click, including those of other graphical objects. All changes are displayed immediately. To close the Quick Style , simply click the free space on the chart. The utility is eas
FREE
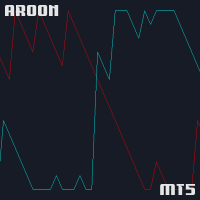
The Aroon indicator measures the time since price highs and lows over a set period. It outputs two lines, Aroon Up and Aroon Down. Aroon Up shows how long it has been since a recent high occurred. Aroon Down shows how long it has been since a recent low occurred. When Aroon Up stays close to 100 and Aroon Down stays near 0, it suggests an upward trend. When Aroon Down is near 100 and Aroon Up is near 0, it suggests a downward trend. The closer each line is to 100, the stronger the recent trend i
FREE

Adaptive Volatility Range [AVR] - is a powerful tool for identifying key trend reversals. AVR - accurately displays the Average True Volatility Range taking into account the Volume Weighted Average price. The indicator allows you to adapt to absolutely any market volatility by calculating the average volatility over a certain period of time - this provides a stable indicator of positive transactions. Thanks to this , Adaptive Volatility Range has a high Winrate of 95% There are two ways t

With this indicator user can determine not just pivot like turning points. User able to spot trading ranges boundaries and support-resistance levels. In a strong trend the reverse signals also gives us excellent entry points. Recommended user settings: In the Attis volume: look back period : 1 or (3) MA_Lenght 99. ( of course one can play with the settings and get tailored signals... as you need)
FREE
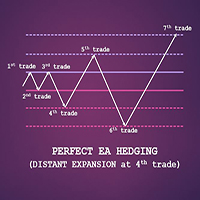
Hedging was known as "100% Winning Strategy" in many decade before. But it doesn't seem right in the side-way market. If you put Hedging distant too close, it will entry as more as the side-way stay. If you put Hedging distant too far, it would never hit the BEP before the account blown.
So, now "EA by CAPO" brought to you the new generation of Hedging that help user avoid the Risk from side-way market. We let the EA observe first 3trades with the same distant and it increase the distant at 4th
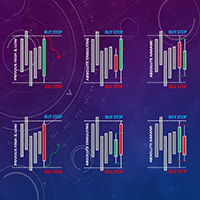
Configuration for XAUUSD is in the provided image below:
!!RULE: Spread Must Be Maximum at 30points, Leverage 1:500 or HIGHER!!
Simple describe follow the above configuration(100$ open 0.1Lot): 1, Fixed lot size 2, Always use SL 3, Always use Trailing SL (to maximize PROFIT) 4, Only one trade(one BUY or one SELL) per day 5, No Grid 6, No Hedge 7, No Arbitrage 8, No Martingale 9, No Compound 10, Another many function and many more to do the back test This EA is so simple to use and especially n

"Volality 75 Boom Crash VIX" is an advanced analysis tool designed to identify key breakout zones in volatile asset pairs and boom crashes. Its focus is on highlighting moments of high volatility in the market.
This indicator is perfect for both scalping and swing trades.
"Volality 75 Boom Crash VIX is not just an indicator, but a trading strategy in itself.
The most recommended timeframe for using the indicator is 15M MINUTES.
The breakout levels represent the balance between bullish and b

Ever wanted to use StochRSI on MetaTrader5 Terminal which you see and use on TradingView? Now you can use same StochRSI indicator in your MetaTrader5 and enjoy more time in Trading.. You can change StochRSI settings if you want to change and it will be ready to use for you... Now you will not go anywhere to use only indicator there... Open charts , load Indicator this Indicator and you are ready to do analysis in MetaTrader5 and Put Trades when you feel okay with your analysis.
FREE

This tool will remove buttons and text labels from the chart, after you remove Trading box Order management or Trading box Technical analysis .
You just need to drag this tool to your chart and after cleanup of objects is finished, the tool will remove itself from the chart.
Please check images below that present Before and After using the Removal tool.
There is also a short YouTube video at the bottom to show how easy it is to clean your chart after using Trading box tools.
- input variabl
FREE

Monte Carlo simulation is an Indicator that uses a Monte Carlo model to calculate the probability of the price going up or down. If the price has a probability of going up or down more than 90%, the system will enter a trade by doing a back test of gold assets. It was found that it was able to generate a return of more than 20% in a period of 5 months while having a MAX DD of less than 7%.
What is a Monte Carlo simulation?
A Monte Carlo simulation is a model used to predict the probability of
FREE

Indicator introduction:
The indicator is calculated by volumes and prices, It is a single side indicator, only has up arrow signals. It is better to use it in conjunction with other trend indicators, and you need to find the most efficient time to use it in order to acquire a high winning probability. The indicator can send emails, alerts and notifications to you when the indicator before k line has an up arrow. The indicator's parameters can be changed, including the computation period of the
FREE

Introducing the Sniper AUDUSD Trading Strategy Sniper AUDUSD is a highly accurate forex trading strategy specifically designed for the AUD/USD currency pair. It leverages advanced technical analysis to identify high-probability entry points, aiming to maximize profits while minimizing risk. The Sniper AUDUSD strategy uses complex algorithms to analyze and identify trends to generate highly accurate buy and sell signals. Once the signal is activated, the system will automatically execute trades
FREE

TG Ponto de Cobertura Este Indicador verifica o seu resultado das operações no dia relativo ao ativo do gráfico e adiciona uma linha no preço correspondente ao ponto de cobertura para a posição aberta, considerando o preço de entrada e o tamanho do lote. O ponto de cobertura será recalculado após novas entradas, se baseando no preço médio da operação aberta e o tamanho do lote.
Se o resultado do dia estiver zerado, uma linha será exibida no preço da operação atual. Se o resultado do dia estiver
FREE

Hello this is MT5 version of my first EA Project - MA CROSS Simple MA Cross Fast and Slow with additional High Time Frame Filter. You can set manually to get optimum Result. It's suit for swing Trader that Trade on High Time Frame. ex. H1 / H4 with D1 Filter. Or you can modify It that follow your strategy.
Give me good feedback to improve for better version. Cheers!!
Hurry up FREE download for Limited Time!!
Please test It on Demo account or strategy tester before applied on Live Account
FREE

3 Bulls and 3 Bears EA is an expert advisor that uses candlestick patterns and EMA indicator to trade the forex and crypto market with a grid system. The trading strategy of this expert advisor is based on the following logic: this expert buys or sells when a certain number of bear and bull candles with a specific body are formed. The expert advisor also uses a grid system to increase the profitability and reduce the risk of each trade. The grid system works by placing multiple orders at differ
FREE

Bem-vindo ao HiperCube DonChian Código de desconto de 25% na Darwinex Zero: DWZ2328770MGM
Este indicador fornece informações úteis sobre o preço, mostrando se o preço é suscetível de aumentar ou diminuir.
Funcionalidades: Indicador nas janelas principais Personalize as cores das suas velas Período personalizado do indicador Definir parâmetros
Como interpretar: Tendência de alta: Se algumas velas subirem na faixa superior, significa que é possível que uma corrida de alta esteja a chegar. Tend
FREE
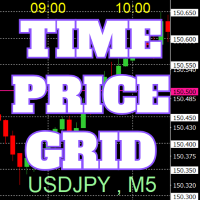
No gráfico, são desenhadas grelhas de preços e tempo em números arredondados para facilitar a referência.
A partir da "Entrada de Parâmetros", é possível configurar intervalos de preços para cada período. As linhas da grade para números significativos (números redondos) são mais espessas e se destacam mais do que outras linhas, tornando-as facilmente distinguíveis. A grade para números significativos (números redondos) pode ser configurada com uma cor diferente das outras linhas. As cores em vá
FREE

TickAll - Automated Trading Robot "Please test it in the EURUSD 15-minute timeframe" Introduction: TickAll is an automated trading robot designed to assist both novice traders and professional traders in the Forex market. Utilizing advanced algorithms and up-to-date market analysis, TickAll helps you make the best trading decisions.
Our trading robot stands out from the rest due to its unique feature - the ability to sometimes incur losses yet ultimately generate profits. Unlike
FREE

The TrendOscillator Indicator is an upgraded version of the traditional Stochastic Oscillator. It comprises two lines: %K and %D. The %K line represents the current market position. In contrast, the %D line is a moving average of the %K line used to generate signals and identify potential entry or exit points. The good thing is the indicator works on all timeframes like the traditional Stochastic. However, to avoid any false signals, applying the indicator on longer timeframes is better
FREE

(This is the free version of our trade manager, download it for free and test it, and provide feedback. If you are satisfied with its capabilities, you can try out its bigger brother the Deriv Scalp Manager also available from us.)
EA Summary If you are a scalping trader who wants to place and close trades quickly and efficiently, you need a powerful tool that can help you achieve your goals. That's why we created the Deriv Trade Assistant EA, a smart and easy-to-use expert advisor that au
FREE

MS_Expert is structured based on a specific technical analysis indicator ( MACD Oscillator and Stochastic Oscillator ). It has many parameters so that each user can find the appropriate settings that suit their investment profile. It can work on 28 different pairs. The default parameter settings are indicative, I recommend that each user experiment to find their own settings.
FREE

The daily custom period seperator indicator allows you to draw period seperators for your lower time frame charts H1 and below. The period seperator gives you options to set different colors for: Weekend - saturday/sunday Monday and Friday Midweek - Tuesday to Thursday.
By default the indicator plots the period seperator line at 00:00 hours for the last 10 days.
Use Cases: The indicator can be used as a colourful alternative period seperator to the default MT5 period seperator. For those tha
FREE

TimeBar TimeBar é um indicador de informação simples que mostra o tempo restante até o fechamento da barra, bem como o tempo decorrido desde a abertura da barra e a hora atual. Para facilitar a percepção, foram adicionados dois tipos de modos de exibição: na forma de comentário no canto superior esquerdo do gráfico, ou na forma de objeto gráfico.
Vantagens Seleção de fonte Tamanho da fonte. Você pode definir qualquer um. Ao comentar é muito pequeno Você pode mover objetos. Qualquer momento pod
FREE

Description of the Horizontal Levels Indicator with Manual Interval Adjustment The indicator is designed for automatic plotting of horizontal levels on the chart of a financial instrument. It allows users to manually set the interval between levels, making it adaptable to various trading strategies and timeframes. Key Features: Flexible Configuration : Users can define the interval between levels in points, percentages, or any other unit suitable for the selected asset. Automatic Plotting : The
FREE

The value of the MMCCI indicator is calculated based on the "Minors" and "Majors" currency pairs and is based on the original CCI algorithm. This gives us a more accurate result than if we only observed the value of the current currency pair. You can request alerts when the CCI value crosses or returns from the specified level or crosses zero. All settings can be saved in a template. Setting options:
Basic signals that can be enabled separately for the current and the previous candle: Overboug
FREE

Bonus when buying an indicator or an advisor from my list. Write to me in private messages to receive a bonus. Manual Assistant MT5 is a professional manual trading tool that will make your trading fast and comfortable. It is equipped with all the necessary functions that will allow you to open, maintain and close orders and positions with one click. It has a simple and intuitive interface and is suitable for both professionals and beginners.
The panel allows you to place buy and sell orders w
FREE
A system with steady ROI > 10% a month like clockwork! Hi Lo Breakout strategy opens and closes trades based on the time of day in relation to the highs and lows of both yesturday and today. It will then trade out these prices using the trade management settings within user inputs. For best results see .set file at comment no2 . Features :
A purely mechanical system. Simply set and leave. No martingale or grid. Risks are small per trade. An optional automatic lot adjustment feature t
FREE

I’m sharing this code here for free to support the trading community. Feel free to modify it or even copy it entirely for your own use. I hope it’s helpful, and don’t hesitate to reach out if you have any questions or feedback!
https://github.com/holle112/AlgoTradingConcepts.git
Requirements
Trading pairs all trending Pairs especially USDJPY
Timeframe M1 to H6
Minimum deposit $ 100 Leverage 1:200 Brokers Hedging Pro or ECN Account
Key Features: 1. Risk Management: Counter Triple MA prioritiz
FREE

The ICT Zone Arrow Indicator is an innovative tool developed based on ICT principles. It provides ease and efficiency in identifying key trading areas in the market. Based on the 'killzone' concept, this indicator provides traders with important support and resistance levels by identifying places where large changes in price direction could potentially occur.
The ICT Zone Arrow Indicator provides visual graphical markers that help traders identify trade entry zones with a high probability of s
FREE

An indicator for visualizing time ranges of key trading sessions: Asian, European, and American. The indicator features functionality for setting the start and end times of each trading session, as well as an adjustable timezone of the trading server. The main advantages of the indicator include the ability to operate with minimal CPU load and memory usage. Moreover, it offers the option to specify the number of displayed historical days, providing the user with flexible market dynamics analysis
FREE

This Expert advisor Trades Trending conditions, best use on EURUSD 1hr chart Strategy uses Bollinger band , Rsi and a momentum indicator to identify the best trading conditions
Includes news filter and account protection settings , also entry protection for high spread . Optimized code for quicker optimization in mt5
Download demo and test out Bollinger Band Lion .
FREE
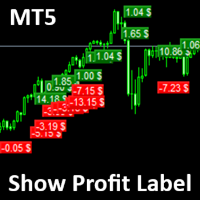
Show your profit or loss next to the candle. This is a helpful tool if an EA don't have this feature build in.
Settings: Font color Background color for profits Background color for losses Font size Horizontal shift from candle (pixels) Vertical shift from candle high/low (pixels) Magic number filter (0 = all trades) Comment filter (empty = all trades) Show only trades for the attached chart symbol
FREE

The script tries to determine the overall direction of the market, using smoothed Heiken Ashi candles. The coloring system (using bright and dark colors) is an attempt to detect strong market and weak market conditions. There's also an oscillator within the script
These are the features: Alert condition Features: You can now set alerts in the alert dialog for events like trend switch, trend strengthening and weakening; all for both Bullish and Bearish trend.
I also added the code for custom a
FREE

BW Automate - советник для автоматической торговли по сигналам системы Билла Вильямса:
Пробой уровня фрактала Линия Баланса Торговля в зоне !!! Позиции будут открываться только когда цена находится ЗА линиями Аллигатора
Основные возможности советника . Торговля в следующих режимах:
Безостановочная торговля в направлениях - Buy/Sell/Или обоих Торговля от уровня и до бесконечности
Торговля от уровня до уровня Варианты 2 и 3, плюс фильтр по заданной МА (торговать только когда цена находится выше/н
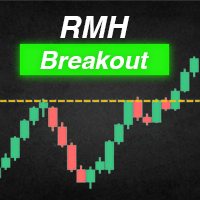
RMH Breakout is a high-performance Expert Advisor developed based on a trend-following strategy. This EA is specifically optimized for index markets and offers fully automated trading capabilities. Key Features: Strategy Type: Trend-following strategy Defines entry conditions using RSI and price high values. Filters: EMA Filter: Checks whether the price is above or below the EMA. Daily Bias Filter: Opens trades in the direction of the daily bias. Time-Based Filtering: Operates only during speci
O Deriv Volatility Bot é um algoritmo de trading poderoso e fácil de usar, desenvolvido especificamente para os ativos do Índice de Volatilidade da Deriv . Após extensos testes no histórico de dados e uso em mercado real, este EA foi cuidadosamente ajustado para lidar com as características únicas dos índices sintéticos. Embora tenha sido otimizado para os ativos do Índice de Volatilidade da Deriv, ele também pode ser usado em outros instrumentos , como pares de moedas e ouro . No entanto, devid

For those who hate candlesticks in lower timeframes (M1 through M15) we "invented" a clean new way to follow Price movement and displacement (volatility) called Price Trail Chart . The big "secret" is to get rid of those annoying candle wicks and draw the whole complete candle without them, this way we get a cleaner chart and a new view of the Price Path. No Open or Close markings, just LOW's and HIGH's, full body candle.
Additionaly we inserted a Volume monitor from our Best Downloaded indicato
FREE

https://t.me/mql5_neuroExt actual version Signal https://www.mql5.com/ru/signals/1511461
You can use any tool. The bases will be automatically created at the start of the Learn. If you need to start learning from 0 - just delete the base files. Initial deposit - from 200 ye. Options:
DO NOT ATTEMPT TO TEST WITHOUT NEURAL NETWORK TRAINING!
it is enough for the balance graph after training to be horizontal.
generating a training base is extremely simple.
there is a ready-made training for U
FREE

The Candle High Low Exit indicator uses the highest high and the lowest low of a range to draw trailing stop lines (orange under buys, magenta over sells) that advance with the trend until the trend changes direction. Moreover, the trailing stop lines are generated to support the order’s trend direction (long or short): In an upward trend, the long trailing stop line (orange line under buy) appears and advances upward until the close crosses under the line.
In a downward trend, the short trai
FREE

Swiss InsideOutsideBar Imortance of Inside- and Outside Bars Inside bars are completely engulfed by its previous bar. The pattern is also known as "harami" (pregnant). Outsidebars engulf the previous bar. Inside bars might mark situations before an outbreak. They are a condensed form of a symmetrical triangle. Symmetrical triangles represent a battle between bulls and bears. There can be an outbreak to either side, mostly the outbreak is in direction of the main trend. The combination of inside
FREE

Introducing TRAD-E- LITE : Your Ultimate Trading Assistant! Are you tired of manually analysing the markets and executing trades? TRAD-E- LITE is here to assist you! Developed by Gold Lion XI, this expert adviser utilizes advanced algorithms to identify profitable trading opportunities and execute trades automatically, saving you time and effort. Key Features: Trading Time Management: Take control of your trading schedule. With TRAD-E- LITE , you can define specific trading hours based on your p
FREE

A comprehensive tool for determining the levels of support, resistance, reversals in relation to trading sessions. The indicator's thesis can be expressed as follows: "Support and resistance levels are undoubtedly formed by the psychological barriers of market participants, and influence the further behavior of the price. But these barriers are different for different groups of traders ( One man's meat is another man's poison ) and can be grouped by territory or by the trading time ". Follo
FREE

The "Standardize" indicator is a technical analysis tool designed to standardize and smooth price or volume data to highlight significant patterns and reduce market noise, making it easier to interpret and analyze.
Description & Functionality: Standardization : The indicator standardizes price or volume values by subtracting the mean and dividing by the standard deviation. This converts the data into a distribution with zero mean and standard deviation of one, allowing different data sets t
FREE

The "Price change from zero" indicator is designed to display price changes over a selected period in points.
1. The basic idea The indicator calculates the difference between the closing price on the current bar and the opening price on the bar set back by the Candle Period. The result is displayed as a line in a separate window.
2. Interpretation Positive value: The price has increased over the period.
Negative value: The price decreased during the period.
Zero value: The price has retur
FREE

The name Aroon means “ Dawn's Early Light ” in Sanskrit. His creator Tushar Chande chose this name because the indicator is designed to catch the beginning of a new trend. At first sight it seems a little confusing all those jagged lines but after you understand the basics of it, you will find this indicator pretty cool and use it in a variety of ways, i.e.: Trigger, Trend Filtering System, and so on. The Aroon indicator was created in 1995 so it is a "modern" indicator compared to the Jurassic
FREE

Executa a exportação do histórico de transações da conta de negociação atual. O arquivo é salvo na pasta de dados, que pode ser aberta através do menu principal do terminal: Arquivo -> Abrir diretório de dados (Ctrl+Shift+D) e vá para a pasta MQL5/Files . O nome do arquivo é gerado automaticamente ou configurado manualmente através dos parâmetros do script. O arquivo de histórico pode ser usado para analisar o histórico no Excel (pode ser necessário abrir através do Assistente
FREE

Descubra o poder da análise de volume com o nosso indicador de perfil de volume para Metatrader! / Versão MT4
O Perfil de Volume Básico é um indicador especificamente concebido para negociadores manuais que procuram otimizar a sua negociação. O indicador de perfil de volume é uma ferramenta essencial para qualquer operador sério que pretenda compreender melhor o comportamento do mercado. Com a nossa solução inovadora, pode visualizar de forma clara e concisa como o volume de transacções es

O Indicador TRIXe é a combinação do indicador TRIX (Triple Exponential Moving Average) com adição de um sinal tipo EMA (Exponential Moving Average). Fornece sinais de continuidade de tendência e inicio de uma nova tendência. Os pontos de entrada e saída de operações ocorrem quando as curvas do indicador se cruzam. Tem melhor desempenho quando combinado com outros indicadores.
FREE
Product Name: Trailing Stop and Breakeven Management EA Description:
This EA (Expert Advisor) is designed to set trailing stops and breakeven levels for trades based on input parameters and a magic number in MT5. It can be used to manage trades placed manually or by any other EA. The EA allows customization of various settings to suit your trading strategy. General Settings: Enable Magic Number (ENABLE_MAGIC_NUMBER): Enable to use a magic number for trades. Set to false for manual trades. Magic
FREE

I’m sharing this code here for free to support the trading community. Feel free to modify it or even copy it entirely for your own use. I hope it’s helpful, and don’t hesitate to reach out if you have any questions or feedback!
https://github.com/holle112/AlgoTradingConcepts.git
Requirements
Trading pairs all trending Pairs especially USDJPY
Timeframe M1 to H6
Minimum deposit $ 100 Leverage 1:200 Brokers Hedging Pro or ECN Account
Key Features: Multi-Timeframe Capability : Profitably trades
FREE

SPREADEX e' un indicatore per MT4 e MT5 che indica la distanza dell'ASSET dal GP. il GP e' il prezzo del vero valore dell'ASSET sottostante ottenuto per stima. Il GP e' come una calamita, attira il prezzo dell'ASSET con alta probabilita' ed all'interno della stessa giornata di trading. Quindi SPREADEX indica quali sono gli asset piu distanti dal GP al momento in tempo reale. Fornendo un punto di vista al TRADER su quali asset concentrarsi e cercare eventuali segnali di inversione dei prezzi per
FREE
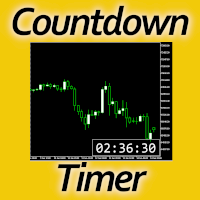
Timing can make the difference between a winning and a losing trade. Therefore, a bar countdown display is a must-have tool for any trader. Knowing exactly how much time is left, before the current bar will close, certainly helps decision-making in real time. Technical detail: This indicator uses the MQL5 function "OnTimer", ensuring the accurate measure of each passing second, rather than relying on the flow of incoming tick information from the server. Most other countdown indicators for MetaT
FREE
Is Zero Lag profitable? Not always, different system is for different pairs. You can play around with this indicator from Mladen, I have modified it with Bollinger Bands over T3.
You can change the period and how it calculate. MT4 version soon will be released too. Please leave a review , it helps us and we will share more indicators. .... Thank you and happy trading
FREE

This indicator draws the high intraday price and the low intraday price of the first n minutes of the day. The chart shows the days with vertical lines and two horizontal lines to indicate the max and the min close price of the n first minutes of the day. The max/min lines start and end with the day calculated. With this indicator you can see how starts the day compared with the previous days. It is valid for any market inasmuch as the start time is calculated with the data received.
Parameter
FREE
EA "MA Line" with martingale feature
EA will open position once per signal
To see how EA works, please watch the video below. In the video, I perform parameter optimization and do a backtest. The parameters that are optimized are: - MA Period - Stop Loss - Take Profit
For the future, I will try to optimize and test EA, especially the expert advisors in the mql5 community. hopefully it can be useful for colleagues in the mql5 community.
FREE

ESTE INDICADOR FAZ PARTE DO EA: HIPERCUBE PRO GALE BTC Código de desconto de 25% no Darwinex Zero: DWZ2328770MGM
Apresentamos a Nova Versão do Indicador Donchian
Estamos entusiasmados em apresentar a nova versão do Indicador Donchian , desenvolvida com melhorias de ponta e maior precisão. Agora completamente adaptada para o HiperCube Pro Gale , esta ferramenta atualizada oferece uma experiência fluida para uma negociação mais eficaz.
Por que esta versão é revolucionária:
Adaptada para o
FREE
Easy Order Send ajuda no lançamento de ordens no gráfico usando atalhos do teclado (SHIFT or CTRL) Para enviar uma ordem, segure SHIFT ou CTRL e clique com o botão esquerdo do mouse. Essa versão é Beta, e conta com as seguintes funcionalidades:
1 - Enviar ordem usando SHIFT E CTRL 2 - Botão de CANCELAR ordem 3 - Botão de CANCELAR posição 4 - Mover sua ordem 5 - Monitorar seu Lucro no Trade
FREE

Классический индикатор фракталов является запаздывающим, т.к. для подтверждения образования фрактала необходимо ждать 2 бара. Если этого избежать, то индикатор будет перерисовывающим, т.е. при обновлении максимума/минимума в течении 2-х баров фрактал будет менять своё положение на более позднее. В данном продукте максимально нивелированы оба этих недостатка, при этом совмещены достоинства обоих подходов! Индикатор показывает фрактал сразу в момент его образования, а в случае его обновления показ
FREE

Pivot Points are used by Forex traders to find support and resistance levels based on the previous day's price action. There are various ways to calculate pivot points, including averaging the open, high, low, and close of the previous day's chart price.
Forex Traders use a combination of pivot points with moving averages to find trading opportunities in the currency markets.
Pivot points are very useful tools that use the previous bars' highs, lows and closings to project support and resist
FREE

Many friends asked me for a simple, non-obtrusive, resource-friendly clock to track the time during their trades. It seems pretty obvious, but it is a must-have for those trading the market manually, waiting for the Market News, or just to visually know what time it is... Trading is an absorbing endeavor! So, here it is... Totally configurable, including Font Type, Font Size and Chart Location: Upper Left/Center/Right OR Lower Left/Center/Right, with a little twist of adjusting the Offset, just
FREE

Este EA é usado para negociar período paralelo Você define a quantidade do lote, a quantidade do ponto de lucro (não pips), a quantidade do ponto de stop loss, o preço superior, o preço inferior Quando o preço atual subir para o preço superior igual ou superior, a EA fará uma ordem de VENDA com preço de lote e T/P e preço S/L Quando o preço atual cair para igual ou menor que o preço mínimo, a EA fará um pedido de COMPRA com lote e preço T/P e preço S/L Portanto, enquanto durar o período lateral,
FREE

A tool for creating Bill Williams indicators Our tool provides the ability to set Bill Williams indicators on a chart with a mouse click. - The Awesome Oscillator (AO) indicator helps to assess the driving force of the trend. - Alligator indicator — determines the current state of the trend and possible entry and exit points. - Fractals indicator — helps to identify significant levels - Accelerator Oscillator (AC) indicator — shows the change in trend acceleration. - Market Facilitation Index
FREE
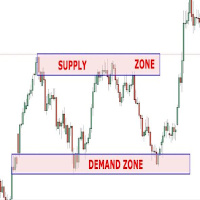
This Expert Advisor can be applied to many markets because It exploits basic supply/demand and price action concepts. It identifies the major rotation zones (PRZ), supply and demand zones and supports and resistances within major price trends. It buys at discount zones and sells at premium prices. It can and should be optimized through the Metatrader tester to find the best parameters to use for current market conditions. This is not a fixed strategy rather a full trading algo that will find whi
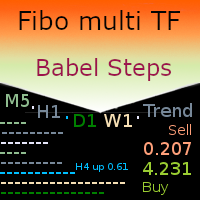
MT5 netting the “Babel Steps” robot uses the ZigZag indicator to generate Fibonacci levels on M1, M5, M15, H1, H4, D1, W1 periods of the charts , calculates the strength of trends for buying and selling. It opens a position when the specified trend level is exceeded plus Bollinger indicators and Stochastic indicators inform about oversold / overbought market. Stochastic and Bollinger indicators help to increase or decrease the position. If market moves into favorable direction the Robot genera

[signal] [ back test $10k to $94million ] [ back test risk% = 0.10 ] [ back test risk% = 0.2 0 ] [single symbol settings] [set files] [ inputs explained ] ******Live Signal +107.00% (26/02/2025)********** RTR No Hard Stop Losses algo EA for MT5 Load this EA onto any Forex M5 chart like EURUSD/GBPUSD/USDJPY has to be a 24hr market . High win rate approx. 78.00% Trend following with high % win rate . No Martingale . There is a trailing stop for all trades on the higher timeframe . Multiple Symbo

Este consultor fornece os seguintes recursos: Abra uma posição: quando o preço cruzar a linha de tendência, abra uma ordem longa ou curta. Fechar: Quando o preço cruzar a linha de tendência, feche sua posição longa ou curta. Trailing Stop Loss – O EA continuará a aumentar o stop loss para pedidos longos ou reduzir o stop loss para pedidos curtos ao longo da linha de tendência. A linha pode ser uma linha de tendência ou uma linha horizontal, As linhas de tendência podem ser raios ou segment

--------------------------------------------------------- Zephyrlar Expert MT5 Optimal Performance: Designed to work best with GOLD on the M5 timeframe. Capital Requirements: Minimum starting capital of $1000 for a 0.01 lot size (AutoLot feature included). Continuous Optimization: Monthly updates to enhance performance and adapt to market conditions. Stay Informed: Updates and performance reports in the comments section. Live Trading: Follow our live trades at https://t.me/lullfrx
FREE
O Mercado MetaTrader é um site simples e prático, onde os desenvolvedores podem vender seus aplicativos de negociação.
Nós iremos ajudá-lo a postar e explicar como descrever o seu produto para o mercado. Todos os aplicativos no Mercado são protegidos por criptografia e somente podem ser executados no computador de um comprador. Cópia ilegal é impossível.
Você está perdendo oportunidades de negociação:
- Aplicativos de negociação gratuitos
- 8 000+ sinais para cópia
- Notícias econômicas para análise dos mercados financeiros
Registro
Login
Se você não tem uma conta, por favor registre-se
Para login e uso do site MQL5.com, você deve ativar o uso de cookies.
Ative esta opção no seu navegador, caso contrário você não poderá fazer login.