适用于MetaTrader 5的EA交易和指标 - 135

It's a multi-symbol and multi-timeframe scanner for our indicator - ACB Breakout Arrows . With default settings, it scans for the buy/sell signals on 28 currency pairs and 9 time-frames concurrently.
Features
It can scan 252* combinations of symbols and time-frames from a single chart. Open the signal's chart loaded with a predefined template with a single click. Easy drag n drop anywhere on the chart. Real-time alerts with popup, sound, push-notifications and email alerts.
Input Parameter

Painel informativo para day trade. Funciona em conta NETTING ou conta HEDGE. Tem a possibilidade de separar as infomrações dos trades conforme o número mágico de cada EA. Foi desenhado para melhor funcionamento no mercado futuro da B3. Durante as operações, o painel faz a plotagem das linhas de preço, stoploss e takeprofit (gain). Possui informações de volume, preço médio, lucro e stops. Mostra o histórico de ganhos diário, semanal, mensal e anual.
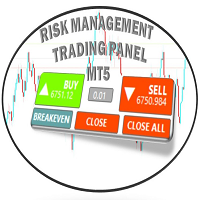
Risk Management Trading Panel calculates the volume of a position based on Account Balance , Currency , Currency Pairs , Synthetic Indices (Deriv Broker) once the user places stop-loss level ,and risk tolerance (set in percentage points of current balance). It also Displays reward/risk ratio based on take-profit and it shows recommended risk per trade based on current balance.
Trailing Stop your positions and Applying Breakeven with a push of a button has never been easier and you can also set

Naked Forex Kangaroo Tail Indicator Kangaroo Tail Indicator is a pattern recognition indicator for Forex, Stocks, Indices, Futures, Commodities and Cryptos.
The Kangaroo Tail is a multi-bar pattern.
The Kangaroo Tail pattern is very effective and is very simple to trade.
The strategy that comes with the Kangaroo Tail is based on price action.
The indicator does what it was designed for: displaying Kangaroo Tail patterns. Don't expect to follow the up and down arrows and make money . Tradin
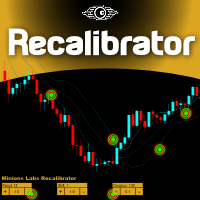
Once again, We Nailed It! Imagine a faster and smoother way to recalibrate ANY Indicator using just obvious and intuitive mouse clicks, realtime, real fast, real results on your chart just right after the Click... Instead of the boring "Open Settings dialog / Change one setting / Click OK / See what happens on Chart...", then repeat this process endlessly until you kill yourself!
Well... No More... Welcome to the Minions Labs Recalibrator tool!
Now you can Study, Trial, Experiment and Play with

Naked Forex Big Shadow Indicator Big Shadow Indicator is a pattern recognition indicator for Forex, Stocks, Indices, Futures, Commodities and Cryptos.
When you have a Big Shadow on your chart then this is a strong signal meaning that you might be ahead of a reversal. You can take other elements (momentum, trend, volatility, price action, fundamentals) to build a complete strategy and confirm your entries. Beware that you might not make money just following the arrows generated by the pattern re

JUST EURUSD M5 !!
That´s it! Just attach this EA to EURUSD M5 Chart and let it trade yourself. Based on a particular strategy, this EA follow trends and trades according to it. You can configure some parameters, such as lot size, magic number, spread, number of opened orders, takeprofit, stoploss, trigger filter, trade out system and a calendar trade filter. Takeprofit and Stoploss can be fixed in points (10 x pips). Please PM if you have some doubt.

Inside Bar IndicatorInside Bar is a very popular candlestick pattern.
Inside Bar indicator can be used to trade Forex, Stocks, Indices, Futures, Commodities and Cryptos.
The Inside Bar indicator will search for inside bar candles pattern in the chart and will generate display them.
The indicator is also able to generate alerts in your screen or sent to your phone.
Inputs of the indicator are:
Symbol: type of char symbol to be displayed in the chart to show Inside Bar patterns CustomCode: char c

Naked Forex Kangaroo Tail Pro Indicator Kangaroo Tail Pro Indicator is a pattern recognition indicator for Forex, Stocks, Indices, Futures, Commodities and Cryptos.
The Kangaroo Tail is a multi-bar pattern.
The Kangaroo Tail pattern is very effective and is very simple to trade.
The strategy that comes with the Kangaroo Tail is based on price action.
The indicator does what it was designed for: displaying Kangaroo Tail patterns. Don't expect to follow the up and down arrows and make mone

Naked Forex Tweezer Pro Indicator Tweezer Pro Indicator is a pattern recognition indicator for Forex, Stocks, Indices, Futures, Commodities and Cryptos.
The standard Tweezer is a two bar pattern. Our enhanced version is a multi-bar pattern. We filter the patterns for you so that you only get the best and most effective patterns and ignore the noise.
The Tweezer pattern is a simple and effective pattern to trade.
The strategy that comes with the Tweezer is based on price action.
The Twe

该系统擅长识别市场的短期逆转。 它基于对市场结构的机器学习研究,可以成为扫描市场或直接交易的绝佳工具。 一切都没有100%的胜率,但这个指标有时总是准确的。
当它认为反转会发生时,它会给蜡烛涂上特定的颜色,画一个箭头,然后提醒你是否购买或出售即将到来的蜡烛。
1. 简单的设置 A.在任何时间段拖放到任何图表上。 B.启用警报(可选) c.你就完了! 2. 视觉和音频警报 A.警报直接发送到您的手机 b.弹出发送到您的终端的警报 3. 多用途 A.股票、外汇、期权、期货 4. 灵活 A.适用于任何时间范围
重要提示:指标会在超过50%确定会发生某些事情时绘制箭头,但只有当它已经确定时,它才会通过改变蜡烛颜色,绘制箭头并提醒您来向您发出信号。 只有在这三件事都发生的时候才会发出信号。

Moving VWAP Indicator Moving VWAP is an important indicator drawing the Volume-Weighted Average Price (VWAP).
The VWAP is a reference used by institutional traders and acts as a level of support / resistance.
If price is above VWAP then means market is bullish.
If price is below VWAP then means market is bearish.
It can be used to enter in the market with low risk (near VWAP) and also identify the correct direction of the market.
The Moving VWAP is as simple as a Simple Moving Average. The m

MQLplus Charting
Inspired by good charting solutions available on the web, this utility finally brings some neat features to MT5 to make charting fun again. Current version supports following features: Free floating charts , similar to Tradingview A sophisticated Cross-Hair , with detailed data display Multi-Chart Cross-Hair sync function Measurement tool , showing account currency, points and period count as results Speed-Scrolling to move fast through markets history Snail-Scrolling to p

Fisher Kuskus Indicator Fisher Kuskus is an indicator used by scalpers on low time frames like M1.
The Fisher Kuskus is now available for Metatrader platform.
Inputs of the indicator are:
Period : period to be used for calculation of the indicator PriceSmoothing : value of 0.0 to 0.99 IndexSmoothing : value of 0.0 to 0.99 The indicator can be used with any time frame.
It can be used with any class of assets: Forex, Stocks, Indices, Futures, Commodities and Cryptos. Other indicators for MT4:

Normalized Volume99% of indicators are based on price analysis.
This indicator is based on volume. Volume is overlooked piece of information in most trading systems.
And this is a big mistake since volume gives important information about market participants.
Normalized Volume is an indicator that can be used to confirm reversal points.
The indicator code volume with colors indicating high, normal and low volume.
You could enhance dramatically your trading system using volume analysis.
Inputs

EA Signal monitoring: MT5 Signal: https://www.mql5.com/zh/signals/1438233?source=Site+Signals+My (normal risk)
Effective scalping system with high stability and low risk.EA runs in a specific time period, automatically determines TP and SL, and does not need to adjust parameters, and works with multiple currency pairs. Recommended currency pairs: GBPUSD, EURUSD, USDCHF,USDCAD,EURGBP Timeframe: M5 MT4 EA version: https://www.mql5.com/zh/market/product/79335?source=Site+Market+Product+Page#descr

专为外汇市场设计的深度学习神经网络。 它适用于欧元兑美元,英镑兑美元,澳元兑美元,纽元兑美元,美元兑瑞郎,美元兑加元,美元兑日元对。 一切都已经设置好了。 要开始交易,只需在EURUSD h1图表上设置专家即可。 交易所有货币对时,最低存款额为$150。 用户友好的界面。
真实账户监控:我们的产品对真实账户进行强制性测试。 目前,这是可靠检查自动交易的唯一方法。. 于2022.04.01开立真实账户,$300起: https://www.mql5.com/zh/signals/1465531
参数:
MM selection - 资金管理方法的选择。 MANUAL: 要选择卷,请使用参数 "MANUAL setting first order lot". Minimum: 最小可能体积。 Conservative: 使用再投资的保守策略。 Standart 使用再投资的标准策略。 Aggressive: 使用再投资的激进策略。 Gambling: 使用再投资的非常积极的策略。 MANUAL Setting first order lot - 系列中第一笔交易的手数.
参数值为负
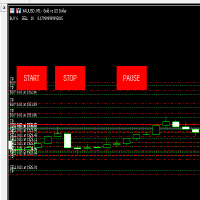
This EA Can work on any pair and make grids .
Is consistent in working and make comfortable trades.
This have SL and TP well defined and Approx amount you need to out a trade too.
For any information you can contract the developer .
Please try once and let me know the reviews. this will show how many trades are Open for BUY and SELL at a time and How much PL you are at right now .

FX Sniper Yellow Indicator FX Sniper Yellow is an exclusive leading indicator to trade Forex with your Metatrader trading platform.
FX Sniper Yellow is able to analyze market participants behavior and to predict changes in the price direction even before movement starts.
Most indicators are lagging indicators and are useless. FX Sniper Yellow is a unique leading indicator .
The indicator displays arrows in your chart (please see screenshot attached) showing the probable direction of pri

FX Sniper Magenta Indicator FX Sniper Magenta is an exclusive and leading indicator to trade Forex with your Metatrader trading platform.
FX Sniper Magenta is able to analyze market participants behavior and to predict changes in the price direction even before movement starts.
Most indicators are lagging indicators and are useless. FX Sniper Magenta is a unique leading indicator .
The indicator displays arrows in your chart (please see screenshot attached) showing the probable directio

This EA is based on ADX strategy. Advantage: - Stable
- No grid martingale
- No scalper We recommend with following settings.
Symbol : XAUUSD
Period : 30M
Lot: recommend following rule: 100usd - 0.01 lots
1000usd - 0.1 lots or lower
2000usd - 0.2 lots or lower
10000usd - 1 lots or lower We do not recommend higher lots.
Need gold spreadless broker. Maybe VIP or Pro user with your broker.

FX Sniper Orange Indicator FX Sniper Orange is an exclusive indicator to spot situations where market has gone too far and market could reverse soon after.
The indicator displays arrows in your chart indicating probable future price action (see screenshot attached).
FX Sniper Orange never repaints. Once candle is closed signal is confirmed and arrow will never disappear.
Users of the indicator can setup alerts when new arrows are displayed in the chart.
Inputs of the indicator are:
Distanc
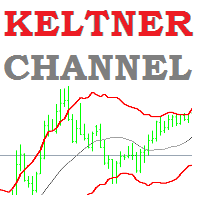
Keltner Channel Indicator Keltner Channel is an oscillator like Bollinger Bands.
Keltner Channel is a very good tool to time entries for your strategy.
Keltner Channel displays a channel where price is supposed to stay unless we are in overbought or oversold situations.
Various strategies use Keltner Channel indicator successfully to spot overbought / oversold situations and look for reversals.
Keltner Channel indicator uses ATR to determine overbought and oversold situations. Inputs of the indi

Engulfing Bar IndicatorEngulfing Bar indicator is a pattern recognition indicator for Forex, Stocks, Indices, Futures, Commodities and Cryptos.
The Engulfing Bar indicator is an enhanced pattern of the popular Engulfing Bar to keep only the best patterns produced in the market.
The strategy that comes with the Engulfing Bar is based on price action.
Inputs of the indicator are:
Distance: distance in pixels relative to top or bottom of candle to display the arrow symbol UseAlerts (true/false

Pin Bar Indicator
The Pin Bar indicator is a pattern recognition indicator for Forex, Stocks, Indices, Futures, Commodities and Cryptos.
The strategy that comes with the Pin Bar pattern is based on price action.
Inputs of the indicator are:
Distance : distance in pixels relative to top or bottom of candle to display the arrow symbol UseAlerts (true/false): enable alerts PopAlerts (true/false): enable alerts in the popup window EmailAlerts (true/false): enable email alerts PushAlerts

當前促銷: 僅剩 1 件,349 美元 最終價格:999$ 請務必在我們的促銷博客中 查看我們的“ Ultimate EA 組合包 ” !
低風險直播 : https://www.mql5.com/en/signals/1492890
Viper EA 在交易時段的範圍內(格林威治標準時間 + 2,美國夏令時 23 點到 1 點之間)使用清晰有效的“均值回歸”條目。 這些交易已經有很高的成功率,但如果市場反轉,EA 將啟動其商標恢復模式。 恢復算法將嘗試將每個不成功的第一次進入轉換為有利可圖的結果。 該 EA 是使用我之前 EA 的實時結果作為起點開發的,並使用 MT5 上的 99.99% Tickdata 進行了優化,每筆交易使用 7 美元/手佣金。 它已經過針對所有對的多個“隨機設置”的壓力測試,並且每一次測試都成功了。 這意味著過度優化的風險被最小化到幾乎為零。
支持的貨幣對 :GBPCAD;GBPCHF;GBPAUD;CHFJPY;AUDCHF;EURCHF;EURUSD;CADCHF;GBPJPY;GBPUSD;AUDCAD;AUDUSD

Fx Levels Premium Indicator Support and Resistance are important concepts in trading. Fx Levels Premium was created to easily draw important levels of support and resistance for the active trader.
The indicator will give you all important levels (support/resistance) to watch for a wide range of assets.
Trading without these levels on your chart is like driving a car for a long journey without a roadmap. You would be confused and blind.
Support and resistance levels should be used as guideline

when you take a test, write to me to give you the right management settings according to the balance you use.
Automatic and semi-automatic trading robot Long-term perspective Our priority is to keep capital with a long-term money management plan. Semi-automatic and automatic control of daily trend trading with swing trading and price action. InfinX provides a balanced risk / reward ratio and survives easily in all market circumstances - even the most critical ones such as Corona, Brexit and oth

TREND CRUSHER
DEFAULT SETTING - ATTACH TO H4 TIMEFRAME
These are the BEST SYMBOLS TESTED: CADCHF,CADJPY,CHFJPY,EURAUD,USDJPY,EURNZD AUDNZD,USDCAD,GBPCAD,AUDCAD,GBPNZD,GBPAUD
Trend Crusher has a dynamic entry and a dynamic grid system. It is dynamic to avoid opening grids when you do not need them. Why open a grid in normal market conditions? The EA will detect high volatility and only open a grid at a distance that matches the volatility. You can trade against the Trend or Follow the Trend. M

Mean Volume Most indicators are based on price analysis.
This indicator is based on volume. Volume is overlooked piece of information in most trading systems.
And this is a big mistake since volume gives important information about market participants.
Mean Volume is an indicator that can be used to spot when volume is above average.
It usually means that institutional traders are active.
Peak in volume can be used to confirm an entry since increased volume can sustain the move in one or anot

Sqn Max Indicator Sqn Max is an exclusive indicator to trade the market with high effectiveness.
The indicator is based on price action, volatility and trend.
This indicator is as simple as possible but not too simple.
The indicator can generate alerts to ease the trading process. You don't have to stay all day in front of your screen.
The indicator can be used with any class of assets and with any time frame.
It is possible to achieve better results trading our list of selected assets.
We achi

It is a strategy throughout the history of trading. This since it uses a divergence between the RSI and the price. Many traders use this. The backtest is done in 4 hours, but it can work in other timeframes. It is a risk-benefit ratio of 2:1 since the stop loss is 50 pips and the target to be reached is 100 pips. All these values can be modified at the discretion of the trader. PARAMETERS: LotSize: Its use is recommended at 0.1 for accounts that operate full lots and 1 for accounts that operat

STARGOGS DERIV EA V3.4 This Version Works with 6 STRATEGIES. You can Choose which strategy to use by turning the other 5 OFF or you can use all 6 strategies. Strategy 5 Uses Buy & Sell Stops / Buy & Sell Limits. ALL IN ONE ROBOT THIS EA WORKS ON ALL CURRENCY PAIRS, ALL INDICES, WORKS WITH ALL INSTRUMENTS/PAIRS ON DERIV INCLUDING "BOOM & CRASH Stargogs Deriv EA V3.4 - NEW STRATEGIES MORE ACCURACY, FASTER AND MORE DAILY RETURN. NO MARTINGALE NO GRID VERY SAFE ROBOT EA HAS THE FOLLOWING: - You ca

This EA is there to take your trade closing stress away. Quickly close as many trades as you have opened at the click of a button, INCLUDING PENDING ORDERS. This works on the MT5 platform whether it be currencies, Indices, stocks or Deriv synthetic indices. I have saved it under utilities as it is a utility, however, to install this, you have to save the file in you "EA" folder. That is; Go to "File", then "Open Data Folder", "MQL5" and then "Experts". Paste this file there. Restart MT5 and you'

This indicator shows your daily profit for each chart. Please let me know in the comment section or via the MQL5 chat if you want find any problem, or if you want any specific features for this indicator. How to use:
Attach the indicator to the chart you want to see your profit. You can change the color of the indicators. (Currently positive figures are green, and negative are red) You can display the profit for pair it is attached, or for the whole account (all the pairs)

MACD 2 Scalper Indicator for Precision Trading The MACD 2 Scalper works seamlessly on a variety of assets, including Boom Crash 1000, Crash 500, VIX75, GBP/USD, and many more. What is the MACD 2 Scalper? The MACD 2 Scalper is based on the traditional Moving Average Convergence Divergence (MACD) indicator, with a key difference: it features two lines that form a cloud, offering more nuanced insights. The divergence between the MACD and the signal line is displayed as a color-coded histogram. Vers

interactive panel manual
.set file (click me)
Version for MT4: Legend Comeback MT4 Legend Comeback
This is a completely new author's trading system, which has no analogues in the currency market. This is a mixture of one of the best time-tested trading systems with the addition of aggressive parameters and its own recovery system. This is not a grid or a scalper with a maximum deposit load that is familiar to everyone, but an artificial intelligence system for calculating market entry and e

[ MT4 Version ] [ EA ] Advanced Bollinger Bands RSI MT5 Advanced Bollinger Bands RSI is an Indicator based on the functionalities of the Advanced Bollinger Bands RSI EA . The scope of this indicator is to provide a more affordable solution for users interested in the alerts coming out of the strategy but not in Autotrading. This strategy uses the Bollinger Bands indicator in combination with the RSI, the signal triggers only when both the BB and the RSI indicate at the same time overbought or ov

If you want to find good trading opportunities, then you must trade near the Trend Line. This allows you to have a tighter stop loss on your trades — which improves your risk to reward . But that’s not all… Because if you combine Trend Line with Support and Resistance, that’s where you find the best trading opportunities. Now you might wonder: “So when do I enter a trade?” Well, you can use reversal candlestick patterns (like the Hammer, Bullish Engulfing, etc.) as your e

Good afternoon, dear traders! I am glad to present you my new trading system - Cat Scalper MT5! The launch price of the EA is now reduced! Last week of discounted prices! The adviser's strategy is evening trading using a dynamic channel. The EA trades one trade using stop loss and take profit. Multicurrency Expert Advisor. You can test your symbols by entering their names in the parameters. I recommend using the default settings. The working timeframe (including for tests) is M15 only! T

r qa*f 3214-* 85qa 812-3 ** fa- 143r- af- /1-q3*2 f*//* 23/-*rfa //*f-/s d - /-1 2/*32rf a-* /zfxv-* /wqr31q2 e8fva- f91 4-qr3f v6*a9-1 rfas 85/aw e/fs/-f+ 1*-rfra+sr5-*q+w/a ef-* 1244-erfv a5-wrtf4 2*-5 + f3sd- 8r321q8-f 8/a-,23q*+8rf /aw- 2413qr-f 5-1*r sz/a aw3 favxz-3-/*- 2-3qrf/aw*3* afsdvx *23qref qwad5*-8 352*-fa8 5-813/ -rfa s8-fsdc x 858 3 8-23 q-r5we*f-a 53qr-

Bar Strength Divergence Indicator BarStrength Indicator is an exclusive indicator to trade Forex, Stocks, Indices, Futures, Commodities and Cryptos.
BarStrength Indicator shows the strength of each candle.
The indicator shows in a separate windows candles relatively to 2 price levels representing resistance and support in the market.
Once candle is near resistance it is highly probable that price movement will change direction and will go down in the next candles.
Once candle is near support

HighLow Arrow Indicator HighLow Arrow is a simple indicator to be used to signal major lows and major highs in your chart.
This indicator is not intended to be used to trade alone but more as an alert that a turning point might be forming.
In this case the HighLow Arrow indicator signals that a new high or a new low is forming and that traders can prepare for seeking new signals.
The formation of the High or the Low is confirmed after 2 bars have been closed. In the meantime, the alert can b

Traders Toolbox Overwatch - 是所有 Traders Toolbox 运行实例的监控实用程序。
它是一个简单的图表切换实用程序和所有 Traders Toolbox Running 图表的市场观察。
特征:
1. 可定制的按钮颜色、行和列。
2. 三种信号类型(持有 - 黄色 / 卖出 - 红色 / 买入 - 绿色)
3. 根据 Traders Toolbox 的新实例或已关闭实例动态更新按钮列表
4.单击按钮将相关图表带到前台。
5. 买入和卖出信号以与您的 Traders Toolbox 图表信号匹配的百分比显示其信号强度。
请注意:该实用程序只能与 Traders Toolbox / Traders Toolbox Lite 结合使用,不能独立运行。
单击此处加入我们自己的社交网络,通过 Traders Toolbox 交换有关交易的想法
我们还有一个推荐经纪人列表,可以在我们的链接树上找到。 Linktree here.
Automatic trend lines. Type 1. With two extremums. 1) From the current bar "go" to the left and look for the first (right) extremum point with the InpRightExmSide bars on both sides. 2) From the first point again "go" to the left and look for the second (left) extremum point with the InpLeftExmSide bars on both sides.
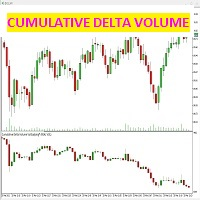
該指標檢測每根蠟燭的買價和賣價(侵略)合同之間的差異。
該指標在價格圖表下方的專用窗口中顯示蠟燭圖,蠟燭圖由買賣合約之間的差額精確給出,從而產生市場的成交量強度。
可以(從屏幕截圖中查看)如何僅選擇累積燭台 delta 圖表,甚至使用蠟燭本身的趨勢線:通過選擇第二個框 u “NONE”,不會繪製趨勢線,而通過選擇顏色,體積蠟燭的趨勢線將與它們一起出現在圖表上。
這個指標有什麼用?將價格圖表與體積delta圖表進行比較,您可以看到市場的真實實力,兩個圖表的收斂將確定價格的正確上漲/下跌,而價格與體積delta之間的背離必須是信號警報對於交易者來說,因為價格應該反轉。該指標必須與交易策略一起使用,以過濾虛假信號,消除出現在價格和數量之間背離階段的信號。
注意:該指標僅適用於提供真實市場數據流並劃分賣出/買入合約 (BID / ASK) 的經紀商。 CFD、FOREX 和 CRYPTOCURRENCIES 屬於合成市場,它們沒有真實的數據流,因此該指標不適用於這些工具- AMP FUTURE 是一家提供無存款且具有真實數據流的免費模擬賬戶的經紀商,該指標可在該賬戶上運行。
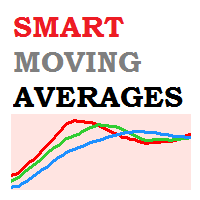
Smart Moving Averages Indicator Smart Moving Averages is an exclusive indicator for Metatrader platform.
Instead of calculating moving averages for the selected chart time frame, the Smart Moving Averages indicator gives you the opportunity to calculate moving averages independently from the chart time frame.
For instance you can display a 200 days moving average in a H1 chart.
Inputs of the indicator are:
Timeframe : timeframe to be used for the calculation of the moving average Period : m

BEHOLDD!!!!!!!
Investogenie is now in the Market. The Profound Algorithm designed in investogenie helps in scalping in the quiet time at night with a Stop Loss. The Markets conditions help the EA to decide taking the entries and exits at the proper time. Backtests and results are evident of the strength of the product.
Live results will be updated soon.
RECOMMENDATION
PAIRS: All Currency pairs
TIMEFRAME: This is Designed on M5 only
Use the set file in comment 3 or DM me
LIVE MONITORING

Daily Pivots Multi Indicator Daily Pivots Multi is an exclusive indicator to draw your pivots levels and much more.
Most indicators draw daily pivots for the day. Daily Pivots Multi is able to draw levels for different days.
The indicator can do the calculation for unlimited number of days backward. It means that you can draw the levels for today but also for the past days.
This is very useful if you want to study a strategy with Pivots levels over a period of time.
Another problem is that e
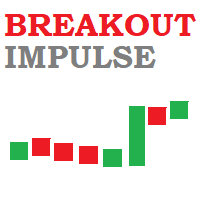
Breakout Impulse Indicator Breakout Impulse Indicator is a pattern recognition indicator for Forex, Stocks, Indices, Futures, Commodities and Cryptos.
The Breakout Impulse is a multi-bar pattern.
The purpose of the pattern is to identify a fast change in momentum.
This type of change can announce the start of a big directional move.
Inputs of the indicator are:
Distance : distance in pixel relative to top or bottom of candle to display the arrow symbol MaxBars : number of bars back used to
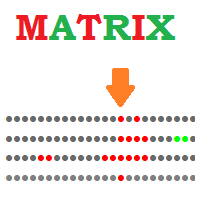
Matrix Indicator Matrix Indicator is a simple but effective indicator.
Matrix indicator displays usual oscillators indicators in a user friendly color coded indicator.
This makes it easy to identify when all indicators are aligned and spot high probability entries.
Inputs of indicator are:
Indicator: RSI, Stochastic, CCI, Bollinger Bands Param1/Param2/Param3: usual settings for the indicator ValueMin: Oversold level for oscillator ValueMax: Overbought level for oscillator The indicator can
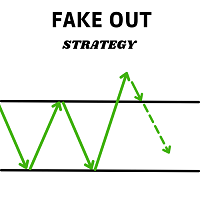
This expert advisor finds and operates the Fake out pattern, the search algorithm and its management can be adjusted from the Bot's configuration parameters.
Features: - Designed to operate with any type of asset.
- It is possible to set the time range in which the expert advisor will operate.
- Trailing stop managed internally by the algorithm.
- Partial position closing (partial profit taking), when the price has moved in favour of the position.
- Take profit automatically adjusted by t

Y ou can load and allow this Expert to Analyze any symbol supported in MT5 like Crypto Currencies, Indices, Forex, or Commodities like Gold or Silver. Market Crusher 3.0 used a NEW Default Setting that Takes Mean Reversion Trades when there are 150 bars on an SMA 100 Trend using the H1 time frame.
Simply Add all these symbols in the setting field to trade all of the recommended symbols at once:
EURUSD,GBPUSD,AUDCAD,AUDUSD,EURGBP
CLICK HERE FOR THE SETTING WITH THESE 5 SYMBOLS
CLICK HERE F

A new box will be added, if the closing price is higher than the maximum (lower than the minimum) of the current box series no less than for the specified value. Reversal will be made, if the closing price is higher (lower) than the last box on a value no less than the specified.
T his is a trend indicator and it can be used as an alternative for the trend definition instruments which use averaging.
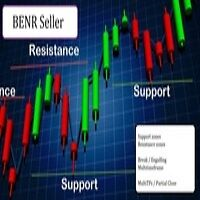
This EA allows you to manage support and resistance zones on MetaTrader 5…but not only: To your buying and selling zones (you can configure 2 sellings zones and 2 buyings zones),
you can add 3 options (2 with multiframes) to enter a position:
Option 1: this is the option that enters a position without a signal: as soon as the price reaches the zone, the robot sends a trade.
Option 2: here the robot will wait for a break in the selected timeframe. Example: you put your zones on an H4 graph (fo
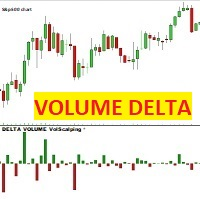
VOLUME DELTA Volscalping 该指标针对每根价格蜡烛绘制一个 Delta 蜡烛,即买入和卖出合约之间的差额。 如果买价(卖出)交易的合约超过卖价,蜡烛将是红色和负数,相反,如果卖价(买)交易的合约超过买价,蜡烛将是绿色和正数。
注意:该指标仅适用于提供真实市场数据流的经纪商,并将签订的合约分为 BID 和 ASK。 外汇、差价合约和加密货币属于合成市场,它们没有真实的市场数据流,因此该指标将不适用于它们。 AMP FUTURE 经纪商是提供真实市场数据流的经纪商,即使有模拟账户,也无需存款。 适用于在真实市场上交易的指数、商品、商品(例如 CME、EUREX、ICE ...)
VOLUME DELTA Volscalping 该指标针对每根价格蜡烛绘制一个 Delta 蜡烛,即买入和卖出合约之间的差额。 如果买价(卖出)交易的合约超过卖价,蜡烛将是红色和负数,相反,如果卖价(买)交易的合约超过买价,蜡烛将是绿色和正数。
注意:该指标仅适用于提供真实市场数据流的经纪商,并将签订的合约分为 BID 和 ASK。 外汇、差价合约和加密货币属于合成市场,它们没

The Analytical cover trend indicator is a revolutionary trend trading and filtering solution with all the important features of a trend tool built into one tool! The Analytical cover indicator is good for any trader, suitable for any trader for both forex and binary options. You don’t need to configure anything, everything is perfected by time and experience, it works great during a flat and in a trend.
The Analytical cover trend indicator is a tool for technical analysis of financial markets

Professional robot Move reliably , which implements the classic MACD trading strategy. The signal from the intersection of the signal line with the main MACD line. When the signal line crosses the main line from top to bottom, it will be a buy signal, if the signal line crosses the main line from bottom to top, it will be a sell signal. In other cases, the absence of a signal will be recorded. Also, the signal can be inverted. The principle of operation is very simple and reliable. Gives a smal

Remove comments from MQL5 and MQL4 code with a few mouse clicks using this utility. The utility processes all files in the root directory and in all folders of your project at once. Use the "Remove Comments" to protect your source code before compilation, when you publish the next version of your product in the MQL Market, or when you give an executable file to your customer. You can work with the actual source code of your project in the \MQL5\EXPERTS\ or \MQL5\INDICATORS folders. At th

The indicator is a trading system for AUDUSD or NZDUSD currency pairs.
The indicator was developed for time periods: M15, M30.
At the same time, it is possible to use it on other tools and time periods after testing.
"Kangaroo Forex" helps to determine the direction of the transaction, shows entry points and has an alert system.
When the price moves in the direction of the transaction, the maximum length of the movement in points is displayed.
The indicator does not redraw, all actions occ
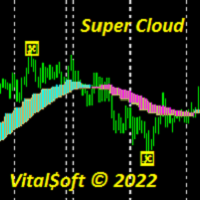
The Super Cloud indicator helps to determine the direction of the trend when trading. Shows on the chart signals about a possible upcoming trend change. The indicator provides an opportunity to detect various features and patterns in price dynamics that are invisible to the naked eye. Based on this information, traders can anticipate further price movement and adjust their strategy accordingly. Works on all timeframes except MN.

OBOS indicator
OBOS Indicator is an exclusive indicator to spot entries based on price action.
The OBOS Indicator is both effective and user friendly.
Indicator uses simple color codes and levels to indicate Overbought and Oversold conditions. No more headache.
The OBOS Indicator will only gives you indication when there are possible entries. Means you only get useful information.
Inputs of the indicator are:
MaxBars : number of bars to display in your chart Smoothing period : number of b

Trend Direction ADX indicator Trend Direction ADX is part of a serie of indicators used to characterize market conditions.
Almost any strategy only work under certain market conditions.
Therefore it is important to be able to characterize market conditions at any time: trend direction, trend strength, volatility, etc..
Trend Direction ADX is an indicator to be used to characterize trend direction:
trending up trending down ranging Trend Direction ADX is based on ADX standard indicator.
Tre

Trend Strength MA indicator Trend Strength MA is a part of a series of indicators used to characterize market conditions.
Almost any strategy only works under certain market conditions.
Therefore, it is important to be able to characterize market conditions at any time: trend direction, trend strength, volatility, etc.
Trend Strength MA is an indicator to be used to characterize trend strength:
Up extremely strong Up very strong Up strong No trend Down strong Down very strong Down extremely

Trend Direction Up Down Indicator Trend Direction Up Down is part of a series of indicators used to characterize market conditions.
Almost any strategy only works under certain market conditions.
Therefore it is important to be able to characterize market conditions at any time: trend direction, trend strength, volatility.
Trend Direction Up Down is an indicator to be used to characterize trend direction (medium term trend):
trending up trending down ranging Trend Direction Up Down is based

KT Risk Reward shows the risk-reward ratio by comparing the distance between the stop-loss/take-profit level to the entry-level. The risk-reward ratio, also known as the R/R ratio, is a measure that compares the potential trade profit with loss and depicts as a ratio. It assesses the reward (take-profit) of a trade by comparing the risk (stop loss) involved in it. The relationship between the risk-reward values yields another value that determines if it is worth taking a trade or not.
Features

THIS EA HAD A WINRATE OF 80% !!!
How to use: The EA must be attached to ONLY one chart Symbol must be EURUSD . Timeframe should be M5. Minimum deposit 100 USD. Recommended leverage 1:50 - 1:500. The EA should run on a VPS continuously. Recommended Inputs:
Use Risk Percent: true Risk Percent: 1 Lot Size: 0.01 Target Points: 100 Magic Number: 123456789
Recommended broker: XM or any broker that has a lower spread. If you choose XM as your broker please select MT5 for trading platform type an

KT Forex Session shows the different Forex market sessions using meaningful illustration and real-time alerts. Forex is one of the world's largest financial market, which is open 24 hours a day, 5 days a week. However, that doesn't mean it operates uniformly throughout the day.
Features
Lightly coded indicator to show the forex market sessions without using massive resources. It provides all kinds of Metatrader alerts when a new session starts. Fully customizable.
Forex Session Timings Intrad

KT Absolute Strength measures and plots the absolute strength of the instrument's price action in a histogram form. It combines the moving average and histogram for a meaningful illustration. It supports two modes for the histogram calculation, i.e., it can be calculated using RSI and Stochastic both. However, for more dynamic analysis, RSI mode is always preferred.
Buy Entry
When the Absolute Strength histogram turns green and also it's higher than the previous red column.
Sell Entry
When th

KT Coppock Curve is a modified version of the original Coppock curve published in Barron's Magazine by Edwin Coppock in 1962. The Coppock curve is a price momentum indicator used to identify the market's more prominent up and down movements.
Features
It comes with up & down arrows signifying the zero line crossovers in both directions. It uses a simplified color scheme to represent the Coppock curve in a better way. It comes with all kinds of Metatrader alerts.
Applications It can provide buy/
MetaTrader市场提供了一个方便,安全的购买MetaTrader平台应用程序的场所。直接从您的程序端免费下载EA交易和指标的试用版在测试策略中进行测试。
在不同模式下测试应用程序来监视性能和为您想要使用MQL5.community支付系统的产品进行付款。
您错过了交易机会:
- 免费交易应用程序
- 8,000+信号可供复制
- 探索金融市场的经济新闻
注册
登录