适用于MetaTrader 5的EA交易和指标 - 109

这个多时间框架和多品种指标扫描吞没和镊子形态。结合您自己的规则和技术,该指标将允许您创建(或增强)您自己的强大系统。 特征 可以同时监控您的市场报价窗口中可见的所有交易品种。将该指标仅应用于一张图表,并立即监控整个市场。 监控从 M1 到 MN 的每个时间范围,并在识别出吞没或镊子形成时向您发送实时警报。支持所有 Metatrader 原生警报类型。 使用 RSI 作为趋势过滤器,以正确识别潜在的逆转。 该指示器包括一个交互式面板。请参阅单独的屏幕截图。 可以配置为显示买入/卖出线和 TP/SL 线(基于 ATR 乘数)。这些线将显示在您通过单击面板中的信号打开的图表上。请看下面的截图。
该指标可以将信号写入一个文件,EA 可以使用该文件进行自动交易。
输入参数
输入参数的描述和解释可以在 这里 找到。 重要的
我强烈建议将指标放在干净(空)的图表上,上面没有任何其他可能干扰扫描仪的指标。请注意,由于具有多功能性,既不会在安装指标的图表上绘制买入/卖出建议,也不会绘制线条和箭头。它们将绘制在图表上,该图表将在单击面板中的信号时打开。

The Market Time indicator shows in a simple and objective way the opening hours of the main exchanges in the world. Define the number of days to be displayed and choose the options available for the appearance of each vertical line of each market in the indicator. With this Market Hour indicator you will be able to see the opening hours of the main markets in the world more easily and quickly. Note that the opening time of each market to be inserted in the indicator is the time of your broker's

This EA works on the basis of channels formed by price. It trades from the boundaries of these channels (for example, when the price breaks through the border of the channel, or when it touches and comes back). It can also display the lines and channels through which it trades. They are built on the highs and lows of prices. The EA has customizable parameters for trading on multiple channels and uses some indicators to improve trading (for example, Stochastic or ADX). It also has parameters for

Great dashboard for market analytics. The panel helps analyze the values of the Bollinger Bands indicator and prices.
Using this panel you can: watch the current signal from the Bollinger Bands for all time frames; watch the current signal with the Bollinger Bands for different characters; look at how far the Bollinger Bands is from the price; look at how much the Bollinger Bands value has changed; several types of signals for analytics. Value of cell: Bollinger Bands main line; Bollinger

Great dashboard for market analytics. The panel helps to analyze the values of the Envelopes indicator and prices.
Using this panel you can: watch the current signal from Envelopes for all time frames; watch the current signal from Envelopes by different symbols; look at how far Envelopes is from the price; look at how much the value of Envelopes has changed; several types of signals for analytics.
Values in the table cell: Envelopes value upper line; Envelopes value lower line;
"the cor

the indicator will show signal arrows on the graph at the crossing of a given level it has push and audible alerts. By crossing from low to high level 0.3, a blue arrow will come out for the purchase, at the same time an audible signal will sound. By crossing from low to high level 0.7, a red arrow will come out for the sale, at the same time an audible signal will sound. Possibility to deactivate push and audible alerts. MT4 version of this product here
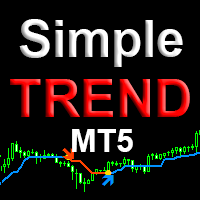
Simple trend mt5 is a professional version of the trend indicator and entry points. It uses Price action and a unique filtering algorithm to determine the trend. Shows the change in the direction of price movement on any currency pairs, without redrawing the result. Suitable for determining entry points for scalping and swing, as well as for intraday, medium-term trading. Features Marks trend reversal locations and directions. Suitable for all types of trading, in any markets. Allows you to en

The Trend Mix indicator reliably monitors the market trend, ignoring sharp market fluctuations and noise around the average price. This is a promising arrow indicator. He catches the trend and shows favorable moments of entering the market with arrows. The indicator can be used both for pipsing on small periods, and for long-term trading. The indicator implements a kind of technical analysis based on the idea that the market is cyclical in nature.

The Tik Tok indicator was created on the basis of the original extreme search indicators, the indicator is well suited for determining a reversal or a big sharp jerk in one direction, thanks to it you will know when this happens it will notify you when a blue dot for buying red for sale appears.
It basically uses the process of detecting the rate of change in price growth and allows you to find entry and exit points from the market. fundamental technical indicator that allows you to assess the

Mr. Averager MT5 is a Expert Advisor for the MetaTrader 5 trading terminal. The trading algorithm is based on the principle of position averaging. Due to averaging, the EA is not sensitive to the quality of entry points and can work almost at any time and in almost any market. The EA supports 2 trading modes: Automatic start and Manual start. In Automatic start mode, the EA independently starts a new series of orders. In Manual start mode, the first order of the series is opened manually using

Future of Ea:
We make this Ea on scalping strategy for short term trend. Ea is able to works on any Currency pair and any time chart frames but profits and risk are depends on time chart.We provide you full support to setup ea on his best time chart according to currency pair. Contact us by sending massage in mql5 chat for Ea setups. We also stored our set files in comment area for easy use for you.This Ea's Mt4 version is also available in Mt4 expert area. Using of Ea: Indicator settings is ou

SYSTEM INTRODUCTION: The Binary Options Conqueror System Is Specifically Designed For Binary Options Trading. Unlike Other Systems And Indicators That Were Adopted From Other Trading Environments For Binary Options. Little Wonder Why Many Of Such Systems Fail To Make Money . Many End Up Loosing Money For Their Users. Forward Testing Of The System Has Shown Remarkable Results . The Results Of Forward Testing On Live Trading Account Is Consistent With The Results Obtained By Back Testing .
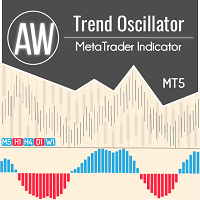
具有高级过滤系统的趋势振荡器。它决定了趋势,它的减弱和增强。有一个内置的多时间框架面板。 AW 趋势振荡器适用于任何时间框架和任何符号(货币、指数、石油、金属、股票)。 MT4 版本 -> 这里 / 问题解决 -> 这里 特点和优点:
高级趋势过滤 一键更改指标的灵敏度 易于设置 多时间框架面板 能够移动和最小化面板 适用于任何符号和任何时间范围。 各种通知 输入设置: . 指标周期 - 指标周期,数值越大,指标信号的敏感度越低,
. 发送推送通知 - 使用移动版交易者终端的新信号通知,
. 发送弹出警报 - 在警报时使用声音通知,
. 发送电子邮件 - 使用向交易者的电子邮件发送有关信号外观的电子邮件,
. 显示多时间帧面板 - 启用面板显示,
. 多时间框架仪表板 - 面板视图,最小化或完整,
. 面板中的字体大小 - 指示器面板上的文本大小,
. Up color main - 上涨趋势加强时的颜色,
. Up color second - 上升趋势减速时的颜色,
. Down color main - 下跌趋势加强时的颜色,
. Down color second

ichimoku indicator with alert; audible alert, email alert, push alert you can enable or disable the settings as you wish When there is a crossing of tenkansen and kijun you will get an alert When there is a cross between Senkouspan A and Senkouspan B you will get an alert Affordable sound settings possibility to modify the parameters of the ichimoku indicator

The Trend Rendezvous indicator searches for and displays pivot points on the price chart. The goal, which was pursued during its creation, is to obtain signals that will produce less noise and respond more quickly to price changes. The Trend Rendezvous indicator is a trend indicator that is used to search for reversals in the breakdown of its borders. The indicator is its signal and has one interesting property. It is necessary to take into account that this indicator reflects extrema and shoul

The implementation of the Trend Self trend indicator is simple - in the form of two-color lines. The indicator will help users determine the direction of the trend. It will also become an indispensable adviser for entering the market or for closing a position. The indicator algorithm is based on standard indicators as well as their own mathematical calculations.
How to read information from the indicator. We buy when the color of the indicator line changes from pink to green. Hold a long p

60% Discount General description; This EA is made to be used in the Gold market. It's made for trading Gold in mind. This Trading Robot is based on more than 14 years of winning patterns and will open trades by the minute, 24 hours a day. It will handle everything, from opening positions, closing them, managing risk.
Features;
- Timeframe-Less Expert Advisor that works by the second and recalculate everything with whichever situation that might exist. - Dynamic market watcher that adjust itse

该指标旨在衡量给定移动平均线与价格的距离。
该指标除显示间距值外,还有间距本身的平均值,以辅助和确认分析。平均值的类型和计算间距值的平均值以及间距平均值都是可以参数化的。
啟用選項“設置自動水平和顯示信號”後,指標將在圖表上顯示買入和賣出信號。當價格與平均值的偏差大於指標中確定的水平時,出現買入和賣出信號。 注意:該級別是動態插入到指標中的,也就是說,如果發生新的偏差而修改了資產的特徵,則會對其進行修改。圖表上僅顯示在指標水平上一次更改之後發生的買入和賣出信號。
设置。
主要移动平均线周期 (用于计算距离) 移动媒体类型(简单、指数) 距离移动平均周期
注:为了更好地显示高距离电平,建议在指示灯中插入电平。
........................................................................................................................................................

Hi, welcome here!
OK, the logo is not professional, but I have only few things to say... ... TRY IT! The demo is free to use and you can try this EA on historical data to see that it never loses if you have enough starting equity. It's designed for EURUSD currencypair working in MINUTE 15 as it's always between 0.8 and 1.50. It uses a modified Martingale with the use of some indicators for the first order. More than 800 lines of code at only $49,00 for the first 50 activations..
In the next u

Due to the fact that at each separate period of time, trading and exchange platforms from different parts of the planet are connected to the trading process, the Forex market operates around the clock. Depending on which continent trading activity takes place during a certain period, the entire daily routine is divided into several trading sessions.
There are 4 main trading sessions: Pacific. European. American Asian This indicator allows you to see the session on the price chart. You can also

this indicator is a Spike detector indicator, it is specially designed to trade Boom 1000, Boom 500, Crash 1000 and Crash 500 We recommend using it on Deriv Boom and Crash indices only Its setting is intuitive, familiar, easy to use it has notification functions; audible notifications and push notifications. this tool is simple to use, easy to handle This update is based on different strategies for spikes

AnaliTickEA is an advisor for the Metatrader 5 platform. Together with the utility AnaliTick is a complete system for analysis, testing and automated trading based on impulse searches. Impulse in this text refers to such a sequence of quotes (ticks), which has a pronounced tendency to move prices to increase or decrease. The magnitude of the impulse is the maximum price change (in points). Based on the analysis of tick sequences with AnaliTick , the user determines the requirements for the input

FOREX 顧問 HERO 使用網格策略(根據趨勢運動開倉)和金字塔(根據趨勢開倉)。 EA 僅適用於市價訂單。第一筆交易的開倉發生在指定時間內的極值崩潰時,其中集中了 N 個限價訂單(價格已多次測試該水平)。如果價格突破水平但 N 品脫在 N 秒內沒有通過,則該信號被認為是錯誤的。
MT4 版本 - https://www.mql5.com/en/market/product/52194
它具有方便的資金管理、每個 N 餘額的初始手數以及網格和訂單金字塔的乘數。圖形顯示信息,易於配置和優化。
工作時間框架在 EA 參數中設置,默認為 H1,EURUSD 符號。以下貨幣對適合顧問:GBPUSD、USDCAD、EURUSD、USDJPY、USDCHF、AUDUSD、NZDUSD ...
選項:
TIMEFRAME - 工作時間框架; EXTREMUM_BARS, SHIFT - 搜索極值和移動的柱數; MAX_RANGE - 最大價格範圍; MIN_BARS_IN_RANGE - 範圍內高/低的最小數量; MIN_DISTANCE, TIMER_SEC - 以秒為單位的最小距

Bonnitta EA 基于挂单策略 (PPS) 和非常先进的秘密交易算法。 Bonnitta EA 的策略是秘密自定义指标、趋势线、支撑和阻力位(价格行动)和上述最重要的秘密交易算法的组合。
不要在没有超过 3 个月的任何真实货币测试的情况下购买 EA,我花了超过 100 周(超过 2 年)在真实货币上测试 BONNITTA EA 并在下面的链接中查看结果。 BONNITTA EA 由爱和力量组成。 仅适用于少数买家,这是盗版算法的价格和实施的原因。
Bonnitta EA 在 22 年的时间内使用质量为 99.9% 的真实报价成功通过了压力测试,滑点和佣金接近真实市场条件。 Expert Advisor包含统计采集和滑点控制的算法,具有完整的统计控制; 此信息用于保护您免受经纪人的欺骗。 Bonnitta EA 在下订单之前控制经纪人执行的质量,它还成功地通过了历史数据和不同数据馈送的蒙特卡罗模拟方面的严格标准。
结果
策略测试器的 Expert Advisor 结果:初始存款为 1000 美元的 Bonnitta EA 在 2020 年 1 月 1 日至 2021 年

TrendSentry is a trend following EA, featuring key pre-checks to opening a trade such as: - Triple level exponential moving average trend validation - MACD indicator trend confirmation - Trend reversal trade opening option
Upcoming features: - Martingale - Adjustable risk factor - Money management code Disclaimer: - after adding the upcoming features, the price might increase to meet development costs
EA imput parameters & use instructions: double volume double take_profit double stop_loss

This Expert Advisor is a fully automated trading system on the most popular major currency pairs and is based on Moving Average and Alligator settings optimized to get the maximum return over time. Draw Down is controlled using trailing stop and each currency can have different set files. A Large number of inputs and settings are tested and optimized and embedded in the program hence making inputs options very simple and easy to understand.
SET FILES ARE ADDED TO THE COMMENT #1 OFFER until 3

Buy and sell signals based on Larry Williams's exponential moving average strategy Setup 9.2 for trend continuation.
How does it work? The indicator activates the buy signal when a candle closes below the previous low while maintaining the 9 period EMA's upwards. For a sell signal, we need a candle closing above the previous high while maintaining the 9 period EMA's downwards.
How to use it? One way of using it, proposed by Larry Williams, is to enter a trade with a buy stop order one tick

Buy and sell signals based on Larry Williams's exponential moving average strategy 9.3 for trend continuation.
Who is he? Larry Williams is an American stock and commodity trader, author of 11 books and creator of indicators such as the "Williams%R" and the "Ultimate Oscillator", with over 60 years of trading experience. Won the 1987 World Cup Championship of Futures Trading, turning $10,000 to over $1,100,000 in 12 months with real money. Ten years later, his daughter Michelle Williams won th
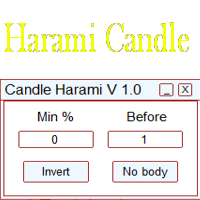
Это простой индикатор, показывающий формирование свечей харами. Входные параметры:
Min % - минимальный процент харами Before - количество свечей до сигнала Invert - инвертировать сигналы No Body - свечи без тела Length - настройка для отображения сигналов В индикаторе есть встроенный фильтр по количеству свечей до сигнала и минимальному проценту харами. Более подробно о настройках индикатора можно прочитать на моем сайте.

Buy and sell signals based on Larry Williams's exponential moving average strategy 9.4 for failed reversals and trend continuation.
How does it work?
For an uptrend, we need a candle turning the 9 period EMA down and closing below it, followed by a candle turning the 9 period EMA up and closing above it, with a low higher than the previous candle's low. For a downtrend, we need a candle turning the 9 period EMA up and closing above it, followed by a candle turning the 9 period EMA down and cl

このEAを使用することによりワンクリックによる決済、 決済したい通貨のチャートに適用しておけば様々な条件で自動で 決済することが可能になります。 パフォーマンスを考慮しているので動作が非常に軽いです。
新機能:Ver2.3
設定した利益以上になるとSLが建値(BE)に設定
新機能:Ver2.0
資金管理による買いや売りエントリ
トレード毎に自動スクリーンショット取得 詳細な情報はこちらにサイトがあります。
https://toushika.top/tc-panel-for-mt5/
機能:
ワンクリックによる全通貨決済
ワンクリックによる表示上の通貨決済
分かりやすいPips表示 移動可能
全通貨での合計Pips表示
自動利確、損切り設定
設定以上のスプレッドになった場合には画面の色が変化
Break Evenラインの表示
チャート画像の保存
決済の通知機能(Email,SNS)
パネル位置指定
Pips表示消去
他の通貨で設定した水平線で決済
下記に示した条件での利確
条件による決済:
条件1:利確か損切で決済
条件2:利確か損切また

Time Line for MT5
機能: 昨日高値、安値、本日始値、高値、安値の時間から線を引きます。 時間足により表示する時間が変わります。 1分、5分足では1時間ごとの表示 15分、30分足では4時間ごとの表示 1時間、4時間は12時間ごとの表示 日足以降は時間は表示されません。 高値安値は週足より下位足で表示されます。 各ラベルを変更可能になります。 更新頻度を変更できるのでチャート表示が 重くなることはありません。
各パラメータの説明:
Server_Time:6 サーバとの時間差を入力 Yesterday_High_Label:昨日高値 Yesterday_Low_Label:昨日安値 Show_Open:true 始値の線を表示するかどうか Today_Open_Label:本日始値 Today_High_Label:本日高値 Today_Low_Label:本日安値
max_bar:true 使用するバーを制限するかどうか Maxbars:1500 制限を使用した場合に1分では5日分 UpdateFrequency:60 更新頻度、ディフォルトは60秒ご
MTF-MA2 for MT5 特徴: MTF Moving Averageを8本一気に表示してくれるインジケータになります。 8本も必要ない場合にももちろん非表示にできます。
パフォーマンスを考慮しているのでチャートが重くなるようなことは 無いはずになります。どの通貨でも使用可能になります。 それぞれのMTF Moving Averageの色や太さを変更できます。
各パラメータの説明: Method:MAの種類設定をします。 Applied price:MAで使用する価格を設定をします。 TimeFrame M5:使用するMAの時間足を設定します。 Period M5:使用するMAの期間を設定します。 ※ラベルに関係なく8本のMTF MAはどの時間足でも期間設定可能になります。
Limited bar?:表示に使用するバーを制限するかどうかを設定します。 ※ここをFalseにするとすべてのバーを読み込むことになるのでチャートが重く なるかもしれません。ご注意ください。 Max bars:使用するバーの本数を設定します。過去検証をする場合にはここの値を増やしてくだ

Old Partridge knew markets which are almost as old as the Earth itself are never wrong. The legend says he knew how to beat a legion of others. This system he will to me. This system I will give to you.
Example [1] = 100 pips, profit boundary [2] = 2.0, take profit [3] = 400, stop loss [4] = 200 You buy EURUSD as 1.1440. SL will be set to 1.1420, TP will be set to 1.1480, when EURUSD = 1.1460 SL will be moved to 1.1450 EA works with the pair it is run on, [5] option allows to escort positions

Currency Strength Meter is the easiest way to identify strong and weak currencies. The indicator shows the relative strength of 8 major currencies: AUD, CAD, CHF, EUR, GBP, JPY, NZD, USD.
By default the strength value is normalised to the range from 0 to 100 for RSI algorithm: The value above 60 means strong currency; The value below 40 means weak currency;
The indicator is created and optimized for using it externally at an Expert Advisors or as a Custom Indicator inside your programs. F
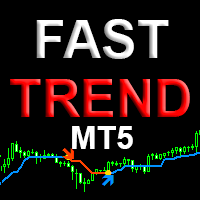
Fast trend - профессиональная версия индикатора определения направления тренда и точек входа. Индикатор с высокой вероятностью определяет направление тренда на любых валютных парах, акциях, криптовалюте без перерисовки результата. Для определения тренда использует Price action и авторский уникальный алгоритм фильтрации. Подходит для всех видов торговли, как для скальпинга так и для долгосрочной торговли. Данная версия индикатора это другая ветка эволюции алгоритма индикатора Simple Trend

ISS Station MT5 it is a Secure Automated Software for trade Forex market and indices.
The architecture is a Fully Automatic Autonomous Robot Expert capable of
independently analyzing the market and making trading decisions
ISS Station MT5 Have neurals nets to used the correct algoritm in the correct market situation
ISS Station MT5 It is an advanced trading system. This is a fully automatic Expert Advisor.
ISS Station MT5 is a plug and play system ISS Stat

Join Deriv link on profile>>>
The best time to trade Using this Indicator is when the time reach exactly hour,half,45 minutes,15 minutes and sometimes 5 minutes..
This indicators is helpful to those who trade boom and crash indecies.How to read this indicator first you'll see Blue allow and Red allow all these allows used to indicate or to detect the spike which will happen so the allow happens soon before the spike happen.This indicator works properly only in boom and crash trading thing wh

MA Jumps Expert (MT4 version https://www.mql5.com/pt/market/product/52250 ) This system uses the overall trend to trade exponential moving averages jumps that at the same time form some pattern (wick formation, engulfing). The system uses 2 exponential moving average to calculate the jumps to trade, based on the market direction. The market direction is determined by the 200 exponential moving average. This system was design to work best for EURUSD and AUDUSD on 1H timeframe and its

Dragon SuperTrend OB indicator
he Dragon was an indicator developed to capture a new beginning of the trend, it is excellent in Binary Options and Forex and even B3 in the Mini Index and Mini Dolar. It has 4 trend levels in 4 different Times Frames, so you can be sure that you are on the right side of the trend! It is very simple and easy to use, in the end I explain how we will operate with the indicator!
Confirmation modes First Line Trend Confirmations: Green Square Upward Trend. Red Squar

An algorithm to detect a spike instantly with zero lag.. Use default settings for "Crash And Boom" This smart algorithm detects a spike, which can be use to filter out market spikes, give entry signals with exit. Trading:- Booming for Boom and Crashing for Crash
Spike Signal:- The less you decrease the more signals
Multiplier:- This multiplies the Signal
Time Ratio:- For adjusting the Signal
AlertProperties = "====== Alert Properties ======";
SendAlertViaAlertWindow:- if set to true it will mak

线性回归的截距值和相对于截距值对称的平均绝对偏差的表示。
参数
•Periods:计算线性回归的周期数
•Amplitude:定义频段的绝对平均偏差的倍数
•Displacement:水平轴上的位移
•AppliedPrice:进行计算的价格
•MainPlot:显示主图
•UpperPlot:显示上限
•LowerPlot:显示较低频段
请注意,当价格处于范围内时,移动平均线只是线性回归。在这里,我们看到了线性回归相对于最常用的指标之一的优势,那就是它在价格趋势变化时以相同的方式进行调整,但在移动平均线方面没有变化。
使用建议
•与移动平均线相比超级快,因此MainPlot更好地代表了价格
•波段可以更准确地定义价格通道,不仅在范围上,而且在趋势上,这都是波动交易的理想选择
•它可以用于肉眼可视化趋势,也可以用于价格的持续加速和减速。每当价格高于MainPlot时,价格就会加速,而当价格低于MainPlot时,价格也会相反。
记得!!!…
•指标只是工具,没有魔力,不要盲目相信警报。
线性回归的斜率值表示。它具有一个参考图,可以直观地确定斜率值的变化(价格的加/减)。
参数
•Periods:计算线性回归的周期数
•PeriodsReference:根据主图的值计算移动平均线的周期数
•Displacement:水平轴上的位移
•AppliedPrice:进行计算的价格
•MainPlot:显示主图
•ReferencePlot:显示参考图
使用建议
•使您可以轻松查看当前价格趋势。如果MainPlot大于零,则趋势为正,如果小于零则趋势为负。
•它可以轻松直观地看到斜率的变化(价格的加/减)。如果MainPlot高于ReferencePlot,则价格正在加速,如果低于,则价格正在减速。
•非常适合于摆动交易或高速交易。
•确定交易主要方向(买/卖)的理想选择。
•它不提供有关价值区域(支撑,阻力)的直接信息,因此最好将其与价格指标(例如移动平均线或线性回归带)配对。
•当MainPlot穿越零时,提供有关市场反应区域(支撑,阻力)的间接信息(必须将穿越期与价格区

指標基於每個圖表時間的6個信號,跟踪同一資產的5個不同圖表時間的趨勢。
該指標的主要目的是向我們展示放置該金融資產的多數趨勢。 系統在數個圖形時間中傳輸趨勢信息,這樣用戶可以廣泛查看資產的移動,這種工具通過幫助操作員執行訂單使用戶具有較高的命中率 支持趨勢。 指标基于每个图表时间的6个信号,跟踪同一资产的5个不同图表时间的趋势。
该指标的主要目的是向我们展示放置该金融资产的多数趋势。 系统在数个图形时间中传输趋势信息,这样用户可以广泛查看资产的移动,这种工具通过帮助操作员执行订单使用户具有较高的命中率 支持趋势。 Zhǐbiāo jīyú měi gè túbiǎo shíjiān de 6 gè xìnhào, gēnzōng tóngyī zīchǎn de 5 gè bùtóng túbiǎo shíjiān de qūshì.
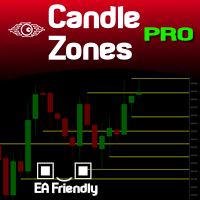
You probably heard about Candlesticks behaviors, which in most of the times could denote and trace Volume behaviors even if you are not watching Volume itself... Well, this indicator will do this. Naked traders love to rely solely on candlesticks patterns and with Candle Zones you can trap special patterns and DRAW THEM on your chart. As simple as that. There are several filters you can tweak in order to achieve the analysis you want. Just give it a try. After several months of testing, we think

AKT for MT5 (Traders Club)
機能: MAゴールデンクロスで買いサイン、デットクロスで売りサインを表示します。 MAの期間は短期足と長期足を入力できます。 MAの種類を選択できます。(SMA、EMA、SMMA、LWMA) 適用する価格を選べます。(CLOSE,OPEN,LOW,HIGH,MEDIAN,TYPICAL,WEIGHTED) サインをアラートで通知します。 サイン発生をE-mailやSNSで通知します。 表示するサインを変更することが出来ます。
サインの色を変更することが出来ます。
サインの表示された時間と価格が表示されます。
※価格は終値になります。
Indicator Noを変えることによるこのインジケータを複数適用することができます。
これにより違う MAの期間による ゴールデンクロスと デットクロスのサインを
表示できます。

ResiSupo (Traders Club)
このインジケータは直近の高値と安値を抜いたときに何ら方法で 知る方法はないかと思い開発されました。
機能: 指定したローソク足の本数で終値をベースに最高値と最安値の ラインを自動で引きます。 最高値と最安値のラインにタッチするとアラートで通知します。 通知はE-mailやSNSにも送信することができます。 最高値と最安値のラインを終値か高値または安値ベースにするかを選択できます。 Indicator Noを変えることによるこのインジケータを複数適用することができます。 これにより過去80本と20本などでの最高値と最安値のラインを引くことが可能になります。 現在のATRの値を画面に表示します。 これにより現在のボラリティーの状況が一目で分かります。 表示されているSLはディフォルトではATR値の1.5倍になっています。 この数値は現時点でのボラリティーの状況からの損切り幅の目安となります。 ATRのレベルにより表示の色が変わります。 ボタンを押すことによりアラートの通知を無効にできます。 ※ネットワークの不安定な環

Very special indicator of Joe Dinapoli which is a derivative from traditional MACD indicator. It shows the precise price, at which MACD will show line crossing and trend shifting. Also, this level is known one period ahead of time.You can constantly reassess your current position by looking at this studying a variety of timeframes. When you are in a trade, you have a feel for how much time you have for the trade to go your way by looking at the distance between the MACD Predictor line and the l

Very special indicator of Joe Dinapoli which is a derivative of a Detrended Oscillator. Through a set of parametric equations, a predicting oscillator is created that forecasts, one period ahead of time, overbought and oversold conditions. The resulting predictor values are expressed as bands on the bar chart, both above and below the market. It may be mistaken as a Bollinger Band but has no resemblance to it whatsoever. The Predictor bands may be used in a variety of ways to aid in entering an

Six Stars it is a Secure Automated Software for trade 6 values simultaneously. Six Stars It is optimized for the majors Do not use this robot at the same time as others, it is a multi-value robot, therefore it manages 6 pairs simultaneously. The architecture is a Fully Automatic Autonomous Robot Expert capable of independently analyzing the market and making trading decisions
Six Stars Have 6 neurals nets to used the correct algoritm in the correct market situation Six Stars It

战略说明: 对冲是市场上最安全的策略! 基于货币对的相关性和共同整合的专家顾问。 战略说明: 机器人与智能对冲,市场上最安全的策略。 他正在对冲(保险)两个高度相关的货币对的订单,所以无论市场走向哪个方向,回撤都将是最小的,利润将得到保证!
当相关工具偏离它们的路线时,ea会下注回到正确的汇率。 我们同时在具有高相关性的鼓乐器上进行交易。 在一种工具上进行的交易可以补偿在另一种工具上进行的交易的回撤。 因此,我们可以以相对较低的风险进行相当大的交易量。 操作原理在下面的视频中清晰可见。
https://youtu.be/GKwSD-OyyYE
在这个ea交易中,我试图尽可能简化设置,但是从早期开发中保留了所有主要功能。 (SMARTHEDGE和SH-2)。 现在,ea交易具有最大的自动调整,允许您更快地启动它进入交易。 以点为单位的所有参数现在都通过点差设置,不需要调整引号。 在自动模式下,不需要复杂的优化。 EA对大多数主要工具都有预设置! 即所有参数都已经嵌入到EA本身中。 您只需要在参数中设置AUTO并选择交易量! 顺便说一下,交易量也设置为存款的百分比,大多数经纪人不需
NewTest https://backoffice.aurum.foundation/u/DHXP1U
你好!.
CatchCandleLimitOrderOneSymbol-flat expert Advisor,用于从通道边界到中心开仓订单,从自定义通道宽度指标TMA开始回调支撑和阻力水平,具有固定的S/L和T/P。总是更好地等待最佳偏差,然后用订单buylimit进入市场;selllimit,以及我认为我们已经 创建 了一个专家,跟踪价格的整体运动定义了从总趋势回报的入口点。
盈亏平衡水平被使用-交易的实际部分的概念,当交易者达到一定的利润水平时,开仓位置的止损被转移到合同的开仓价格,从而使得在任何情况下都可以在没有损失的情况下平仓。
M5操作的推荐时间表。 通讯联系人777basil@mail.ru 我们将为您的任务准备一个专家,一个指标。 https://youtu.be/WBoduCjpJCM

Introduction to Fibonacci Volatility Indicator Volatility indicator can help you to detect any statistical advantage for your trading. Especially, if you are trading with Price Action and Price Patterns, then we recommend to use the Volatility indicator together with your strategy. Especically, Fibonacci Volatility indicator combines the market volatiltiy with Fibonacci Analysis to provide you more advanced volatiltiy indicator. Main Features Fibonacci Volatility in Z score Configuration Mode Fi

IntelRabbit MT5 Expert Advisor is a fully automated forex trading robot designed using our reversal trading strategies that we have developed over the years. These strategies find the highest probability entries and set TakeProfit and StopLoss accordingly. IntelRabbit MT5 EA works on any pair and timeframe. The default settings are for GBPUSD H1 timeframe. IntelRabbit MT5 EA settings and recommended ranges 1. Strategy Settings - Reversal Range: range of bars to calculate the reversal area. Th

Индикатор построен на основе индикаторов VIX и RSI. Комбинация двух указанных индикаторов позволяет обнаруживать зоны крайней перепроданности, где цена с большой долей вероятности изменит направление. Наиболее сильные сигналы дает в периоды слабого тренда. Сигналом индикатора является изменение направления гистограммы (с роста на снижение) выше заданного (сигнального) уровня.
В индикаторе задан широкий спектр параметров, который позволяет оптимизировать индикатор для торговли любыми активами: П

The intention of the dashboard is to provide a quick overview of the daily, weekly and monthly range of configured assets. In "single asset mode" the dashboard shows you possible reversal points directly in the chart, thus making statistics directly tradable. If a configured threshold is exceeded, the dashboard can send a screen alert, a notification (to the mobile MT5) or an email. There are various ways of using this information. One approach is that an asset that has completed nearly 100%
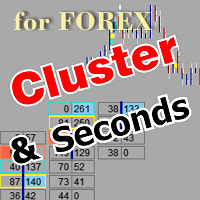
该工具允许绘制不同类型的图表。
秒图从1秒到86400秒 从1滴答开始的滴答图 成交量图 三角洲图 仁科图 范围图 用于体积分析的内置指标。 产品演示 https://www.mql5.com/ru/channels/clustersecondforex 每日市场概况和所选时间框架的市场概况。 集群搜索。 不平衡。 VWAP。 动态POC、VAH、VAL 价格窗口简介 具有不同表现形式的垂直体积。 δ,有不同的可视化选项。 当前的和高的时间框架极 地下室蜡烛图指标 为了控制该图表,我们使用了
鼠标左键--移动图表,在设置中选择不同模式,调用位于屏幕左下角螺丝刀键图标下的主设置窗口。 鼠标右键 - 用于输入位于屏幕左上角图标下的图形结构的设置,以及绘制垂直、水平、趋势线和矩形的个别设置。 在图表区域旋转鼠标滚轮--左右移动图表,按住Ctrl键--上下移动图表,在价格比例区域--按价格比例,在时间轴区域--按时间比例。 H键--在图表上或体积区建立一条水平线(必须启用 "画水平线 "图标),Shift+H键--删除所有水平线。 V键 - 设置垂直线(必须启用 "画垂直线 "图标),S

The indicator determines a special pattern of Joe Dinapoli. It gives very high probability buy and sell signals. Indicator does not repaint. Indicator Usage Buy Signal ''B'' Entry : Market buy order at signal bar close Stop : Low of signal bar Take Profit : First swing high Sell Signal ''S'' Entry : Market sell order at signal bar close Stop : High of signal bar Take Profit : First swing low Indicator Parameters Fast EMA : External Parameter (should be kept as default) Slow EMA: External Param

The Squat is a function of the range of a given price bar and the volume, or TIC volume, that occurs while that range is being created. The basic idea is that high volume and little price movement indicate substantial support or resistance. The idea behind the approach to this indicator is to first look for likely Fibonacci support and resistance and then see if Squat manifests when that point is reached. The indicator determines one of the high probability patterns of DiNapoli. It does not re
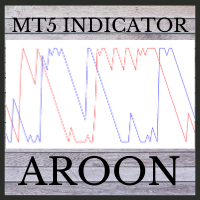
This indicator is powerful for detecting the trend.
The crossing between to line is the entry signal. Buffer 0 is UP line. Buffer 1 is DOWN line. Note: 1. Aroon is great tool for trending detecting. Please try to select the best period for each instrument.
Input AroonPeriod =14- Aroon period
MailAlert =false- Send email when entry signals appeared.
SoundAlert =false- Notify on MT5 platform.

Genesis Robot.
The robot analyzes atypical conditions in the market using optimization algorithms and indicators.
The robot doesn´t use Martingala.
Parameters
The robot only has one configurable parameter. Thus, It is a very easy robot to use
size_lot: This is the lot size of the open positions.
Recommendations for use.
Recomendations for use. The robot is optimized for the Forex market. It is not recommended to use in other markets.
The robot opens few positions per week. It is rec

The indicator scans for Dinapoli thrust pattern in multiple timeframes for a specific market. Key Features Indicator can be used for all markets It can scan for thrust pattern on W1, D1, H4, H1, M30, M15 and M5 timeframes Ability to choose number of bars required above/below displaced moving average to define thrust Able to move display label on chart by single click Parameters Minimum Bars: Least amount of bars to account for Thrust DMA Period: Moving average period DMA Shift: Number or bars re

The indicator scans for Dinapoli thrust pattern in multiple timeframes for the all markets filtered and shows the results on Dashboard. Key Features Dashboard can be used for all markets It can scan for thrust pattern on MN1, W1, D1, H4, H1, M30, M15 ,M5, M1 timeframes Ability to choose number of bars required above/below displaced moving average to define thrust Parameters
UseMarketWatch: Set true to copy all symbols available in market watch MarketWatchCount : Set the number of symbols that

The indicator is the advanced form of the MetaTrader 4 standard Fibonacci tool. It is unique and very reasonable for serious Fibonacci traders. Key Features Drawing of Fibonacci retracement and expansion levels in a few seconds by using hotkeys. Auto adjusting of retracement levels once the market makes new highs/lows. Ability to edit/remove any retracement & expansion levels on chart. Auto snap to exact high and low of bars while plotting on chart. Getting very clear charts even though many ret

Utility for know the performance of your acoount.
From dialog you can filter data in this modes:
- You can include or not include the open positions - You can include or not the closed positions - You can filter the data by date (from, to) - You can filter the data by simbols (multi selection) - You can filter the data by magic number (multi selection)
On bottom of table, are show the total of:
- Number of data - Total size - Total commissions paid - Total swap paids - Total profits - Total

Indicator with 3 features
- Clock : Clock independent of the chart, counting continues even when the market is closed.
- Template : After setting up a configuration in any graphic, be it color patterns, indicators, zoom ... The configuration will be copied to all active graphics.
- TimeFrame : Set the TimeFrame on a chart, and with just one click all the active charts will be changed to the same TimeFrame.

This system was developed to work with a large number of sets and after a certain time it showed itself well when working at the close of trading on Friday. As a result, this direction of trading became the main one for working with this Expert Advisor. However, you can create your own trading settings and choose any day of the week for trading. The collection of settings sets can be expanded. Currency pairs for which sets are developed: EURUSD, EURCAD, EURAUD, EURNZD, GBPCAD, GBPAUD, AUDNZD, GB

Buy and sell signals based on Larry Williams's exponential moving average strategies 9.1, 9.2, 9.3 and 9.4 for trend reversals and continuations.
To understand the logic and how to trade the signals, please check: Setup 9.1: https://www.mql5.com/pt/market/product/50986 Setup 9.2: https://www.mql5.com/pt/market/product/52268 Setup 9.3: https://www.mql5.com/pt/market/product/52269 Setup 9.4: https://www.mql5.com/pt/market/product/52273
Notices: - This indicator displays a lot of signals. B

The Ring A EA to rule them all
The Ring it is a Secure Automated Software for trade 28 pairs simultaneously. The Ring It is optimized for 28 pairs of forex market
Do not use this robot at the same time as others, it is a multi-value robot, therefore it manages 28 pairs simultaneously. The architecture is a Fully Automatic Autonomous Robot Expert capable of independently analyzing the market and making trading decisions
The Ring Have 6 neurals nets to used the correct algoritm in the

Great dashboard for market analytics. The panel helps to analyze the values of the MACD indicator and Macd`s signals.
Using this panel you can: watch the current signal from Macd for all time frames; watch the current signal from Macd by different symbols; look Macd value (main line and signal line); look different between Main line and Signal Line; several types of signals for analytics.
Values in the table cell: Macd value (main line); Macd value (signal line);
main line minus signal l
您知道为什么MetaTrader市场是出售交易策略和技术指标的最佳场所吗?不需要广告或软件保护,没有支付的麻烦。一切都在MetaTrader市场提供。
您错过了交易机会:
- 免费交易应用程序
- 8,000+信号可供复制
- 探索金融市场的经济新闻
注册
登录