适用于MetaTrader 5的新EA交易和指标 - 68
!! FLASH SALE !! Over 80% off !! For ONE week only. Now only $47 - normally $297! >>> Ends on 30 June 2023 - Don't miss it!
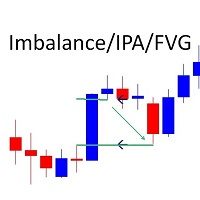
Marks Market I mbalance / Improper Price Action / Fair Value Gaps on The Chart As traders continue to search for the best trading indicators to guide their investments, the I mbalance / I mproper P rice A ction / F air V alue G ap I ndicator has become increasingly popular. This indicator helps to identify opportunities for taking profit . The indicator begins

MACD with fast and slow EMA. Moving average convergence divergence (MACD) is a trend-following momentum indicator that shows the relationship between two moving averages of a security's price . The MACD is calculated by subtracting the fast-period exponential moving average (EMA) from the slow-period EMA. Setup options: Fast EMA period Slow EMA period Signal EMA period Applied price Indicator window height Color MACD Color Signal Color Histogram
My Expert is a big modification of MACD indicator and it has the secret of making money in forex only. MACD Expert working very well under the following conditions: 1- Minimum deposit (100 $) 2- The recommended leverage usage (1:500) 3- Only working on (30 Min) frame. I prefer to use the expert for 3 months at least to see the result. The maximum drawdown will be approximately 20%
Pray for me :)
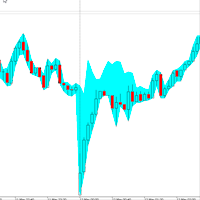
Александр Сергеевич Рыжков, [12.05.2022 7:02] SWI - Spread Widening Indicator.
Индикатор расширения спреда - должен быть в арсенале каждого опытного пользователя платформы Meta Trader.
Данный индикатор позволяет анализировать, аномальные ночные и новостные расширения спредов,
с помощью чего дополнительно максимизировать свою прибыль и снизить свои риски.
Для использования необходимо просто установить на график и подобрать цвет подходящий под ваш график.

各位商家注意了-購買後要領禮物,請私訊給我! 購買後您將收到: 指標 交易面板 造訪 VIP 聊天 使用訊號訪問頻道一個月。 獨特的設置 EA Thomas 是一種獨特的交易演算法,因其全面的方法(包括與五位交易顧問同時工作)而在市場上脫穎而出。
多位顧問:EA Thomas 整合了五種不同的交易顧問,每種顧問都針對不同的市場條件進行了最佳化。 這使得演算法更加靈活,能夠適應各種趨勢和波動性。
策略多元化:五位顧問均使用獨特的交易策略,如趨勢、反趨勢、移動平均線等。 策略多元化有助於降低風險,增加不同市場情境下交易成功的機會。 參數最佳化:此演算法包括優化每個顧問參數的機制。 這可以允許根據當前市場狀況更準確地選擇參數。 風險管理:EA Thomas 透過使用停損、止盈等工具提供有效的風險管理。 這有助於保護資本並防止巨額損失。 自動化系統:借助自動化交易系統,EA Thomas 為交易者提供了擺脫持續市場監控的機會。 這對於那些喜歡自動化策略的人來說很方便。 每種交易策略都有其自身的優勢,選擇取決於交易者的風格和偏好。 讓我們看看每種策略的好處: 順勢交易 - 優點: 更容

该滤波器基于贝塞尔多项式。它的主要优点是时间延迟小。这个过滤器的另一个特点是它对金融时间序列的最新值的高度敏感。正因为如此,该指标突出了活跃的价格走势,同时消除了噪音偏差。 除了经典变体之外,贝塞尔系数的对数已作为加权函数添加到指标中。在这种情况下,指标变得更平滑,但同时当价格活跃时它可能会滞后。 在计算贝塞尔多项式时,会使用阶乘。因此,指标的周期从下方和上方受到限制。使用普通贝塞尔滤波器时,最好注意指标的小周期。由于随着周期的增加,指标的行为变得越来越稳定,差异变得越来越不明显。 这些图显示了两种过滤器类型的行为。 指标参数: TypeFilter - 正常/对数滤波器类型选择 iPeriod - 指标周期,有效值 3 - 85。
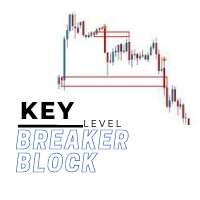
The key level breaker block indicator automatically draws breaker blocks for you on the chart. Breaker blocks are, in short, failed order blocks, but create strong support and resistance zones when price comes back to re-test them.
Advantages
The key level breaker block DOES NOT RE-PAINT, giving you confidence when a signal appears and also helps when looking back. The key level breaker block includes an on/off button on the chart to easily keep the charts clean after analysis by just on
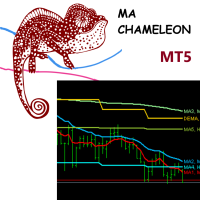
This indicator was developed by me, based on my experiences during my long term daily trading. It allows to get an excellent and compact overview about the current market situation without to have to monitor multiple charts. The default settings are widely used by traders. For example on sites like forexlive.com: https://www.forexlive.com/technical-analysis Features: The Moving Average Swiss Knife-like indicator for Daytraders Allows to setup of up to seven different MAs (MA and DEMA) to use on
The key level order block indicator automatically draws order-blocks for you on the chart. The indicator compliments any strategy and can also be used as an independent tool. It can work with smart money concepts, harmonic patterns, supply and demand, flag patterns, Quasimodo strategy and many more.
Advantages
The key level order block DOES NOT RE-PAINT, giving you confidence when a signal appears and also helps when looking back. The key level order block includes an on/off button on th

The Market Sessions Indicator for MT5 helps you predict market turnarounds by detecting major supply and demand areas. These pivot points tend to occur after a new session has started and the previous one is still open. It is also used to gauge how many points or pips the market moves on average during a session. This helps us to place better our take profits and stop losses. The indicator works on all forex pairs, gold, silver, commodities, stocks, indices and any other instrument that your

Supertrend indicator uses a combination of a moving average and average true range to detect the trend of a trading instrument.
Supertrend indicator for MetaTrader 5 easily shows the trend as a line following the price.
Triple SuperTrend Histo indicator calculate three supertrends to show the trend as a histogram. Changing the color from red to green means you can BUY , from green to red means you can SELL .
Description of the method of drawing a histogram. The price is above the EMA 20

Average Daily Range (ADR) with Support (S) and Resistance (R) Levels is an indicator which shows how far a currency pair can move in a day. It can be used to find hidden support and resistance levels, estimate effective profit and stop loss targets, and provide short term trade signals from the hidden S and R levels. Features
Automatically plots on the chat, the top and bottom of the ADR value (i.e. a horizontal channel) which acts as Support and Resistance Levels Automatically calculates the

Dinasty Trader Bot é o robô de negociação de trades no iBovespa que utiliza uma estratégia única e dominante, baseado em média móvel e também em definição de suportes e resistências por meio de Canal Keltner, que pode ser configurado em máximo/mínimo ou por indicador ATR. Os trades podem ser configurados para serem conforme tendência ou em reversões/repiques de movimentos, resultando em flexibilidade na definição de estratégia de conta. O sistema ainda considera um sistema de trail de média móve

Evening Scalper Pro is the state-of-the-art mean-reversion trading system that operates during all trading session. It's very different from most other scalping systems, since it uses a unique trading logic on cross pairs that have a strong mean-reverting tendency with high profit targets. EA not enters the market with market orders, it does not open trades. In terms of a trade duration, it's classical scalping: in and out of the trade within a few hours at the most. The EA uses a number of adv

Description: The Multi POC displays multiple Point Of Controls on one chart. This Indicator is also already included in the "VolumeProfile" Indicator .
Features: Customizable Range POC Customizable section POCs with VAL&VAH lines Works on all timeframes Drag & Drop for live calculation
Support: The indicator is constantly being developed and improved. Please do not hesitate to contact me via the MQL5 Platform. I am very grateful about any Bug report, so that i can constantly improve the ind
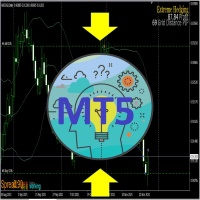
Extreme Hedging MT5 use BB indicator and grid ( calculate dynamic distance by SD indicator). -Long trading and more profit. -Hedging power help you to safety and low drawdown. -When price out of BB bound, EA will open order by dynamic grid. -Close trading order but except highest and lowest trading position. -Close Order by hand or setting by target profit. -Adjust grid distance with SD Value multiply with constant. -SD indicator help to manage the grid distance by the market situation. - Should

The Forex Master Pattern is an alternative form of technical analysis that provides a framework which will help you to find and follow the hidden price pattern that reveals the true intentions of financial markets. This algorithm here does a good job detecting the Phase 1 of the Forex Master Pattern cycle, which is the contraction point (or Value).
On Phase 2 we get higher timeframe activation (also called Expansion), which is where price oscillates above and below the average price defined
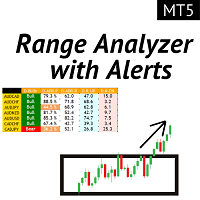
平均每日范围显示了在一定时期内测量的外汇对的平均点范围。 交易者可以使用 ADR 来可视化平均每日变动之外的潜在价格行为。 当 ADR 高于平均水平时,意味着每日波动率高于平时,这意味着货币对可能超出其正常范围。
我们的 ADR 分析仪由 5 个主要功能组成:
Range (ADR) Screener:一种多币种 ADR 分析。 ADR 区域:显示 ADR 区域外价格上涨的日内预期市场范围。 X bar Zone : 显示用户指定的 X 根柱线的突破。 每日高点和低点区:识别前一天高点或低点的突破。 每周高点和低点区:确定一周的突破日高位或低位。
限时优惠:范围分析仪指示器仅适用于 50 美元和终身。 (原价 125 美元)
主要特征
多币种筛选器。 ADR 区域突破 所有类型的警报(弹出、推送通知等) 支持所有货币。
文件资料
所有带有警报文档(说明)和策略详细信息的范围分析器都可以在我们的 MQL5 博客的这篇文章中找到: 点击这里。
接触
如果您有任何问题或需要帮助,请通过私信联系我。
警告
我们所有的指标都只能通过官方 Metatrader

每个人的指标 Pip Scalper 用于剥头皮趋势。 使用此指标更长时间地保持趋势。 它适用于所有时间框架和资产。 使用此工具获取每日点数。 使用 200 移动平均线过滤交易。 建议使用较小的时间范围。 用于日间交易。
关于和如何使用:
Pips Scalper 基于长期趋势交易。 买蓝色 卖出红色 在活跃期间使用 200 移动平均线作为过滤器和交易。
Pip Scalper 用于剥头皮趋势。 使用此指标更长时间地保持趋势。 它适用于所有时间框架和资产。 使用此工具获取每日点数。 使用 200 移动平均线过滤交易。 建议使用较小的时间范围。 用于日间交易。
关于和如何使用:
Pips Scalper 基于长期趋势交易。 买蓝色 卖出红色 在活跃期间使用 200 移动平均线作为过滤器和交易。
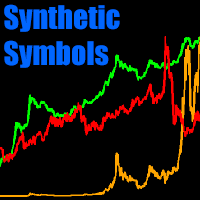
在您的终端符号(或您的自定义符号)之间执行任何操作以创建 自定义合成符号 :对数刻度、相对表现(股票与 SP500、黄金与白银……)、货币指数……可能性无穷无尽! 您可以逐个蜡烛地执行符号和常数之间的任何数学运算。包含用于获取 2 个值之间的最小值 [min(a,b)] 或最大值 [max(a,b)] 以及平方根 [sqrt(x)]、绝对值 [abs(x)] 的函数,一个值的对数 [logn(x) 或 log10(x)] 或最接近的整数 [round(x)]。 从 2.0 版开始,您还可以在当前交易品种中声明指标并访问其值,例如: $ma_indi = <MA> : 50,0,0 ; #CURRENT - indicator ($ma_indi, 0) 指标名称的语法是自定义指标的 文件夹/名称 和终端指标之间的“ < > ”。 如何使用 使用市场报价中以“#”字符开头的符号(例如#EURUSD)编写公式。确保任何符号的名称不包含任何运算符字符、括号或“#”,以便正确评估公式。 您还可以将公式保存在 txt 文件中并改为加载该文件。 该公式将在每根蜡烛上进行评估,将结果显
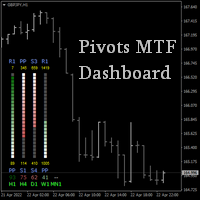
If you trade by levels, then this indicator is for you.
The indicator displays support and resistance levels for the selected timeframes, additionally showing how many points to the nearest levels, as well as between which levels the current price is in the form of a color scale and percentages.
Location anywhere on the chart, the ability to scale, the calculation offset taking into account the hourly difference of your broker, the choice of colors and other parameters will allow you to cus

Cybertrade Keltner Channels - MT5 Created by Chester Keltner, this is a volatility indicator used by technical analysis. It is possible to follow the trend of financial asset prices and generate support and resistance patterns. In addition, envelopes are a way of tracking volatility in order to identify opportunities to buy and sell these assets.
It works on periods longer than the period visible on the chart. All values are available in the form of buffers to simplify possible automations.
FREE

Cybertrade ATR Trend Zone - MT5 The indicator shows, by calculating the ATR (Average True Range), the zone of probable price resistance. Indicated to be used as a probable exit point of an operation.
It works on periods longer than the period visible on the chart. All values are available in the form of buffers to simplify possible automations. This indicator is the same one we use in our EA. Also check out our other products.
FREE
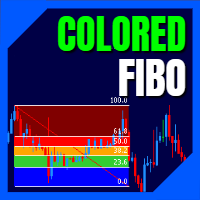
LT Colored Fibo is a simple indicator that paints the price zones between Fibonacci Retracement levels. Its configuration is extremely simple. It is possible to change the colors of each level of the retracement, choose between background or front of the chart and also work only with the current asset or all open. If you found a bug or have any suggestion for improvement, please contact me. Enjoy!
This is a free indicator, but it took hours to develop. If you want to pay me a coffee, I appreci
FREE

Battle of the Somme - it is a Secure Automated Software for trade Forex market and indices.
This EA uses the trench logic, looking for the strong and weak points of the market to initiate trades in favor of the market that we will call "offensive trades" or looking for strong points to make a "trench" and prepare to defend ourselves from the market attack. Logically, as in any market, the same as in trench warfare, most of the market is carried out with minor operations that look for market

Fast, Efficient and Precise. With the Calculator from PhipsProduction you have your risk under control with just a few clicks. Thanks to the easy handling and the visual risk area, the calculator is not only perfect for experienced traders, its also a must for new market participants. The program is suitable for all Account Currencys and common MetaTrader markets. (except bonds of all kinds)
To the Deluxe Edition: https://www.mql5.com/en/market/product/81428?source=Site+Profile
Application

Trend Entry Indicator Your Trading will Be easier with this indicator!!! This Indicator is Developed To make our trading life easier. Get an Arrow for Entry with Take Profit and Slop Loss marks on chart. - Indicator is Based on trend, because thats what we all want we want to follow the trend "it's our friend". - Based on Levels, price action and oscillators. - It works on all currency pairs, all indices, metals and stock. - it works on all pairs/indexes on Deriv including Boom and Crash. - Tim

In previous products , we have published an indicator of this strategy, but now we offer you an Expert Advisor to make it easier for traders
The procedure is whenever the price or the candle (depending on entry condition in the "Inputs" section, "Touch_Line", or "Close_Candle"), hits the Moving Average, the EA will open a position buy/sell automatically based on the volume, SL and TP that you specify in the " Inputs " section.
You also can define the direction of the positions, Buy, Sell, o

Cybertrade Double Bollinger Bands - MT5 The Bollinger Bands indicator shows the levels of different highs and lows that a security price has reached in a given duration and also their relative strength, where the highs are close to the upper line and the lows are close to the lower line. Our differential is to present this indicator in a double form, with the availability of its values to simplify automation.
It works on periods longer than the period visible on the chart. All values are
FREE

Every indicator has its advantages and disadvantages. Trending ones show good signals during a trend, but lag during a flat. Flat ones thrive in the flat, but die off as soon as a trend comes. All this would not be a problem, if it was easy to predict when a flat changes to a trend and when a trend changes to a flat, but in practice it is an extremely serious task. What if you develop such an algorithm, which could eliminate an indicator's flaws and enhance its strengths? What if such an algorit

If you're a trader looking to use Binance.com and Binance.us exchanges directly from your MetaTrader 5 terminal, you'll want to check out Binance Library MetaTrader 5. This powerful tool allows you to trade all asset classes on both exchanges, including Spot, USD-M and COIN-M futures, and includes all the necessary functions for trading activity. With Binance Library MetaTrader 5, you can easily add instruments from Binance to the Symbols list of MetaTrader 5, as well as obtain information ab

The Market Sessions Indicator for MT5 helps you predict market turnarounds by detecting major supply and demand areas. These pivot points tend to occur after a new session has started and the previous one is still open. It is also used to gauge how many points or pips the market moves on average during a session. This helps us to place better our take profits and stop losses. The indicator works on all forex pairs, gold, silver, commodities, stocks, indices and any other instrument that yo
You can identify the strength of the main forex currencies with this tool. You can combine it with different styles and get the best strategy out of it. It has very high power. It can be customized.
MT4 version
This indicator will have many updates and special settings will be added to it.
You can contact us via Instagram, Telegram, WhatsApp, email or here. We are ready to answer you.
This indicator setup two Moving Average indicators and when the smaller Moving Average (2) crosses the larger one (1) , you will be notified by Popup alert, mobile notification, or Email.
If your strategy works with two Moving Average indicators, you do not need anymore to constantly and tediously look at the chart. You should just add this indicator to the chart according to your required settings, and whenever the defined cross (up or down) is done, it notifies you and you wouldn't miss the

ESTRATÉGIA DE NEGOCIAÇÃO: Este EA foi projetado para operar tendências no IBOVESPA MINI, entretanto, é possível operar em qualquer ativo. A tendência é definida de acordo com relação preço e Média Móvel, totalmente configurável pelo usuário. Uma tendência de alta se configura quando existem "X" barras acima da Média Móvel, que ainda não tenham tocado na Média Móvel. O mesmo vale para uma tendência de baixa, porém com as barras abaixo da Média Móvel. Depois de "X" barras sem tocar a Média Móvel,

Highly configurable Volume indicator.
Features: Highly customizable alert functions (at levels, crosses, direction changes via email, push, sound, popup) Multi timeframe ability Color customization (at levels, crosses, direction changes) Linear interpolation and histogram mode options Works on strategy tester in multi timeframe mode (at weekend without ticks also) Parameters:
Volume Timeframe: You can set the lower/higher timeframes for Volume. Volume Bar Shift: you can set the offset of th
FREE

Color Candle Indicator. The indicator implements a breakout system using the channel. When price exits the gray channel, the candlestick color changes to the color corresponding to trend direction. Blue for growth, yellow color for fall. Bright colors denote coincidence of trend direction and direction of a candlestick. Dark colors correspond to the situation when the direction of a candlestick is opposite to trend.
FREE

Expert Adviser or Manual USER . This EA will automatically help you set a Hidden TP/SL it also has the ability to LockProfit when you have hit a target amount of Pips. It has built-in TrailStop and Alerts if needed.
Functions - Take profit - Stop loss -Modes for TP/SL ( Hidden or Visual) - ProfitLock system -Target point to enable lock profit -After Target point hit then this amount will be Locked (pips) - Trail stop modes ( Classic , Keep Distance, Step by Step) - Trailstop value -T

KT Higher High Lower Low marks the following swing points with their respective S/R levels: Higher High: The swing high made by the price that is higher than the previous high. Lower High: The swing high made by the price that is lower than the previous high. Lower Low: The swing low made by the price that is lower than the previous low. Higher Low: The swing low made by the price that is higher than the previous low.
Features The intensity of swing high and swing low can be adjusted by cha

The US Dollar Index, also known as DXY, is used by traders seeking a measure of the value of USD against a basket of currencies used by US trade partners. The index will rise if the Dollar strengthens against these currencies and will fall if the Dollar weakens against these currencies. Plan your technical analysis of the US Dollar Index by tracking its price in the chart and keep up with the latest market movements with news, advice pieces, and the dollar index forecast. The U.S. dollar index (

AUTOMATIC TRADE COPIER for local * use . (copy trades between several metatrader terminals on the local computer/ *or GLOBALLY after setting your network /server !)
Can copy trades from one or several main MT5 accounts to several MT5 and MT4 accounts (no limit). For MT5 to MT4 copy you have to also get version for Metatrader 4 here : https://www.mql5.com/en/market/product/80842 - very fast execution (theoretically up to 5ms delay, depends on computer speed)
- user can set speed of co
EMA - The exponential moving average (EMA) is one of the most commonly utilized forex trading tools. Traders use the EMA overlay on their trading charts to determine entry and exit points of a trade based on where the price action sits on the EMA. If it is high, the trader may consider a sale or short sale, and conversely if it is low, a buy.
SSL - Known as the SSL, the S emaphore S ignal L evel channel chart alert is an indicator that combines moving averages to provide you with a cl

Description Price action patterns detection that can work as triggers in any trading strategy, It include Flag, Flag Top, Flag 1234, and micro pullback patterns Support: We create great tools for the entire trading community. Most of them are free. If you believe in what we do Support Us Here. How is this indicator useful? You can use the indicator signals as a trigger to entry in the market and complement any trading strategy. Components Note 1: This indicator should only be considered a

AUTO MIDAS VWAP Volume Weighted Average Price (VWAP) is a trading benchmark commonly used by Big Players that gives the average price a Symbol has traded throughout the day. It is based on both Volume and price.
Commonly, MIDAS VWAP damand you to determine the initial point of analysis. This indicator plots automatically based on ZigZag Approach.
You will be able to use up to 3 HIGH MIDAS VWAP's and 3 LOW MIDAS VWAP's.
Wish the best trade results!!

AmA is a completely expert trader base on Starc bands trading. Since this expert is fully automatic, so it does not need to your attention. It opens and close when reach to its target (SL or TP). This expert has been specifically designed for Metatrader 5 and EUR/USD chart in variable timeframe as you wish (1H, 30M, 15M and 5M). By using this expert you can achieve to logical monthly income. You can set your Lot size according to your initial balance. The suggestion for initial balance more tha
FREE

Ayuda a interpretar la tendencia del precio de mercado de acuerdo a las mediciones en tiempo real, ideal para reforzar los resultados mostrados por el RSI las bandas de Bollinguer. Recuerde que el mercado de instrumentos financieros es altamente volatil, no opere con dinero que ponga en riesgo su estabilidad financiera. Solo use fondos que este dispuesto a perder. Resultados pasados no garantizan resultados futuros. Mantenga Siempre control sobre el riesgo.

Seconds Chart — timeframes in seconds for MetaTrader 5. The utility allows you to create charts in the MetaTrader 5 terminal with a timeframe in seconds. The timeframe on such a chart is set in seconds, not in minutes or hours. Thus, you can create charts with a timeframe less than M1. For example, S15 is a timeframe with a period of 15 seconds. You can apply indicators, Expert Advisors and scripts to the resulting chart. You get a fully functional chart on which you can work just as well as on

交易时段指标突出显示每个交易时段的开始和结束 。
Trading_Sessions_Indicator_Free 产品的付费版本,可以自定义会话的开始/结束。
[选项:] Asian session Open Asian session Close Asian session OpenSummertime Asian session CloseSummertime European session Open European session Close European session Open European session Close Timeshift
请使用M15-H2时间帧以获得最佳效果。
增加了时间帧M1,M5的校正。 近似校正: Bars Correction ------------------ 23.50 ____ 10 23.54 ____ 5 23.55 ____ 4(5) 00.05 ____ 5(6)
我在市场上的其他产品 https://www.mql5.com/en/users/sky-angel/selle

Lehmer均值可以看作是一个窗函数,其权重系数取决于计算中使用的变量的值。该平均值是非线性的,因为在其计算中使用了取幂。 指标的特征取决于两个参数: iPeriod - 指标周期,有效值大于等于2; iPower - 指数,在计算指标值时使用。有效范围是 -32768 到 32767
在 iPower = 0 时,我们得到调和平均值, iPower = 1 - 算术平均值, 对于 iPower = 2,反谐波平均值。 Lehmer 均值具有较大的指数,突出了时间序列的最大边界。对于负指数,强调最小值。由于此属性,Lehmer 均值可用于平滑时间序列和构建通道。
第一张图片显示了使用收盘价计算的通道,指数为 +500 和 -500。 第二张图片显示了同一通道,iPower = +1000 和 -1000。 在第三和第四个数字中,Lehmer 的平均值适用于 +/- 1000 和 +/- 5000 的最高价和最低价。
Tick Volume Chart — fixed volume bars for MetaTrader 5. The utility creates charts on which each candle has a fixed tick volume. Data sampling is carried out not by time but by the tick volume. Each bar contains a given (fixed) tick volume. The tick volume can be adjusted by changing the value in a special field. You can apply indicators, Expert Advisors and scripts to the tick chart. You get a fully functional chart, on which you can work just as well as on a regular chart. The graph is built n

Cybertrade Auto Fibonacci retraction and projection - MT5
##### Free indicator for an indefinite period. ##### Auto Fibonacci is an indicator that automatically plots the Fibonacci retracement and projection based on the number of bars you select in the indicator setting. You can customize nine different levels of retraction and three levels of projection. It works on periods longer than the period visible on the chart. All values are available in the form of buffers to simplify possible au
FREE

Hello dear traders. Advisor Index 24!
Analogues do not exist! The starting price of the adviser has been reduced! Advisor trades 24 hours a day! Installed on the US30 chart. The EA's algorithm is based on the analysis of the behavior of stock indices on the available history. Trades are opened when stock indices diverge in history. Unique hedging algorithm for two indices at the same time! Due to which the adviser trades with minimal drawdowns. Use a virtual server that works 2

A complete Session Timer that shows the current time, session information with remaining time, chart display of range (high-low) and open price, of current and previous sessions for major markets, and option to add an additional city. A friendly user interface with clickable icons, customizable panel location and format, selection of colors and text. It automatically handles the DST (daylight saving) settings. It also shows the GMT/UTC and server (broker) time. And includes a Candle timer option
FREE

Just choose your profit point and your maximum risk, the system calculates the rest for you!
No more wasting time calculating the value of risk and profit, with this system trading is faster and easier! Set your stop loss and your take profit by values, points, or just dragging the dotted lines and Trade for Dummies calculates* how much you can profit and how much is your risk!
No delays! Trade immediately as soon as you see a market opportunity, if you use market signals or analyst tips, m
Tick Chart — full-featured chart for MetaTrader 5. A utility for creating and working with a tick chart in the MetaTrader 5 terminal. You can create a tick chart that works exactly the same as a regular chart. You can apply indicators, Expert Advisors and scripts to the tick chart. You get a fully functional tick chart on which you can work just as well as on a regular chart. You can enable the output of the Ask price data. The data are generated in the form of the upper shadow of a tick bar. Fr

Simple Super Trend indicator for MetaTrader 5. A trend indicator similar to moving averages. Use it for entry and exit signals. It gives accurate signals on precise time. Works as a Trailing SL/TP. This indicator can also be used on multiple timeframes where you place it on a larger timeframe then go to a lower timeframe. Super Trend needs to be used in conjunction with other indicators like rsi, Parabolic SAR, MACD, etc to receive filtered signals.
FREE
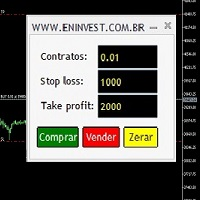
Now you can trade using hotkeys, "z" to buy, "x" to sell and "c" to close positions/orders. You can open positions at market by pressing the buttons on panel and add your orders to the book when press the hotkeys. Also, the open price, stop loss and take profit are shown to you in chart when the hotkeys are pressed.
This panel can be used in netting and hedge accounts.

This indicator calculates gann support and resistance prices with use gann pyramid formulation and draw them on the chart. And If you want, Indicator can alert you when the current price arrive these pivot levels. Alert Options: Send Mobil Message, Send E-mail, Show Message and Sound Alert Levels: S1, S2, S3, S4, S5, R1, R2, R3, R4, R5 Inputs: GannInputPrice: Input price for gann pyramid formulation. GannInputDigit: How many digit do you want to use for calculation formula. (The number and the
FREE

交易数据分析助手 : 这是一款交易数据统计分析工具,数据图表较多可供分析参考 . 语言: 支持语言的选择切换(目前支持中文和英文 主动识别不用人工选择) 主窗口显示: 余额显示 总盈亏显示 现在持仓盈亏金额显示 现在持仓盈亏比例显示 买单卖单总单量,总手数,以及盈亏情况显示. 仓位使用比例显示 按照目前持仓能够承受的亏损点数预计 (点击右下角可缩放)每日订单单量,手数,盈亏情况统计 (点击右下角可缩放) 当周盈亏数据
(点击右下角可缩放) 当月盈亏数据
(点击右下角可缩放) 当年盈亏数据
交易数据统计区: 详细订单统计,(可以选择按日,周,月,季度,年)(按品种,识别码)(现有持仓详细统计) 盈亏/手数/交易次数 柱状图 多/空持仓时间/获利水平情况 多货币盈利次数/盈利水平分布情况 余额净值曲线/余额曲线/盈利曲线等(注:加载余额净值曲线可能需要一定的数据处理时间,请耐心等待加载完成...) 每次订单盈亏利润柱状图 多货币对盈利曲线图 数据统计分析报告 关于版本更新 有任何问题,建议,欢迎交流.
FREE

Try how the adviser trades, I'm sure you'll like it! Extremely easy to use, does not require additional settings. Unique dynamic grid algorithm with trend indicator and hedging. Works with all Forex currency pairs. Default parameters are configured for EURUSD M5
What can be a problem for other grid Expert Advisors GS one turns into profit. Has a set of strategies: Follow the trend Sell and Buy Only Sell Only Buy XAUUSD_M5 GBPUSD_H1
GS one has an intuitive interface for quick management of t
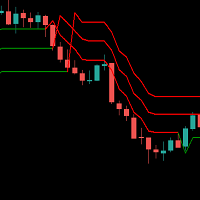
Supertrend indicator uses a combination of a moving average and average true range to detect the trend of a trading instrument.
Supertrend indicator for MetaTrader 5 easily shows the trend as a line following the price.
USAGE THIS INDICATOR If the closing prices are above Supertrend Line, there is a Bullish sentiment at that moment. The opposite is a Bearish sentiment. Three green lines - Strong Bullish sentiment. Three red lines - Bearish sentiment.
For BUY : - Three green lines and pric

This indicator is designed according to the combination of WPR and Stoch indicators, when WPR goes up and Stoc goes up quickly too, the price may meet strong resistance, many times short order will take profit, but if the price break through it, Long positions are more likely to be profitable, and the reverse held true as well. You can adjust the parameters of WPR and Stoc to Adapt the symbol you operate. Click here to look the advanced edition: https://www.mql5.com/en/market/pro
FREE

Highly configurable Average True Range (ATR) indicator.
Features: Highly customizable alert functions (at levels, crosses, direction changes via email, push, sound, popup) Multi timeframe ability Color customization (at levels, crosses, direction changes) Linear interpolation and histogram mode options Works on strategy tester in multi timeframe mode (at weekend without ticks also) Adjustable Levels Parameters:
ATR Timeframe: You can set the lower/higher timeframes for ATR. ATR Bar Shift: y
FREE

TIO Scalping - это полностью автоматизированная "откатная" торговая система, которая особенно эффективна при торговле на популярных откатных валютных парах: AUDCAD,NZDCAD,EURGBP,EURUSD,USDCAD . Всего в советнике реализовано 10 различных торговых стратегий , включая различные свинговые, внутридневные и скальперские стратегии , со своими стопами и тейками. В советнике нет зависимости от спреда, для торговли на разных типах счетов. Это дневной Скальпер. Он не использует ролловерное время

This indicator is the advanced edition of WRP&KD support resistance designed according to the combination of WPR, Stoch, RSI, CCI, and tick volume indicators. You can add other timeframe's support and resistance on the current chart. When WPR, Stoch, RSI, CCI goes up the same time quickly and the volume become larger, the price may meet strong resistance, many times short order will take profit, but if the price break through it, Long positions are more likely to be profitable, and the
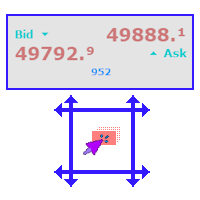
A simple and functional Current Price Panel that shows magnified Bid, Ask and spread price, that can be moved by using the mouse, to any location of the chart window. The functionality included are: Customize Current Price Panel Width and Height, Row and Column gap. Background color, background transparency and border color. Font, its size and color. Move the panel to any location of chart window. Option to show current spread as pips or points. Highlight spread in different color if it crosses
FREE

SaTo EA No2 Trade information: EUR/USD period H1 Money management: Lot constant Indicator: Moving Average (MA) with Average Directional Movement (ADX) - Moving average: Fast moving average, Slow moving average - ADX for filter trend Buy signal: Fast MA greater than Slow MA, ADX greater than filter level Sell signal: Slow MA greater than Fast MA, ADX greater than filter level

Compass B3 Trader é um robô especialista em trades automatizados para o iBovespa (Miniíndice WIN e Minidólar WDO), baseado na estratégia de análise de inclinação de média móvel. A partir de estabelecimento da inclinação desejada, o robô realiza as entradas de trades, seguindo takeprofit e stoploss fixos ou dinâmicos conforme análise de velas. Ainda, pode-se configura um sistema de trail de stoploss possibilitando trades completos e de grandes grandes (+ pontos). Ativos: WIN, WDO. Timeframe: M1,

RSI Scanner is a multi symbol multi timeframe RSI dashboard that monitors Relative Strength Index indicator for price entering and exiting overbought and oversold in up to 28 symbols and 9 timeframes.
Download Demo here (Scans only M1, M5 and M10) Settings description here MT4 version here
RSI Scanner features: Signals RSI entering and exiting the overbought and oversold zones. Monitors 28 customizable instruments and 9 timeframes at the same time. Supports all 21 timeframes of Metatra
学习如何在MetaTrader AppStore上购买EA交易,MetaTrader平台的应用程序商店。
MQL5.community支付系统支持通过PayPay、银行卡和热门付款系统进行交易。为更好的客户体验我们强烈建议您在购买前测试EA交易。
您错过了交易机会:
- 免费交易应用程序
- 8,000+信号可供复制
- 探索金融市场的经济新闻
注册
登录