YouTube'dan Mağaza ile ilgili eğitici videoları izleyin
Bir ticaret robotu veya gösterge nasıl satın alınır?
Uzman Danışmanınızı
sanal sunucuda çalıştırın
sanal sunucuda çalıştırın
Satın almadan önce göstergeyi/ticaret robotunu test edin
Mağazada kazanç sağlamak ister misiniz?
Satış için bir ürün nasıl sunulur?
MetaTrader 5 için yeni Uzman Danışmanlar ve göstergeler - 68

It makes it easier to see where there have been consolidation zones for previous prices and allows you to highlight the histogram where there is the biggest consolidation zone.
Input parameters Intervalo de preço Is the price between the histograms
Periodo Number of candle sticks to be analyzed
Porcentagem Highlights the histogram where there is minimal consolidation in relation to the analyzed period
FREE

Angle of Moving Averages This indicator is very simple yet powerful concept which constantly calculate the slope of the current bar moving average with respect to the N bar before moving average value. This no only give a good entry and exit signal but also it shows traders the strength of the signal. It shows positive green histogram when market is moving toward upward direction and red histograms for downtrend. When large histograms found means market has very strong trend. Inputs Available

The fractal indicator shows the latest support and resistance levels. If the price breaks through the level and is fixed, the indicator draws a rhombus of yellow or crimson color signaling a possible continuation of the movement towards the breakdown.
Indicator Settings:
- BarCount: sets the minimum number of bars required to build a fractal.
It is better to use the indicator in conjunction with other indicators.
FREE

The indicator calculates the correlation coefficient of 2 instruments, shifts the chart of the 2nd instrument relative to the 1st and displays the charts of both instruments on the current chart. The maximum positive and negative deltas and the current delta as a percentage of the maximum are calculated. It is possible for signals to set a delta for entry and exit with displaying the direction of entry into trade for each instrument. The space between the charts is also filled with different col

The indicator calculates intraday levels based on the average daily price range, builds support and resistance levels that may be reversal.
Parameters Period ATR - period of the ATR indicator Shift time - time offset for the opening of the day Color opening of day - color of the opening line of the day Color 1AR, -1AS - line color 1AR, -1AS Color AR 1/2, AS -1/2 - line color AR 1/2, AS Color AR 1/4, AS -1/4 - line color AR 1/4, AS -1/4 Color AR 3/4, AS -3/4 - line color AR 3/4, AS -3/4 Colo
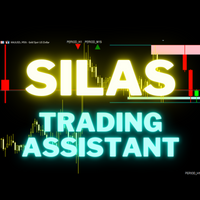
Silas is a trading assistant for multi-timeframes traders. It show on the screen, in a very clear way, all the informations needed to suits to your trading. It show : - Supply and demand zone from 2 timeframes of your choice - Setups based of market structure from 2 timeframes of your choice - Daily current high and low points - The last 2 closed candles and the current candle from an higher time frame on the right of the graph. - Actual daily candle on the left Everything is customisable !

'Fibonacci Dimension' indicator allows display of preset or user-defined multi-timeframe Fibonacci levels. It automatically takes the previous high and low for two user-defined timeframes and calculates their Fibonacci retracement levels. It also considers the retraced level to draw the expansions on every change of price. A complete visual dimension in multiple timeframes allows deriving profitable strategies for execution. The functionalities included are: Provides an option to consider a pres
FREE

https://www.youtube.com/watch?v=0T8Mge39Xsk&t=9s
Youtube
These EAs trade macd divergence only if there is a parabolic sar change at the same time. Sell bearish macd divergence & parabolic sar crosses above price Macd settings Threshhold is how far above / below zero divergence must occur. Timeframe used Parabolic sar settings
Only one trade in that direction can be opened at once. Trades on open bar Alerts , mt5 and mobile Stop loss and target points Stop loss is set to a % percentage of
FREE

Welcome to Investment Castle products This product is exclusively available in the MQL5 market and is not available and will not be available anywehere else. The Combined indicator is a multi-time frame indicator and it is built using 3 indicators: Bands indicator which draws the support and resistance key levels using up to 5 different time frames Patterns indicator which draws the chart patterns using up to 6 different time frames Spots indicator which shows the common candlestick patterns Yo
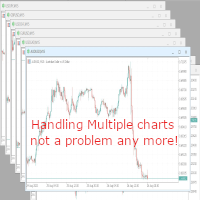
With this script you can open or close multiple charts with just one click. Please follow the instructions below; Set your desired symbols in the market watch window. Open one chart. Attach the script to the chart In the input values just select the time frame of your chart. Set open chart value to true. Click ok. To close the charts follow step 3 and 7. In input values set open chart value to false and close chart value to true

** All Symbols x All Time frames scan just by pressing scanner button ** *** Contact me to send you instruction and add you in "Divergence group" for sharing or seeing experiences with other users. Introduction MACD divergence is a main technique used to determine trend reversing when it’s time to sell or buy because prices are likely to drop or pick in the charts. The MACD Divergence indicator can help you locate the top and bottom of the market. This indicator finds Regular divergence for pul
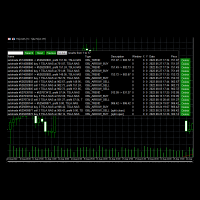
Use this software to browse through all objects within the chart and look at them comfortably. Also, you can look at the list of global variables and search and delete them . The same you can do with charts and indicators. You can search in objects names and object descriptions to find the object you are interested in. This is definitely an improvement to what is available in Mt5. You type what you are interested in , then press Search button. You can move to next and previous search results. N
FREE

V Band is a technical analysis tool that helps smooth out price action by filtering out the “noise” from random price fluctuations. It is calculated by taking the average of a market’s price over a set period of time.
It can be applied to stocks equity indices, commodities and Forex . V Bands is used to identify trends or support and resistance levels.
They can also be used to generate buy and sell signals.
Choose a trading style and start trading!

Inventory Retracement Trade it is designed based on one of the most popular tradingview indicator. This is mostly combined with other popurlar trend indicator to confirm the strength of the movement. Definition Inventory Retracement Trade is quickly becoming one of the most popular ways to identify where short-term counter trend institutional inventory has subsided and when it’s time to re-enter into a trade’s original trend direction.
This EA utility does not trade on its own, but it only modifies the open trades to add take profit and stop loss that was opened manually or by any other expert advisors.
The distance is based on Average True Range Indicator(ATR).
How Does It Work?
If Symbol to modify is set to "All Symbol" simply attach it to one chart, and all open trades in the entire terminal will set the take profit and stop loss with the distance of Average True Range value of their corresponding symbol.
If

Waterstrider Cash Register
A High Risk trade with Martingale grid
The trend is based on the h1 chart, and scalping in m1-m15 chart.
Pair EURJPY, USDJPY, AUDUSD
8 position will open if against the position, and when the 8 position reach, a hedge position will open to increase the equity balance with small tp and re entry every 10% DD. after that the ea will calculate the open position and the hedge position and will close all in profits. No guarante for profit, you can try this with you

https://www.youtube.com/watch?v=0T8Mge39Xsk&t=9s
Youtube Sell only EA here.
These EAs trade macd divergence only if there is a parabolic sar change at the same time.
Buy bullish macd divergence & parabolic sar crosses below price Macd settings Threshhold is how far above / below zero divergence must occur. Timeframe used Parabolic sar settings
Only one trade in that direction can be opened at once. Trades on open bar Alerts , mt5 and mobile Stop loss and target points Stop loss is set

Boom and Crash Buy and Sell Trend. Non-repaint. Can be used on all timeframes 1 minute for scalpers. 5 minute to monthly timeframe for swing trading. works on all boom and crash pairs Crash300, Crash500, Crash1000. Boom300, Boom500, Boom1000. Green histogram colour means the trend is up(bullish) Buy signal. Dark orange histogram colour means the trend is down(bearish) Sell signal.
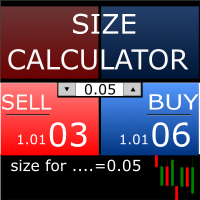
Size Calculator allow you to calculate the size you need for your position giving two parametres: the number of pips risked and the money risked, for example if you want to risk 20 USD on 200 pips, then you will need to input 200 in the case reserved for pips and 20 in the case reserved for risk, the size will appear in left top carner of the chart in your metatrader 4 platform, Size Calculator support the following symbols : EURUSD GBPUSD AUDUSD NZDUSD GOLD WTI EURJPY GBPJPY USDJPY AUDJP

Turn Stock Manager into Your New Business Opportunity – You can sell Stock Manager to your customers as a service by selling License. – The Licenses is managed in a Web Admin dashboard. – Highly flexibility structure that allows customers to host their database in Cloud or Self-hosted. – Admin/Staffs can create unlimited number of license for selling. please test me now
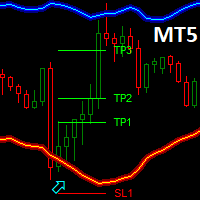
Dark Bands is an Indicator for intraday trading. This Indicator is based on Counter Trend strategy but use also Volatility. We can enter in good price with this Indicator, in order to follow the inversions on the current instrument.
Key benefits
Easily visible take profit/stop loss lines Reliable bands lines with futuristic colors, and Intuitive directional arrows Useful statistics , which indicate the win rate of the signals Plus Package available, leave a feedback to receive it for
FREE

Fast Quantum Indicators based on innovate SSC model and Real time tracking pursuit the breakouts of support and resistance levels. Tüm tür pazarlarda alınan yeni bir başlangıç. Fast Quantum Indicators is a innovate initiate SSC model Real time tracking pursuit trend , based on innovate SSC model and Real time tracking pursuit the breakouts of support and resistance levels. It's a innovate initiate traded on all types of markets. Fast Quantum AI Expert Trading Robots EVERYTHING IS

Fast Quantum Indicators based on innovate SSC model and Real time tracking pursuit the breakouts of support and resistance levels. Tüm tür pazarlarda alınan yeni bir başlangıç. Fast Quantum Indicators is a innovate initiate SSC model Real time tracking pursuit trend , based on innovate SSC model and Real time tracking pursuit the breakouts of support and resistance levels. It's a innovate initiate traded on all types of markets. Fast Quantum AI Expert Trading Robots EVERYTHING IS

UR Ön UçArka Uç
UR FrontEndBackEnd, en doğru destek ve direnç seviyelerini bulmak için en sevdiğim formüldür. Ayrıca ne kadar güçlü olduklarını işaretlemek için bunları farklı kategorilere (kesikli çizgiler, düz çizgiler ve alanlar) ayırdım. Tümü arabelleklerde saklanır, böylece diğer araçlara kolayca erişilebilir ve uygulanabilir.
Ek: Aracın uygulandığı varlığa göre ayarlanması gerekebilir - varlığın aracı etkileyen fiyattaki basamak sayısı farklılık gösterir. Bunun için gerekli parametr
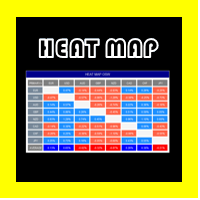
BAŞ HARİTASI OSW
Bu gösterge, tüm para birimi kombinasyonlarının mevcut durumunu ve varyasyonlarını bilmek için idealdir.
Varyasyon, fiyatın mevcut fiyattan 24 saat öncesine veya menüde yapılandırılan her şeye göre yüzde hareketiyle hesaplanır.
Bir para biriminin varyasyonunu bilmek için birincil para birimine bakmanız yeterlidir, örneğin:
EUR'da diğer para birimleriyle karşılaştırmak için dikey bakmanız gerekiyor ve hepsinin sonunda tüm bu varyasyon değerlerinin ortalamasını buluyorsun

ESS ETKİLEYİCİ DURUM SİNYALLERİ
Bu gösterge, bir filtrenin uygulandığı zarf tipi mumları algılar, bu filtre, ölçülebilir parametreler dahilinde mümkün olan en büyük etkinliği belirlemenin mümkün olduğu 3 stratejiden oluşur.
Sinyaller, her yön için yukarı ve aşağı oklarla gösterilir ve ayrıca uyarıları, e-postaları ve cep telefonuna push mesajlarını etkinleştirebilir veya devre dışı bırakabilirsiniz.
Hiçbir göstergenin %100 etkili olmadığını belirtmekte fayda var, bu nedenle kendi strateji

TEST VE KULLANMADAN ÖNCE EA'YI OPTİMİZE EDİN.
Bitcoin M5, 5 dakikalık grafiklerde BTC/USD ticareti yapmak içindir. SL ve TP 50000 ile Başlamalıdır. KULLANMADAN ÖNCE OPTİMİZE EDİN
Ticaret stratejisi, ticaret yapmak için Bollinger Bantları ve Zarf göstergelerini kullanır. Fiyatın bantları ihlal ettiği bazı kırılma noktalarını yakalamak için işlem yapmak ve ardından fiyat zarfları geçtiğinde çıkış yapmak. Her işlemde sabit bir lot miktarı kullanılır ve bir SL ve TP bulunur. EA, mantıkta mart

** All Symbols x All Timeframes scan just by pressing scanner button ** *** Contact me to send you instruction and add you in "ABCD scanner group" for sharing or seeing experiences with other users. Introduction This indicator scans AB=CD retracement patterns in all charts. The ABCD is the basic foundation for all harmonic patterns and highly repetitive with a high success rate . The ABCD Scanner indicator is a scanner reversal ABCD pattern that helps you identify when the price is about to cha

YOU CAN NOW DOWNLOAD FREE VERSIONS OF OUR PAID INDICATORS . IT'S OUR WAY OF GIVING BACK TO THE COMMUNITY ! >>> GO HERE TO DOWNLOAD
More About Advanced Currency Meter Every good forex system has the following basic components: Ability to recognize the trend direction. Ability to identify the strength of the trend and answer the basic question Is the market trending or is it in a range? Ability to identify safe entry points that will give a perfect risk to reward (RR) ratio on every position
FREE
This utility tool shows the ticker symbol, timeframe, and description information as a watermark on the chart. Text resizes automatically according to chart size. It is useful to identify the correct chart when multiple charts are shown on the screen. Premium version supports changing font name and color independently for symbol name and description, and defining screen location for symbol placement. See the demonstration video below!
Symbol Name Inputs: Font Name: Specifies font used. Need

Close All and Change Take Profit and Stop Loss All Orders. Main Features
Ability to Close All Orders the Symbol you put this EA. Ability to Change Take Profit to All Order. Ability to Change Stop Loss to All Order. Show Order count. Show Average price with info and Horizontal Line. Show lot open.
Show Price diff from average to price now Show broken price with info and Horizontal Line. Easy to use . How to use
Close All (Symbol) PC : you can click on Clos

PRESENTATION
This EA uses several non-directional strategies that allows it to generate profits regardless of price trends. It manages a pool of positions ("session") in a totally autonomous way To avoid risks related to this strategy, several recovery functions have been implemented. This makes it a reliable and secure EA, its DD remains low.
RECOVERY MODE This EA is designed to run on several pairs simultaneously on an account. When the DD of a session exceeds a defined value, all positions

Awesome Oscillator by Bill Williams with the ability to fine-tune and replace the averaging algorithms of the indicator, which significantly expands the possibilities of using this oscillator in algorithmic trading and brings it closer in its properties to such an indicator as the MACD. To reduce price noise, the final indicator is processed with an additional Smooth averaging. The indicator has the ability to give alerts, send mail messages and push signals when the direction of movement of th

Accelerator Oscillator by Bill Williams with the ability to fine-tune and replace the averaging algorithms of the indicator, which significantly expands the possibilities of using this oscillator in algorithmic trading and brings it closer in its properties to such an indicator as MACD.
To reduce price noise, the final indicator is processed with an additional Smooth averaging. The indicator has the ability to give alerts, send mail messages and push signals when the direction of movement
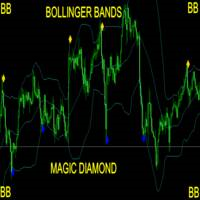
Take Your Trading Experience To the Next Level ! and get the Magic Bollinger Bands Diamond Indicator MagicBB Diamond Indicator is MT5 Indicator which can suggest signals for you while on MT5. The indicator is created with Non Lag Bollinger Bands strategy for the best entries. This is a system to target 10 to 20 pips per trade. The indicator will give alerts on the pair where signal was originated including timeframe. If signal sent, you then enter your trade and set the recommended pips targ
SK Stochastic Candle Moves EA based on Stochastic oscillator . It is used to generate overbought and oversold trading signals. Easy to use and Simple No Martingale Recommended GBPUSD,EURUSD Timeframe M30,H1 others timeframes with the appropriate settings. Works for ECN/Non-ECN brokers and 2-3-4-5 digit symbols
A low latency vps is and an lower spread broker is always recommended. Support us by open My recommended broker. Exness Tickmill How its work ? Candles move XXX bars above
FREE
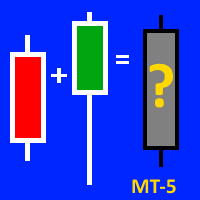
This indicator will be VERY USEFUL for anyone who works with candlestick patterns. This indicator is designed to display the average figure from two adjacent candles (current and previous). Accordingly, it shows IN CONTEXT the strength or weakness of bulls / bears (!). But please, don't forget about the classical basics of technical analysis (!). All indicators are just an auxiliary tool for reading a chart (!). A demo version on the example of mt-4 can be found here: https://www.mql5.com/ru/ma

В основу алгоритма этого осциллятора положен анализ веера сигнальных линий технического индикатора RSI . Алгоритм вычисления сигнальных линий выглядит следующим образом. В качестве исходных данных имеем входные параметры индикатора: StartLength - минимальное стартовое значение первой сигнальной линии; Step - шаг изменения периода; StepsTotal - количество изменений периода. Любое значение периода из множества сигнальных линий вычисляется по формуле арифметической прогрессии: SignalPeriod(Number)

This robot features a simple user interface design. But underneath, it holds a lot of advanced features that allow you to do various things with the system. You can choose to only buy or sell. Also, you can create different types of orders, such as market, stop, and limit orders. Or you can choose automatic mode and let the system decide the order type. The strategy can also be adjusted according to your preferences. You can also select the method of calculation for all exit levels. This means

The Black Dragon robot embodies my core concept used in many different robots developed by me, which is a minimalist UI design. The robot can be used on different symbols with default settings, eliminating the need for additional user intervention. When applied exclusively to a single currency pair, no adjustments are required. However, for those who want to deploy the robot on different currency pairs (see the list below), each symbol must have a unique ID or magic number. It is highly recommen

Book Map Order Flow shows the price and volume, processing the DOM. See the volume in a better way. See the support and resistance and the possibility of breakouts of them. Input up to 20 price levels to see where the volume is trading and what side. The indicator was made from an EA by denkir but it needed include files to work so I developed and indictor from this out of MQL5 how to cookbook article here: https://www.mql5.com/en/articles/1793 . It can be an easy and valuable tool for all.

OPTIMIZE EA BEFORE BACKTEST AND USE In times of high inflation, hedging with gold is valid. Trade this EA on the XAU/USD 5 minute chart. It is important to optimize sl a tp before use if out of date. This was built on this years data 2022. Also continual optimization of tp and sl is required for any EA. The strategy uses Williams Percent Range and ADX for entries and Standard Deviation and Moving Averages for exits. The lots are fixed and every trade has a stop loss and a take profit.
I really like this indicator. But I made it, so of course I would.. NOW FREE. But please consider supporting me by buying my 2 for sale indicators. You can multiply the weight of each indicator used to give more emphasis on it's value when averaging between the 3. Boost fast TEMA and it can move the indicator faster. Boost slow FrAMA and watch it smooth out. I like to use them as open/close lines and set them up so they move quick, but have the FrAMA smooth it out more.
Check out my other ind
Originally made for MT4 now for MT5. It is important to optimize the inputs before use in back test and real trading.
Gold Machine trades XAU/USD. Depending on the time frame used, adjust the inputs accordingly. Try it out on the demo and report back with stars and reviews. This uses break evens and trailing stops. 1 hour is recommended for larger tp and smaller time frames would be less but experiment freely but use a demo first.
Inputs: Move SL to BE Profit Target Trailing Stop Risk

How it works? This EA trades with Stochastic Signal line Cross over low and high levels. Only allows one open trade at a time on the currency you have attached this EA. if Reverse Logic is FALSE will open BUY if Stocha Signal Line Cross below Low Level will open SELL if Stocha Signal Line Cross Above High Level if Reverse Logic is TRUE will open SELL if Stocha Signal Line Cross below Low Level will open BUY if Stocha Signal Line Cross Above High Level Key difference with my other EA " Maste

Индикатор iVeles_Perfect_Oscilator является опережающим и одним из самых лучших осциляторов на сегодняшний день, использует специализированный расчет текущих цен графика. Очень качественно и своевременно показывает смену направления, очень точный подход к уровням перекупленности и перепроданности, что позволяет своевременно принять решение по сделке. Работает качественно на любом ТФ и с любым инструментом. Параметры: Period - период расчетов Average - усреднение МА Method - применяемый мето

В основу алгоритма этого трендового индикатора положен анализ веера сигнальных линий универсального мувинга I . Алгоритм вычисления сигнальных линий выглядит следующим образом. В качестве исходных данных имеем входные параметры индикатора: StartLength - минимальное стартовое значение первой сигнальной линии; Step - шаг изменения периода; StepsTotal - количество изменений периода. Любое значение периода из множества сигнальных линий вычисляется по формуле арифметической прогрессии: SignalPeriod(

Top indicator for MT5 providing accurate signals to enter Trades.
This Indicator will provide pretty accurate trading signals and tell you when it's best to open a trade by giving alerts to buy or sell. Mainly was created to target Volatility Index on Deriv broker however, the Spot Detector Arrow Indicator can be applied to any financial assets(Forex, Crypto, Indices, Volatilities) on MT5 Brokers.
HOW TO BUY Wait for signal Alert to Buy will be sent to your MT5 Terminal Blue arrow facin

Zigzag Indicator For RSI, To easily identify the highs and lows of the rsi signal. It is easier to observe divergent and convergent signals. Default setting: InpRsi =14 //Rsi Period InpDepth =12; // Depth InpDeviation =5; // Deviation InpBackstep =3; // Back Step
If you want open Exness account try this link : https://one.exness-track.com/a/teg5teg5 Dev buy taphu: Ha Van Tan - hatatrata - Trader's profile - MQL5 community Email: tan.ha@outlook.com
FREE
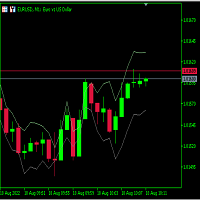
Just learning how to create an indicator from this tutorial .
its just a garbage text to fill the descriptions. Hello there. Hello there Hello there Hello there Hello there Hello there Hello there Hello there Hello there Hello there Hello there Hello there Hello there Hello there Hello there Hello there Hello there Hello there Hello there Hello there Hello there
FREE

Wink IND is an indicator that tell you: -when MACD is saying buy or sell -when RSI is saying buy or sell -work on multi timeframes MT4 Version
by Wink IND: you don't need to have Knowledge about MACD or RSI don't need to check and compare MACD and RSI respectly don't need to check all of timeframes and compare the resaults don't lose time, save more time for your decisions in trading
Wink IND: multi timeframe indicator multi currency indicator show the positions by graphic shapes, arrows an

** All Symbols x All Timeframes scan just by pressing scanner button ** *** Contact me to send you instruction and add you in "123 scanner group" for sharing or seeing experiences with other users. After 17 years of experience in the markets and programming, Winner indicator is ready. I would like to share with you! Introduction The 123 Pattern Scanner indicator with a special enhanced algorithm is a very repetitive common pattern finder with a high success rate . Interestingly, this Winner in

The indicator very accurately determines the levels of the possible end of the trend and profit fixing. The method of determining levels is based on the ideas of W.D.Gann, using an algorithm developed by his follower Kirill Borovsky. Extremely high reliability of reaching levels (according to K. Borovsky - 80-90%) Indispensable for any trading strategy – every trader needs to determine the exit point from the market! Precisely determines targets on any timeframes and any instruments (forex, met

Circadian, üç döviz çifti arasındaki fiyat korelasyonunu kullanarak çalışan üçgen bir arbitraj uzmanı danışmanıdır.
Uzman aynı anda üç çiftin ticaretini yapar; bunlar bir set halinde gruplandırılmıştır. Kümeler, özel bir permütasyon hesaplayıcısı kullanılarak bulunur veya varsayılan seçimden seçilir.
Senkronize bir arbitraj fırsatı aramak için her sete her dakika, yirmi saniye ayrılır, geçerli bir sinyal bulunduğunda set kilitlenir ve üç işlem açılır.
Algoritma, bir setteki tüm çiftleri

** All Symbols x All Timeframes scan just by pressing scanner button ** ***Contact me to send you instruction and add you in "RSI scanner group" for sharing or seeing experiences with other users. Introduction RSI divergence is a main technique used to determine trend reversing when it’s time to sell or buy because prices are likely to drop or pick in the charts. The RSI Divergence indicator can help you locate the top and bottom of the market. This indicator finds Regular divergence for pullba

UR Momenteri
UR Momenter, bir osilatör olarak temsil edilen fiyat hareketinin tükenmesiyle ilişkili olarak fiyatın momentumunu mükemmel bir şekilde hesaplar. Bu nedenle, bu bize potansiyel geri dönüşlerin veya geri çekilmelerin gerçekten erken sinyallerini verir. Bu formül, 2018'de pazar balonu patladıktan sonra keşfedildi.
UR Momenter kullanmanın avantajları:
parametre yok Fiyat hareketini tanımlayan 2 çizginiz var - Fiyatın hareketli ortalama sapmasına bağlı olarak fiyatın Momentumu o

Sayı dizilerinden birine "Orman Yangını Dizisi" denir. En güzel yeni dizilerden biri olarak kabul edildi. Başlıca özelliği, bu dizinin lineer trendlerden, hatta en kısa olanlardan kaçınmasıdır. Bu göstergenin temelini oluşturan bu özelliktir. Bir finansal zaman serisini analiz ederken, bu gösterge tüm olası trend seçeneklerini reddetmeye çalışır. Ve ancak başarısız olursa, bir trendin varlığını tanır ve uygun sinyali verir. Bu yaklaşım, yeni trendlerin başladığı anların doğru bir şekilde belirl

Archi - göstergeler üzerine inşa edilmiş, gelecekte sayıları artacaktır. «Trailing Stop» u «Trailing Position» ve «Step Trailing» ile kullanmak mümkündür. Bir sonraki işlemin hacmini, hem çarpma hem de ekleme yoluyla karsız bir akımla artırma olasılığı vardır. Olumlu işlemlerin karsız olanlara göre üstünlüğüne ulaştıktan sonra, hacim orijinaline geri döner. Archi BasicSettings:
Magic number, tüm açık işlemlerin benzersiz bir numarasıdır. Dikkat!!! Danışman tarihle çalışır, bu nedenle öncekil

10 kopya kaldı - bir sonraki fiyat 600 dolar.
Fiyat 2500 $ 'a ulaşılana kadar artacaktır.
Hediye almak istiyorsanız satın aldıktan sonra bana mesaj atın!
Bayraktar, yenilikçi bir gecelik scalping EA'dır
Expert Advisor, döviz çiftleri ticareti için tasarlanmıştır.
Parametrelerin açıklaması:
START_LOT - N bakiye birimi için ilk lot (FROM_BALANCE). FROM_BALANCE = 0 ise, sabit bir başlangıç lotu kullanılır; STOPLOSS_PCT - maksimum kayıp; TAKEPROFIT_PCT - kar al; LOT_MULTIP

MT5 için Weis Wave Chart Forex bir Fiyat ve Hacim göstergesidir. Fiyat ve Hacim okuması, Richard Demille Wyckoff tarafından oluşturulan üç yasaya dayalı olarak geniş çapta dağıtıldı: Arz ve Talep, Neden ve Etki ve Çabaya Karşı Sonuç. 1900'de R.Wyckoff, analizlerinde dalga grafiğini zaten kullanmıştı. Yıllar sonra, 1990 civarında, David Weis Otomatikleştirilmiş R. Wyckoff'un dalga grafiği ve bugün size David Weis'in dalga grafiğinin evrimini sunuyoruz. Varlıkta üretilen dalga ile ilgili Hacim mik

MT5 için Weis Dalga Tablosu bir Fiyat ve Hacim göstergesidir. Fiyat ve Hacim okuması, Richard Demille Wyckoff tarafından oluşturulan üç yasaya dayalı olarak geniş çapta dağıtıldı: Arz ve Talep, Neden ve Etki ve Çabaya Karşı Sonuç. 1900'de R.Wyckoff, analizlerinde dalga grafiğini zaten kullanmıştı. Yıllar sonra, 1990 civarında, David Weis Otomatikleştirilmiş R. Wyckoff'un dalga grafiği ve bugün size David Weis'in dalga grafiğinin evrimini sunuyoruz. Varlıkta üretilen dalga ile ilgili Hacim miktar

This indicator scans the 1-3 Trendline pattern . The indicator is a 100 % non repaint low risk breakout system . The patterns are formed around swing high and swing lows which make them a low risk pattern with high reward.
PATTERN BACKGROUND The 1-3 Trendline Breakout pattern is formed by four(4) points which are composed of three (3) primary points and the pattern neck. A trendline is always formed by the point 1 and the neck of the pattern . When price breaks out of the trendline formed ,
TRACKINGLEVELS (SUPPORTS AND RESISTANCES)
TrackingLevels is a useful indicator that saves considerable time when a trader starts analyzing a chart. This indicator draw on the chart all the resistances and supports that the market is creating. The resistance and support levels are very important, this levels define areas where there can be a considerable accumulation of sell or buy orders. These are a key areas that every trader must know and keep in mind all the time. This indicator helps the

Drawdown Limit EA Prop Firm trading MT5
If you found this EA, it's probably because you want to get a funded account with a prop firm, but you see a rule that most of traders fear : Maximum Daily Drawdown. I've been through this problem myself as I'm a prop firm trader and I've made a bot to solve this rule, and you can get it to solve this problem too.
How does it work ?
When you first setup this EA, you need to input the initial deposit which corresponds to the size of your funded accoun
Hello friends. I wrote this utility specifically for use in my profile with a large number of Expert Advisors and sets ("Joint_profiles_from_grid_sets" https://www.mql5.com/en/blogs/post/747929 ). Now, in order to limit losses on the account, there is no need to change the "Close_positions_at_percentage_of_loss" parameter on each chart. Just open one additional chart, attach this utility and set the desired percentage for closing all trades on the account. The utility has the following fu
FREE

LAZY TRADER MT5
LIVE SIGNAL - CLICK HERE
SETTING FILES FROM LIVE SIGNAL - CLICK HERE
PRICE WILL INCREASE EVERY 1 TO 2 WEEKS. GETTING IT EARLY GETS YOU THE BEST PRICE.
Lazy Trader was designed to do all of the complex trading for you, so you can you relax on your couch, or sleep the night away. There is no reason to learn how to trade Forex when using Lazy Trader.
YOU DO NEED TO UNDERSTAND RISK AND MONEY MANAGEMENT HOWEVER...... Ok to Be Lazy and Smart, but PLEASE not Lazy a
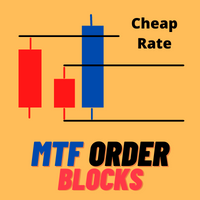
30% OFF ONLY 10 COPIES HURRY UP! 8 LEFT COPIES Very precise patterns to detect High Accurate Order Blocks: It Draw zone after market Structure Breakout with a high Accuracy, institutional orders with the potential to change the price’s direction and keep moving towards it, have been placed. Features Auto Order Blocks Draw MTF Order Blocks Double Signal One Alert Signal Second Long Wick Rejection Signal Market Structure BOS LINE How to show MTF order Block Go on indicator setting at the en

Merhaba; Bu indikatör gerçek hacim seviyelerinin bazı matematiksel hesaplar ile giriş ve çıkış sinyallerinin oluşmasını sağlar.Kullanımı basit ve güvenlidir.Gerçek hacim seviyelerinin ortalamalar ile kesişmesi sonucu al ve say sinyalleri oluşturur. İndikatör parametre açıklamaları: A-PERIOD:Hesaplanması gereken bar sayısını ifade eder. B-GAMMA:0.618 olan bir sabit fibonacci trend ortalaması kullanılır.(En yüksek 0.786 en düşük 0.236 kullanmanız gerekmektedir.) C-VOLUME TYPE:Tick volume sabit ola

Bu ürün kanal ölçeklendirme sayesinde kapanış barlarında sinyal üretir.Bu sinyalleri bir ok sayesinde görselleştirir.Ok rengi işlem yönünü ifade eder.Varsayılan ayarlar H1 periyot için geçerlidir.Her periyot ve ürün için backtest yapabilirsiniz.İndikatörün kod içeriği mümkün olduğunca fiyat hareketlerine uygun bir şekilde uygulanmıştır.Bu sebeple trend başlangıçlarını ve sonlarını iyi tespit eder. Parametre açıklamaları: PER: Hesaplanacak bar sayısını ifade eder. PRO: Kanal genişleme faktörünü h
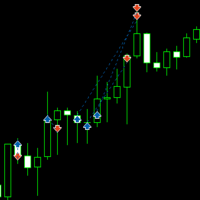
This robot is based on an MACD strategy for trending markets. The description of the strategy can be found on the attached youtube video. The video explains the strategy and shows a basic backtest and optimisation on a few symbols. It is advised to carry out a a backetst and optimisation of your own before using the robot. The video can be found at >> https://www.youtube.com/watch?v=wU_XCM_kV0Y  ;
MetaTrader Mağazanın neden ticaret stratejileri ve teknik göstergeler satmak için en iyi platform olduğunu biliyor musunuz? Reklam veya yazılım korumasına gerek yok, ödeme sorunları yok. Her şey MetaTrader Mağazada sağlanmaktadır.
Ticaret fırsatlarını kaçırıyorsunuz:
- Ücretsiz ticaret uygulamaları
- İşlem kopyalama için 8.000'den fazla sinyal
- Finansal piyasaları keşfetmek için ekonomik haberler
Kayıt
Giriş yap
Gizlilik ve Veri Koruma Politikasını ve MQL5.com Kullanım Şartlarını kabul edersiniz
Hesabınız yoksa, lütfen kaydolun
MQL5.com web sitesine giriş yapmak için çerezlerin kullanımına izin vermelisiniz.
Lütfen tarayıcınızda gerekli ayarı etkinleştirin, aksi takdirde giriş yapamazsınız.