适用于MetaTrader 5的新EA交易和指标 - 58

SUPERTREND; It is a trend following indicator based on the SuperTrend ATR created by Olivier Seban. It can be used to detect changes in trend direction and locate stops. When the price falls below the indicator curve, it turns red and indicates a downtrend. Conversely, when the price moves above the curve, the indicator turns green, indicating an uptrend. Like other indicators, it works well on SuperTrend when used in conjunction with other indicators such as MACD, parabolik SAR, Bollinger Band
FREE

FREE VERSION OF THE PRICE ACTION ADVANCED LEVELS free on demo account. full product: https://www.mql5.com/en/market/product/94338 Accurate horizontal support and resistance levels Accurate for price action analysis. All Markets: forex, stocks, indices, metals, commodities ,and crypto Available for meta trader 5 Adjustable parameters
inputs: For multiple timeframe analysis: adjust "analysis_timeframe" accordingly "depth_of_retrenchments" represents how big the peaks or troughs are. "lookba
FREE

Quantum is a High Frequency EA with relatively lower risk. It trades tens of trades per day but generally the max drawdown is below 15%.
MT5 Version
======== Usage======== :
Symbol: Any Main pairs Timeframe: M15 or higher Recommend Lots: 0.01 per 2000 USD
Note: Grid strategy is alwasy with some risk due to the increasely accumulated risky lots. but the high profit makes such strategy still being popular no matter how forex industry developed.
this is why we spent many years on rese
FREE

EasyBot Bollinger Bands EA EasyBot Bollinger Bands Expert Advisor EasyBot Bollinger Bands is a semi-automatic trading system built for MetaTrader 5, leveraging the renowned Bollinger Bands indicator developed by John Bollinger in the 1980s. The Bollinger Bands consist of three lines: a simple moving average (usually set to 20 periods) as the middle band, and two outer bands calculated by adding/subtracting a set number of standard deviations (typically 2) from the moving average. This indicator
FREE

The CCI Trend Dashboard is an advanced technical analysis tool available that provides a dashboard interface for traders to analyze multiple symbols and timeframes at once. It uses the Commodity Channel Index (CCI) in combination with currency strength and volumes to analyze market trends. The tool is user-friendly and suitable for both beginner and advanced traders. Note: The values are derived from the CCI values of the respective symbol and timeframe using the specified period from the sett

Optimized Trend Tracker OTT is an indicator that provides traders to find an existing trend or in another words to ser which side of the current trend we are on.
We are under the effect of the uptrend in cases where the prices are above OTT ,
under the influence of a downward trend, when prices are below OTT
it is possible to say that we are.
The first parameter in the OTT indicator set by the two parameters is the period/length.
OTT will be much sensitive to trend movements if i

Trading strategy: Scalping. Trading on impulses in automatic trading has been used for a long time and the scheme is not new to traders. It is difficult to catch such moments manually, but the adviser copes instantly. Automated trading uses 2 approaches to trade in such cases: look for pullbacks after impulses. trade in the direction of momentum. The search for entry points is done like this: the adviser measures the rate of price change for which this change should occur, if the conditions for

Fully automated expert advisor. It was developed for quick overclocking of the deposit.
It has a minimum of settings, which makes it easier to set up and speed up the optimization of the EA if necessary. The same settings are used for long and short positions. Thus, the Expert Advisor works equally in both directions. All orders are set with the TakeProfit parameter. And this guarantees the closing of transactions regardless of the quality of the Internet.
My recommendations:
Using a le

" Outro " is an expert in automated " multi-symbol " trading that requires the trader to test on the pair of his choice and modify the entries according to his convenience. This Expert Advisor has been designed with non-optimized inputs, and uses a Martingale system for risk management. It is very important to read the blog post before you start. Enter to the private group . Outro uses two main indicators, Relative Strength Index and Stochastic Oscillator , for input decision making
FREE
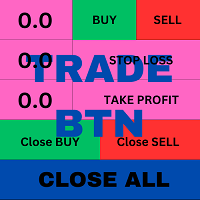
T his is an ON CHART trade management panel. In other words, ON CHART Lot Size, Buy, Sell, Stop Loss, Take Profit, Close Buy, Close Sell and Close All buttons! *IMPORTANT NOTE: Input settings are NOT usable. You can change or insert Stop Loss and Take Profit values only on the chart panel. (See the below video!) This one is MT5 version!
BUTTONS List: 1. Lot Size - (0.01) is default click on it and insert the lot size with which you want to open a trade. 2. Stop Loss - (0.0) is default click on
FREE
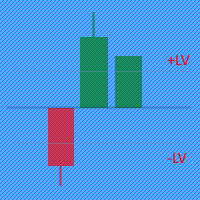
The Price Movement Strength indicator displays the direction and strength of the price change in the form of a candle on each price bar. If the indicator shows the closing level of the candle equal to zero on the current bar, then the price has not changed during bar. If the indicator shows a green candle, then the price of the trading instrument is growing, and vice versa, a red candle signals a price fall. Input parameters: The indicator has two parameters for setting buy/sell levels: BuyLevel
Unlike many other indicators including the moving average indicator, Pivot Point can be a leading indicator. In these systems, the price levels of the previous period are used to determine the critical points instead of relying on the current price performance. Such an approach provides a clear framework for traders to plan their trades in the best possible way.
You can use this method and its combination with the methods you want to build and use a powerful trading setup. MT4 version
Let us k

Line function : Displays the opening line, Stop Loss, Take Profit( 3:1 RR ) on the chart. Risk management : The risk calculation function calculates the volume of a new order taking into account the established risk and the size you want to risk. It allows you to set any Stop Loss size between 3 and 10 pips. Breakeven Button : Brings all open orders to Breakeven. Clear button : Clears the graph and the selected parameters. Trade Button : Execute the idea. Partials Button : Taking partials of al

P Booster Pro is the developed version of P Booster. Pro version allows adjusting 5 parameters: - RiskPerc: p ercent of the biggest lot that is available according to equity. - PriceFellPercent: difference between the choused candle ( WhichCandleM15From ) and the Candle 1 price in percent. - StopLossLevel: Stop loss level in percent point. For example: 30 = 99,7% of the Ask price. - WhichCandleM15From: M15 Candle ID from where the expert will check the PriceFellPercent level and compare it with

Máquina Trader Tendência Count on our trend tracker to carry out your operations on the Mini Index and the Mini Dollar!!! Operational Green is BUY and Pink is SELL!!! Enter the operation after closing the first color block!!! Developed and Tested on the 5 or 15 minute Chart for Mini Index and Mini Dollar!!! Can be used on any chart!!! Editable colors and period!!!
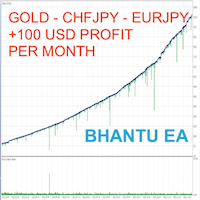
Bhantu is revolutionary trading bot software that seeks to revolutionize the way you trade. It offers a suite of features that can help you maximize your profits in the market. Bhantu's advanced algorithms and automated strategies are designed to analyze and monitor the market, ensuring you always get the best results. Software that can automatically manage your trades in stocks, currencies and other financial products in your trading account based on your preferences. It is based on a combinati

Trend Fibonacci is a unique indicator that combines a power of Fibonacci sequences and ranges. Channel Group: Click Here
How to read:
- There are three zones --> red, gold and green
- Red candlestick = downtrend
- Green candlestick = uptrend
- Gold candlestick = no established trend
Inputs: Per = number of bars used for calculations FirstRatio = first Fibonacci ratio (Or use any ratio you want) SecondRatio = second Fibonacci ratio (Or use any ratio you want)
!! IF YOU PURCHASE TH
FREE

Have you ever wanted to back-test a strategy but never wanted to risk real money? And the thought of using a demo account is exhausting as real time markets develop your skills slowly. This utility will help you develop your strategy faster and will help determine if the strategy works long-term by simulating real trading through back-tests. This will save you time as you can back-test strategies from previous price data. With the new update you can now change your lot-size add take-profit and
FREE
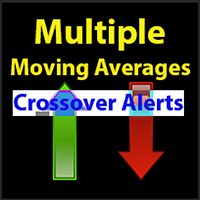
This indicator will identify when Fast Moving Averages (EMA, SMA, or LW) cross Slow Moving Average lines on any timeframe and with any symbol.
When the moving averages cross and price close above or below the crossing, the User will receive an alert via pop-up, push, or email.
Choose any two Moving Averages to cross to receive an alert and the Indicator will also paint the Moving Average Lines and Arrows.
You can choose Exponential Moving Averages (EMA). Simple Moving Averages (SMA) or Lin

This is a rate of change chart from the baseline. features. comparison of max 5 symbols. free baseline with drag. free timeframes of the sub window. reverse chart selectable if you need.
i.e. set symbols "-US100" notes In the sub window, you can't believe datetime on the chart, because the numbers of bars are different. You can check the baseline if you click symbol name. The dragged baseline is temporary. You must set it to indicator's parameter if you need.
FREE

MAGIC BC TRADER
10 copy 49$ Next Price 99 Last Price 500$
Magic BC Trader can be work with any pair and broker
BEST BROKER EXNESS (Pro Account)
BEST PAIRS BOOM 500 - BOOM 1000 - CRASH 500 - CRASH 1000 EURUSD - AUDUSD - GBPUSD - NZDUSD
OPBUY : TRUE/FALSE ) if true then EA will open BUY trades
OPSELL : TRUE/FALSE ) if true then EA will open SELL trades LOTS : set your starting lot size
INDICATOR SETTING :- can be control from setting or you can let it default if you dont know

Jowzy Fx G1 is the indicator designed to detect swings in the direction of the trend and possible reversal swings. The indicator studies several price and time vectors to track the aggregate trend direction and detects situations in which the market is oversold or overbought and ready to correct. This indicator shows Swing that is a strong hint for an excellent entry point and finds immediately with alarm and notification and also has stop loss and entry point with candlestick checking for eas
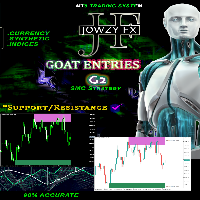
Jowzy Fx G2 support or resistance levels are formed when a market’s price action reverses and changes direction, leaving behind a peak or trough (swing point) in the market. Support and resistance levels can carve out trading ranges. The indicator identifies the Swing High and Swing Low based on X amount of bars ( Period ) defined in the indicator set.
Main Features: Detect the best and most successful point of trend or reversal trend
Easy-to-use and user-friendly indicator NO repaint Scan

Jowzy Fx G4 indicator is a universal tool, suitable for scalping and medium-term trading. This indicator uses an innovative formula and allows you to determine the direction and strength of the trend. is not redrawn, so you can evaluate its efficiency using history data. suitable for M5, M15, M30, H1 and H4 is perfect for all Meta Trader symbols: currencies, metals, cryptocurrencies, stocks and indices
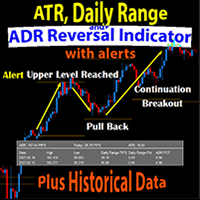
The Daily Range ATR ADR Reversal Indicator shows you where price is currently trading in relation to its normal average daily range. You will received alerts via pop-ups when price exceeds its average daily range. This will enable you to identify and trade pullbacks and reversals quickly.
The Indicator also shows you the Daily Range of Price for the current market session as well as previous market sessions. It shows you the ATR which is the average range of pips that a candle may move in that
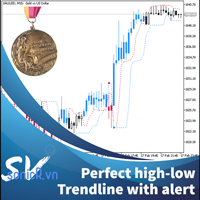
This indicator calculate trendline base on high, low of two period: fast and slow. From that, we have two line for fast signal and low signal. We tested many time on many assets, in most case, when fast signal crossup slow signal, price going up and vice verser. We also add alert function when two signal line crossed. For most effecient, user can change fast and slow period in setting. This indicator is good advice for price move. It better when combine with other trend indicator. For me, i us

An oscillator that shows price changes and identifies areas of overbought and oversold. It can also show trend reversal points. WaveTrend Oscillator is a port of a famous TS /MT indicator. When the oscillator is above the overbought band (red lines) and crosses down the signal (solid line), it is usually a good SELL signal. Similarly, when the oscillator crosses above the signal when below the Oversold band (green lines), it is a good BUY signal. Good luck.

Flags and pennants can be categorized as continuation patterns. They usually represent only brief pauses in a dynamic market. They are typically seen right after a big, quick move. The market then usually takes off again in the same direction. Research has shown that these patterns are some of the most reliable continuation patterns. Bullish flags are characterized by lower tops and lower bottoms, with the pattern slanting against the trend. But unlike wedges, their trendlines run parallel.

This indicator allows you to measure retracements of price between any two points in either direction. It displays the price points, percentages and also displays the extension levels.
User may Modify and Add addition levels and extensions." User may also Add multiple Fibonacci indicators on the chart and change their colors, style and sizes.
Can be used on any timeframe.
This is the only Fibonacci Tool you'll need to measure and trade on Structure.
MT4 Version Available as well.
ADDI
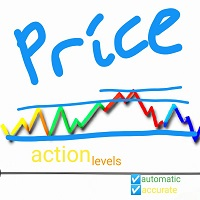
Accurate horizontal support and resistance levels Accurate for price action analysis. All Markets: forex, stocks, indices, metals, commodities ,and crypto Available for meta trader 5 Adjustable parameters I think that's it inputs: For multiple timeframe analysis: adjust "analysis_timeframe" accordingly "depth_of_retrenchments" represents how big the peaks or troughs are. "lookback " represents the most recent number of candlesticks to consider "linecolor " is the color of the lines "lineweig

Renkus Gladiator é um robô de negociação automatizada que utiliza gráficos Renko para análise de tendências e emissão de ordens limit de compra e venda. Com a definição do tamanho do brick (box ou R), é possível determinar a quantidade necessária para confirmar a tendência de alta ou baixa, sem martingale e scalping. Além disso, é possível configurar os stops como dinâmicos (com base no tamanho dos candles) ou fixos (com valores definidos de ganhos e perdas), bem como a posição das ordens limit
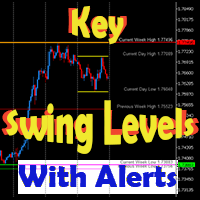
This dynamic indicator will draw the Key Swing High and Low Levels for any symbol on any timeframe!
User may Hide or Show any Level or Label and also Receive Alerts when price returns to that key level via Pop-Up, Push, Email or Sound.
Levels include Current Day High/Low, Previous Day High/Low, Current Week High/Low, Previous Week High/Low and Monthly High/Low.
The Levels are labeled with the Price Point Data Listed next to it for quick easy reference.
You can change the Style, Size an
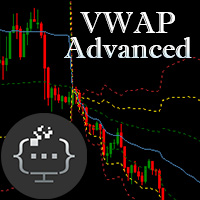
Introducing the Advanced VWAP tool - an essential technical analysis indicator that can help you identify trend directions and locate price extremas with multipliers. Designed to suit the needs of both traders and EA developers, this tool features customizable parameters that allow you to tailor it to your specific trading style. With Advanced VWAP, you have the ability to customize the colors and styles of all bands to your liking. If you don't require any bands, you can simply set their values

A depth of market product is a powerful trading tool that provides a comprehensive view of the supply and demand levels for a particular financial instrument. It provides traders with a real-time display of all the buy and sell orders that are currently available in the market, allowing them to make more informed trading decisions based on the most up-to-date information available. With Valle Depth Of Market , traders can see not only the best bid and ask prices, but also the volume of orders at
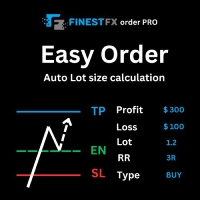
FinestFx order PRO is easy order execution and auto risk management tool developed by FinestFx official Programmer : Mohammed Rafi Just move SL,TP , Entry lines or Type SL,TP on entry columns . Lot are calculated automatically by fill out the loss cut amount. Work with all base currencies Fixed loss amount can be selected. Calculate risk rewards. Market order, limit order, and stop order are selected using buttons Supports FX, CFD, and crypto currency on MT5 Visit the owner website to see it
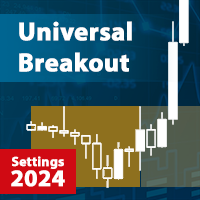
设置和报告 | MT4版本 | 交易時段指標 Universal Box | FAQ Universal Breakout 这是一个专家顾问交易的经典价格范围细分策略. 它可以配置为任何暗示价格从价格走廊退出的策略,这是由时间间隔设置的。 例如:亚洲,欧洲或美国交易时段的极端情况的细分,每日极端情况的细分,甚至是周一的第一个h4蜡烛。 Telegram 聊天: @it_trader_chat 新的 Expert Advisor Prop Master - 在您的交易终端中进行测试 https://www.mql5.com/zh/market/product/115375 在EA设置中,您可以设置EA搜索最高和最低价格点的时间范围。 您还指定顾问将放置挂单的时间。 在指定的时间,EA将在该范围的最高和最低价格水平放置两个挂起的BUYSTOP和SELLSTOP订单。 如果挂起的订单在一段时间内没有被执行(在设置中设置),顾问会删除这些订单并等待下一个交易日。 为了固定利润和可能的损失,使用了TakeProfit,StopLoss,以及将头寸转移到盈亏平衡,追踪止损的功能,以及
FREE

金表是采用先进算法的新开发产品。 自动调整到设定的波动范围。 执行平均交易次数。 它在占据大部分市场时间的价格整合阶段最为有效。 账户类型为对冲。 它适用于 PeakRepainterStrict 指标。 非常适合主要货币对和金属。
可以在这里找到真正的操作监控以及我的其他产品: https://www.mql5.com/en/users/mechanic/seller
输入值
· Open new series – True/False – EA 将打开另一个系列的订单(启用/禁用)
· Trade Buy – True/False – EA 将购买或不购买(启用/禁用)
· Trade Sell – True/False – EA 将出售或不出售(启用/禁用)
· Manage manual orders – True/False – 如果为真,EA 将管理手动订单(启用/禁用)
· Use hedge – True/False – EA 将对冲(买入和卖出)
· 订单评论 – 输入您选择的评论
· Max spread (0-no

The Color Candles Indicator uses custom colors to highlight candles that follow the main market trend, based on the Moving Average. This simplifies the analysis of price movements, making it clearer and more direct. When the price is above the rising Moving Average, candles are highlighted indicating a BUY opportunity. When the price is below the declining Moving Average, candles are highlighted indicating a SELL opportunity.
Input Parameters : Period Method Applied Price
The moving avera
FREE

A simple indicator/tool to display the current timeframe in the center of the chart. The object is automatically moved to the center of the chart whenever the chart size is changed by the user.
Input Parameters :
Font (default is Arial Black) Font Size (default is 50) Font Color (default is Silver, for light theme graphics, change to black or another dark color) Font Transparency (default is 90%)
FREE

Time in Trade Expert Advisor 採用在指定時間開掛單的策略,也使用自動切換的冬夏時間。 出現信號時,交易機器人會打開等量的掛單進行買賣。 用於交易的時間範圍為 5 分鐘。 掛單的觸發因素是價格急劇變化,具體取決於: 開/關交易時段; 發布重要經濟指標; 交易者數量最多的時間間隔。 用戶可以使用以下設置: Open Price —根據 BID 和 AKS 價格設置訂單開倉水平; Stop Loss - 價格出現意外變動時的止損水平; Trailing - 浮動止損水平; Volume - 固定交易量(僅對 RISK = 0 有效); RISK - 風險水平百分比: 0 - 無風險設置。 將應用固定量; 1 及以上 - 自由資金的風險水平百分比。 HOUR_n - 在指定時間(服務器時間)啟用/禁用交易: true - 允許; false - 禁用。 測試以 3 毫秒的延遲、1/40 的槓桿和 70 的風險水平進行。 初始存款 - 3000 RUB 輸入參數 EUR/USD : Open Price - 120; Stop Loss - 140; Trailing
FREE

价格DNA是一个趋势指标,它利用复合比率加权移动平均线来减少滞后,并能早期发现趋势。该指标不会重绘,可应用于任何时间框架的任何金融工具。
Price DNA是如何工作的? 该指标将在图表上显示多个 波浪 ,表明当前交易的方向。 五个绿波或五个红波分别表明强烈的看涨或看跌趋势。 根据您的个人交易风格,您可以选择在所有波浪或特定数量的波浪表明趋势反转时开仓或平仓。看涨波和看跌波的数量将始终显示在您终端的左上角。
设置 通过调整每个单独的DNA波的周期,你可以使价格DNA指标适应你的交易风格--无论是更激进还是更谨慎。 第一波周期。第一波的周期 第二波时期。第二波的周期 第三波时期。第三波的时期 第四波时期。第四浪的时期 第五波时期。第五浪的周期 乘法器。复合比率乘数
测试和安装 要测试这个指标,你只需从MetaTrader市场标签中下载演示版,并在 策略测试器中 使用它。购买后,你可以在 导航器 窗口内选择该指标,并将其拖到你想要的图表上。 如果你对该指标或其设置有任何问题或疑问,请随时联系我。

(谷歌翻译) 该指标实现了由 John Welles Wilder Jr. 开发的原始“ Average True Range (ATR) ”,如他的书中所述—— New Concepts In Technical Trading Systems [1978] 。 它使用 Wilder 移动平均线 ,也称为 平滑移动平均线 (SMMA) ,而不是 简单移动平均线 (SMA) 用于 MetaTrader 的 内置 ATR 指标。 根据他书中的描述,应用的默认周期为 7,而不是 14。 (谷歌翻譯) 該指標實現了由 John Welles Wilder Jr. 開發的原始“ Average True Range (ATR) ”,如他的書中所述—— New Concepts In Technical Trading Systems [1978] 。 它使用 Wilder 移動平均線 ,也稱為 平滑移動平均線 (SMMA) ,而不是 簡單移動平均線 (SMA) 用於 MetaTrader 的 內置 ATR 指標。 根據他書中的描述,應用的默認週期為 7,而不是 14。 (Original te
FREE

引入趋势热情指标 (TEI),这是在交易大厅实现利润最大化的终极工具。
这一创新指标结合了趋势分析的力量和市场情绪的兴奋,为交易者提供了在瞬息万变的金融市场中的独特优势。
TEI 使用先进的算法来分析金融工具的潜在趋势和交易者识别高利润机会的热情。 这使交易者能够利用趋势和交易者情绪的综合力量,以最小的风险确保持续的利润。
无论您是经验丰富的专业人士还是新手,TEI 都是希望最大化收入并保持领先地位的任何人的理想工具。 结合 RSI 来确定何时退出交易,它可以让您在市场上占据优势。 立即尝试,开始进行更明智、更有利可图的交易!
该指标适用于所有时间范围并且不会重新绘制。
附加的屏幕截图中提供了更多信息和示例。
请随时与我们联系以获取更多信息。

Crash Wizard Indicator works on 1 Minute time frame of Crash 500 and Crash 1000 ONLY. This indicator will plot a Red (x) on the Drop candle . it will plot Green arrows as BUY entry signal and will plot orange (x) as multi-exit points. You the indicator is 85% Accurate . you may use it together with Price action. NOTE: To use the indicator , make sure you have an account with Deriv the only synthetics indices broker. DONT use it on any other assets.

FRB Trader - Our mission is to provide the best support to customers through conted and tools so that they can achieve the expected results
FRB Strength - Indicator shows the current strength of the asset between buyers and sellers. - It can only be used by brokerage houses that report data on trading volumes, such as B3. In the forex market it is not possible to use.

Provided Trend is a complex signal formation indicator. As a result of the work of internal algorithms, you can see only three types of signals on your chart. The first is a buy signal, the second is a sell signal, and the third is a market exit signal.
Options: CalcFlatSlow - The first parameter that controls the main function of splitting the price chart into waves. CalcFlatFast - The second parameter that controls the main function of splitting the price chart into waves. CalcFlatAvg - Par
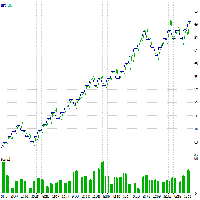
Strategy description The idea is to go with trend resumption. Instruments Backtest on XAUUSD shows profitability over a long period even without any specific optimization efforts. However applying optimization makes it even better.Backtest details: Simulation Type=Every tick(Most accurate) Expert: GoldScalper Symbol: XAUUSD Period: H1 (2020.01.01 - 2023.02.28) Inputs: magic_number=1234 ob=90.0 os=24.0 risk_percent=2.64 time_frame=16385 Company: FIBO Group, Ltd. Currency: USD Initial Deposit: 100
FREE

THE SWAP KING. Be the Bank.
THE SWAP KING is a multicurrency bot that is simple but ingenious. The Bot was created two years ago and has been growing my account since then. If you have traded with CFDs before you will know that you either need to close all trades before midnight and weekend OR you will be charged a hefty fee for keeping the trade(s) open. Unfortunately that leaves us traders only three options: scalping, spending lots on spreads and commissions for closing and opening trades

Using this robot, you can avoid sudden stops without setting a limit, especially during news. This robot will not enter the trade until the trigger is taken in the specified time frame. The amount of risk and volume of transactions is completely dynamic and customizable. Also, by specifying different goals, after reaching each of the targets, it will automatically become part of the close volume. Let us know what you think about correcting this indicator. If accepted, it will be applied immediat

Impulse Fibo indicator is used to determine price levels after some price impulse occurs. How to use it you can see in screenshots and video. In the indicator setup you can fix two different setups for two different patterns. For drawing convenience also two different rectangles can be easy put on the screen to draw support/resistance levels. .
Inputs Draw pattern 1 Line color - choose color from dropdown menu
Line style - choose style from dropdown menu
Line width - enter integer number 1,2

Perfect Sniper! is a triple indicator with support resistance detection, downtrend channel, uptrend channel Bands included! where he hunts the rebounds in the red lines for sale, in the green lines mark purchase, in the lower bands that are the breaks gives another second entry either buy or sell, perfect to take advantage of the double entrance, It is used in any temporality, It is used to scalp and long on h1 or h4 to D1. It works for Forex markets, All pairs. It is used for the synthetic inde

BandSniper! band indicator , programmed %100 to hunt rebounds on the bands both bounce for the downside and bounce for the upside,, It serves to hunt trends too! where you can see in the photo marked with arrows the buy and sell signals. can be used at any time, Ideal for scalping and long h1 or h4! works for all Forex pairs! and for all pairs of synthetic indices ! World Investor. Good profit
One of the basic needs of every trader is to have a checklist to enter every position. Of course, using pen and paper may not be convenient forever. With this indicator, you can have a small checklist next to the screen for each of your charts and use it for better use in your trades.
By pressing the r button, you can return everything to the original state.
MT4 Version
This indicator will have many updates and special settings will be added to it.
You can contact us via Instagram, Telegram
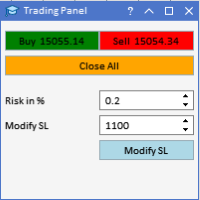
Automatic Trade Calculation Panel One-Klick-Trading Automatic calculation of Lot sice Atuomatic calulation of Stop-Loss and TakeProfit Up to 3 partial closings Trailingstop (Stop-Loss moves automatically) The lot size is calculated by the previously determined risk (e.g. 1.0% of the account size) and the distance of the Stop Loss from the entry point. The distance from the Stop Loss to the entry point results from the ATR indicator multiplied by a freely selectable factor. The Stop Loss and

You can use this tool to create as many pending orders (limit order) as you want in one button press. All inputs must be in points. You can use this useful tool when such as FED speech times. User Inputs:
MagicNumber = Magic number DeviationPoint = Deviation point number for limit orders Level = You can choise how many level do you want to create pending orders. BuyOrder = true/false SellOrder = true/false StartDistance = Distance between each level. StepDistance = Distance to be added incremen
FREE
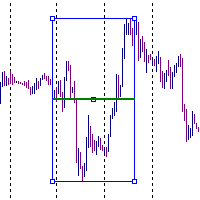
It is just an alternative fibo lines. mt4 have is a very strange drawing of fibo lines, this utilites was written for mt4, but for mt5 it may not be particularly useful. A simple Box (Rectangle) graphic element with adjustable levels binding: it is possible to specify up to 17 custom levels, all rectangles on the chart with the given prefix in their name are processed. Levels are specified in % of the height of the rectangle. A convenient graphical element for analyzing charts by growth-correct
FREE

!!!ATTENTION TRADERS!!! Bug hunters will get an EA of their choice FOR ABSOLUTELY FREE!!! If you purchase any of my EAs and happen to find a bug, report it to me and I'll gift you one of my EAs here on MQL5 for ZERO dollars, no strings attached! Download the entire trade journal in csv format here → drive.google.com/file/d/1WHeIefkiRhen09wmUFzxj37BGHLDh9c2/view I recommend you to open it with LibreOffice Calc if Microsoft Excel gives you an error.
Description: Dualis is an EA that utilizes a

!!!ATTENTION TRADERS!!! Bug hunters will get an EA of their choice FOR ABSOLUTELY FREE!!! If you purchase any of my EAs and happen to find a bug, report it to me and I'll gift you one of my EAs here on MQL5 for ZERO dollars, no strings attached! Download the entire trade journal in csv format here → drive.google.com/file/d/1_KMP__aE8Wc8RFNS4cVNoatu-J6n63ov/view I recommend you to open it with LibreOffice Calc if Microsoft Excel gives you an error.
Description: Golden Mountains is a next-gen t

You can send MetaTrader screenshot easily to your identified telegram channel via press the send button that on the chart. TelegramBotToken: Telegram API credentials. You can create API credentials on my.telegram.org web page ChatId: Your telegram chatId. Secreenshots will be sending this channel - Please do not press the button repeatedly. This may cause your bot or ip address to be blocked. - You have to add telegram api address ( https://api.telegram.org ) in Option > Expert Advisors > Allow
FREE

MACD (short for M oving A verage C onvergence/ D ivergence) is a popular trading indicator used in technical analysis of securities prices. It is designed to identify changes in the strength, direction, momentum, and duration of a trend in a security's price.
History Gerald Appel created the MACD line in the late 1970s. Thomas Aspray added the histogram feature to Appel's MACD in 1986.
The three major components and their formula 1. The MACD line: First, "PM Colored MACD" employs two

The awesome oscillator is a technical indicator that is used within the financial markets to confirm or disprove trends on price charts. These charts compare current data to historic data with the aim of predicting momentum in the markets. The expert relies on this indicator.
The EA is based on the step: 0.0025 with the possibility of constant correct. (see inputs parameters: Round level correction)
1.6000-------------------------------------------------------------------------------------

EA MAGIC SAND MT5
SETTING
Trade Buy - if false then EA will not take any BUY order
Trade Sell - if false then EA will not take any SELL order
Open New Series :- if false EA will not open new series
First Entry
First Entry - TRUE
Reverse Entry 1 - if TRUE EA will take opposite direction trade Example if indicator signal is buy then EA will place sell order for FIRST ENTRY
Fix Distace - distance between each trade for FIRST ENTRY
Second Entry
Second Entry - TRUE
Reverse Entry 2

With dynamic Moving average, you can estimate the price movement, predict the next trend of price and have a better decision. Parameters setup: Period start <= Period Stop Period start >= 1
Maximum lines is 100 You can customize Moving average method: Simple averaging, Exponential averaging, Smoothed averaging, Linear-weighted averaging and price to apply: PRICE_CLOSE: Close price
PRICE_OPEN: Open price
PRICE_HIGH: The maximum price for the period
PRICE_LOW: The minimum price for the period
The Scalping Project EA follows a scalping breakout strategy. It trades the breakouts from relative highs and lows. For the entry stop orders are used for the fastest possible execution. Profits can be secured by the adjustable trailing stop. Since the strategy works with small average profits it is highly suggested to trade with a low spread and commission broker. Trading costs are crucial here! The backtests shown in the screenshots were done with the default settings. There might be better or
ONLY 3 COPIES OUT OF 10 LEFT AT $299! After that, the price will be raised to $349. IMPORTANT! Contact me immediately after the purchase to get instructions and a bonus! Advanced Fibo levels is a trading robot for the trading on forex. This is a Fibonacci system that designed to trade for most popular Fibonacci strategy that's completely automated. Warning:
I only sell EA's through MQL5.com. If someone contacts you saying it is me trying to sell you something, they are a Scammer. Block and rep

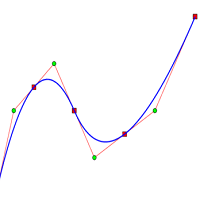
Fit line supports to extrapolation next movement of market, support for buy/sell decision. Indicator using spline algorithm to extrapolation. You can change number of spline with parameter "PointsNumber" and number of extrapolation point with "ExtrapolateBars". Eextrapolation points will be save into csv format, with prefix in parameter "PointsPrefix", and store in folder File of Data Folder.

Fight Club GBPUSD is a trend trading EA that has stood the test of time with a lot of positive years. it trades Long or Short with a specified percentage risk. The EA will set lot size, stop loss and take profits and timed exit. Inputs: Percentage risk Tips: - Sometime is better to trade with small risk and participate in many markets.
- The key to Algo trading is letting the EA do its thing. Try it, add this EA to your portfolio. Please leave a review or a comment. :)

EURUSD M5 Set -> start 01:00 | end 04:00 | TP3 | Pending Distance -100 | Multiplier Pending 150 | Risk% 0.1 | Max Orders 5 - Recommended Deposit 1.000$
"like all expert advisors, LL Night Scalper EA works for you, but you can't always leave it alone. use it with care and attention, choose a time slot and decide your money management first. the best results are obtained by using with care, avoiding important news that generate large movements and keeping the EA off on high volatility days.

Magnetic levels for MT5 is a great addition to your trading strategy if you use support and resistance levels, supply and demand zones. The price very often gives good entry points to the position exactly at the round levels and near them.
The indicator is fully customizable and easy to use: -Choose the number of levels to be displayed -Choose the distance Between The levels -Choose the color of the levels.
Can be added to your trading system for more confluence. Works very well when combin

交易头寸和回测工具:
“交易头寸和回测工具”又称“风险收益比工具”,是一款全面而创新的指标,旨在提升您的技术分析和交易策略。 风险工具是外汇交易中有效风险管理的全面而用户友好的解决方案。它具有预览交易头寸的能力,包括入场价格、止损(SL)和获利水平(TP),为即将进行的交易提供透明的视图。用户友好的面板配备了自动余额和自定义余额选项,以及自动手数和风险计算。它支持各种交易预览,包括市场买入和卖出、买入止损和卖出止损订单。该工具包括高级的风险收益比特性,允许在图表上任意定制移动,包括买入和卖出设置。交易信息的智能显示包括关键细节,如开仓手数、止损、TP和订单类型。它还提供了在移动SL或TP水平时自动调整风险的便利性,一个按钮将当前价格吸引过来的功能,以及一个热键用于轻松隐藏和显示风险工具。此外,该工具提供了进行彻底分析交易策略的回测能力。
特点:
- 预览交易头寸,包括入场价格、止损(SL)和获利(TP)水平的详细信息。 - 用户友好的面板:提供自动余额和自定义余额。 - 自动手数计算和风险计算。 - 各种类型的交易预览:市场买入和卖出、买入止损和卖出止损订单等。 - 高
FREE
MetaTrader市场是一个简单方便的网站,在这里开发者可以出售自己的交易应用程序。
我们将帮助您发布您的产品,并向您解释如何为市场准备您的产品描述。市场上所有的应用程序都是加密保护并且只能在买家的电脑上运行。非法拷贝是不可能的。
您错过了交易机会:
- 免费交易应用程序
- 8,000+信号可供复制
- 探索金融市场的经济新闻
注册
登录