MetaTrader 5용 새 Expert Advisor 및 지표 - 58

To download MT4 version please click here . - This is the exact conversion from TradingView: "Trend Direction Force Index - TDFI [wm]" By "causecelebre". - This indicator uses multiple levels of averaging to detect trend strength. - You can optimize filter low and filter high levels to achieve best results. - You have access to buffers to use in EAs. - This is a light-load processing and non-repaint indicator. - You can message in private chat for further changes you need.
Sylvan Crash 500 Arrows!! MT5
*Only use this on Crash 500 Market. *Only for the 15M Chart. *Sells only. *This doesnt redraw or repaint but the candle needs to close for the arrow to print permanently, it does print on candle open. *It doesnt get you at the tip of highs but instead as soon as price slows down or drops from its overbought parameters. *Do not change input settings as this is already optimized.

50% Off Today Only! Price Goes Back Up at 11 PM (EST)
Marketkeys Trade Manager EA for MT5: Your Pathway to Forex Trading Mastery
What Traders Are Saying: "Much better than lots of other trade managers I've tested..." – R Vdr "Saves me time from manually calculating lots sizes and risks...amazing support." – Richard Obi Efficiency and precision are paramount in Forex trading. Marketkeys Trade Manager EA for MT5 offers just that - a seamless interface combined with robust risk management tools

Cerberus the Equity Watcher는 귀하의 계정 자산을 지속적으로 모니터링하고 잘못된 EA 또는 재량 트레이더인 경우 감정적 행동으로 인해 발생하는 주요 손실을 방지하는 위험 관리 도구입니다. 버그가 있을 수 있거나 예상치 못한 시장 상황에서 잘 수행되지 않을 수 있는 EA에 의존하는 체계적 거래자에게 매우 유용합니다. Cerberus를 사용하면 최소 자산 가치와 (선택적으로) 최대 가치를 설정할 수 있습니다. 둘 중 하나에 도달하면 모든 위치가 평평해지고 모든 보류 중인 주문이 닫히고 모든 EA가 "죽습니다". 모든 위치를 평평하게 하면 알림이 사용자 휴대폰으로 전송되고 명확한 메시지가 화면에 표시됩니다. "평평화" 이후에 Cerberus는 주식 가치를 계속 주시하고 다시 초기화될 때까지 추가 거래 시도를 중단합니다. Cerberus가 수행하는 모든 작업은 화면에 명확하게 표시되고 Expert Advisor 탭에 보고되며 사용자에게 알림이 전송됩니다. 사용자의 실수
Breakout Momentum is an automated scalper for EURUSD. Its strategy takes advantage of "false breakout", "breakout", and "raids on liquidity" above and below current marketplace prices. It is effective in both raging and trending markets. It shows promising results during backtesting using "every tick based on real tick" mode. it is also proving itself on a real account. Check Live Signal on Live Signal 1 - EURUSD
Where does it work the best? The default parameters are optimized to suit th

표준편차를 기반으로 하며 "Octopus"를 기반으로 구축된 다중 통화 거래 로봇. 이 로봇은 내 개발 중 최고로 간주될 수 있으며 Forex 거래에서 잘 입증된 모든 것을 포함합니다. 이 로봇은 초보자와 숙련된 트레이더 모두에게 적합합니다. VPS 서버와 하나의 통화 쌍 "EURUSD", M15 시간대에 트레이딩 봇을 설치하세요. 더 이상 조작할 필요가 없습니다. 최소 보증금 $1000, 레버리지 1:500
*두 번째 버전을 선물로 받으려면 구매 후 저에게 편지를 보내주세요. If you need a discount, then write me in private message
신호: https://www.mql5.com/ru/signals/1794581
입력 매개변수:
SD_TIMEFRAME - 신호 검색 기간;
SD_APRICE - 가격 유형;
STDDEV - 최적화를 위한 매개변수. 시작 10, 단계 10 끝 1000;
AVSD_PERIOD -
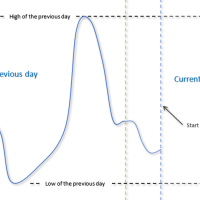
이 Expert Advisor는 수동 및 반자동 거래를 위한 유틸리티 클래스에 속합니다. "오늘의 극한값에서 보류 중인 주문" EA 는 전날의 극한값에 두 개의 보류 중인 주문을 배치합니다. 매개변수 " 대기 중인 주문: ... "를 사용하면 대기 중인 주문 유형을 선택할 수 있습니다: " Buy Stop 및 Sell Stop " 또는 " Buy Limit 및 Sell Limit " . 극단 '낮음' 오프셋은 아래쪽으로 만들어집니다). " 새로운 대기 중 -> 이전 항목 삭제 "를 " true "로 설정하면 이 EA에서 이전에 삽입한 대기 중인 주문을 먼저 삭제한 다음 새 주문을 넣습니다. EA에는 두 가지 작동 모드가 있습니다. 일일 바 시작 시(" 사용 시간 "을 " 거짓 "으로 설정해야 함) 또는 지정된 시간 시작 시간::시작 분에 보류 중인 주문을 넣을 수 있습니다. ("

Ichimoku Trend Alert is the Ichimoku Kinko Hyo indicator with Alerts and signal filters.
Ichimoku Trend Alert features: Optional check of Ichimoku cloud, Tenkan sen(Conversion Line), Kijun sen(Base Line), Senkou span A, Senkou span B, and Chikou span relative to price, and more. Popup, email, and phone notification alerts for selected symbols and timeframes.
There are 9 classic Ichimoku trend filters you can enable/disable in settings: Price/Cloud Order: Checks the price position relative
FREE

For MT4 version please click here . This is the exact conversion from TradingView: "Range Filter 5min" By "guikroth". - This indicator implements Alerts as well as the visualizations. - Input tab allows to choose Heiken Ashi or Normal candles to apply the filter to. It means it is a (2 in 1) indicator. - This indicator lets you read the buffers for all data on the window. For details on buffers please message me. - This is a non-repaint and light processing load indicator. - You can message in p

All about Smart Money Concepts Strategy: Market struture: internal or swing BOS, CHoCH; Orderblock; Liquity equal; Fair Value Gap with Consequent encroachment, Balanced price range; Level with Previous month, week, day level or in day level (PMH, PWH, PDH, HOD); BuySell Stops Liquidity (BSL, SSL); Liquidity Void Long Wicks; Premium and Discount; Candle pattern ... "Smart Money Concepts" ( SMC ) is a fairly new yet widely used term amongst price action traders looking to more accurately navigate

Trading strategy: Scalping by price speed. The Expert Advisor is based on a complex trading system based on high price fluctuations. The essence of the strategy is that the expert determines high price fluctuations on the chart using complex mathematical calculations and then, if there are good moments to enter the market, the adviser opens pending orders. The EA uses BuyStop and SellStop pending orders. Trading is conducted on the H1 timeframe. The EA does not use Martingale, Grid and other str

XE Forex Strengh Indicator MT5 displays visual information about direction and strength of a signal for current pair and chosen timeframes (M5, M15, M30 and H1). Calculations are based on multiple factors and results are shown as a colored panel with scale bar, numerical values and arrows. There are also displayed values of current price and spread on the pair. There can be activated an alert (as a mail or pop-up window with sound) for each available timeframes which send a message when the dir
FREE

Magic Trend
This MT5 indicator is a Moving Average with 3 signal colors. The 3 input parameters on this Indicator give you a chance to set any Moving Average of choice. A combination of 2 different exponential moving averages, relative strength index, commodity channel index, and William's percent range provide the signals.
White color = Null/No/Exit Signal Green color = Buy Signal Red color = Sell Signal
Point To Note: Confirm the color change only after the current candle closes to avo
FREE

Pivot points have been a trading strategy for a long time, originally used by floor traders. Using this method, you can understand where the market is going in a day through a few simple calculations.
The pivot point in the pivot point method is the turning point of the market direction during the day. A series of points can be obtained by simply calculating the high, low and closing price of the previous day. These points may form key support and resistance lines. The pivot point, support an
FREE

The GRat_OrderExport EA exports trades made in the MT5 (manual or any other Expert Advisor), which can later be imported by: GRat_BinanceImpor t or GRat_BybitImport or GRat_Crypto tool in order to copy trades to the crypto exchange; using the GRat Order Exchange library (in particular, by the GRat_OrderImport EA) in order to copy trades to another MT5 terminal or to another correlating symbol of the same MT5 terminal; using GRat_OrderImport (MT4) in order to copy trades to MT4 termina
FREE

The HL-Plus Expert Advisor has many settings for trading, the ability to trade one lot or a set of orders on a grid, the ability to work with a loop of orders, it is possible to increase the number of orders according to a given algorithm, as well as reduce the number of orders based on accumulated profit, there is also a functionality Expert Advisor settings for trading on a given trend. https://www.mql5.com/ru/signals/1749787?source=Site +Signals+My

This indicator is stand alone version from MP Pivot Levels (All in one) containing Woodie Pivots. Woodie’s pivot points are made up of multiple key levels, calculated from past price points, in order to frame trades in a simplistic manner. The key levels include the ‘pivot’ itself, and multiple support and resistance levels (usually up to three each). Traders use these levels as a guide for future price movements when setting up trades.
The pivot : (Previous high + previous low + 2 x previou
FREE

Mini One for All Trend Scanner is a trend following multi-symbol indicator that can be used with any input: forex, stocks, commodities,... The panel shows three indicators and six symbols with the trend for every pair (symbol/indicator): up, down or no trend. The indicators are: Average Directional Movement Index (ADX) Moving Average Convergence Divergence (MACD) Relative Strength Index (RSI) You can change quickly the chart by clicking any one of the symbol button in the panel. This feature
FREE

This indicator is stand alone version from MP Pivot Levels (All in one) containing Demark's Pivots.
Calculations: PP = X / 4 R1 = X / 2 - LOWprev S1 = X / 2 - HIGHprev Uses: When the pair currency price may change the direction of movement. Possible constraints of support and resistance that creates plateaus for the currency pair prices. Tendency identification by comparing the present prices according to current day's pivot point and also the prior day's pivot points. ___________
FREE

This indicator contains Pivot Levels of: Traditional Fibonacci Woodie Classic Demark Camarilla Calculation periods can be set to auto / Daily / Weekly / Monthly / Yearly. Number of Levels are editable. Options to hide level labels and price labels. Pivots Points are price levels chartists can use to determine intraday support and resistance levels. Pivot Points use the previous days Open, High, and Low to calculate a Pivot Point for the current day. Using this Pivot Point as the base, three

This EA created for GBPUSD on H1. The strategy is a martingale. It has been back tested since 2015-01-01 till now on ICMarkets raw account. The minimum deposit is $1,000 and maximum should not be over $10,000 because its a Martingale. Recommended account is ECN or Raw. its a scalp EA so for sure the spread would be matter. Lot Size built up with percentage (%) that means it calculated according Stop Los and percent of deposit.
FREE

The Indicator indicator draws 2 clouds based on Bollinger Bands indicator values. The upper cloud is formed by the upper lines values and the lower cloud by the lowers lines values. The indicator allows to change the Bollinger Bands parameters and the clouds colors the period of the base line and the deviations of each Bollinger Bands instance. The indicator holds 5 buffer index as follow: [0] - Outer values of the upper cloud [1] - Inner values of the upper cloud [2] - Base/Center line values
FREE
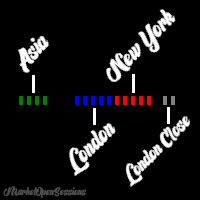
MarketOpenSessions is an indicator helps as a visual clue for which market session is at the time being. If you consider killzone, market open/close as important factor, this indicator would help you reduce effort in converting from one time zone to another. It has the following features 2 display styles: section (as colored line), and histogram 4 major configurable market sessions i.e. Asia, London, New York, and London-Close session. In additional to end of trading session of the day. Female s

The Indicator indicator draws 2 clouds based on Donchian Channels indicator values. The upper cloud is formed by the upper lines values and the lower cloud by the lowers lines values. The indicator allows to change the Channels parameters and the clouds colors the period of the base line and the multiplier of each Donchian Channels instance. The indicator holds 5 buffer index as follow: [0] - Outer values of the upper cloud [1] - Inner values of the upper cloud [2] - Base/Center line values [3
FREE

Welcome to SMC Structure Shift EA for MT5 This automatic trading system works on a simple but efficient smart money concept, which consists in identifying the current market structure and a bias, finding the last high and low and open a position on the continuation of the trend.
No martingale or grid systems are used with this EA.
Only pending orders are placed depending on an identified Bias.
There is always only one trade open at a time, which makes this strategy safer.
Each position

Trade Aide is an MT5 utility to help Forex traders easily open their trades, calculate the correct position size, automatically manage open positions, or limit daily losses. All of this using just a few clicks or keys. The overall purpose of Trade Aide is to allow you, the trader, to solely focus on your technical analysis and setups , instead of worrying about calculations, setting the Stop Loss to Break Even, or any other trade management activities.
How does Trade Aide?
If you norma
FREE

The Indicator indicator draws 2 clouds based on Envelopes indicator values. The upper cloud is formed by the upper lines values and the lower cloud by the lowers lines values. The indicator allows to change the Envelopes parameters and the clouds colors the period of the base line and the deviations of each Envelopes instance. The indicator holds 5 buffer index as follow: [0] - Outer values of the upper cloud [1] - Inner values of the upper cloud [2] - Base/Center line values [3] - Inner valu
FREE

The Indicator indicator draws 2 clouds based on Keltner indicator values. The upper cloud is formed by the upper lines values and the lower cloud by the lowers lines values. The indicator allows to change the Keltner parameters and the clouds colors the period of the base line and the deviations of each Keltner instance. The indicator holds 5 buffer index as follow: [0] - Outer values of the upper cloud [1] - Inner values of the upper cloud [2] - Base/Center line values [3] - Inner values of
FREE

Советник для, перевода позиции в безубыток + трал. Сделан специально для работы на Мосбиржи с учётом удаления позиции при клиринге и последующем её открытии по новой цене. После клиринга, советник тралит учитывая реальную цену открытия позиции, а не ту которая получилась после клиринга. Советник может работать на любых рынках. На счетах HEDGING советник будет переводить в БУ и тралить каждую позицию, отдельно.
Так как демо версию советника можно запустить только в тестере стратегий , а этот

100 % PER MONTH PROFIT---- MY NEW SIGNAL HERE -------> https://www.mql5.com/en/signals/2162238?source=Site+Signals+My#
The Commodity Channel Index (CCI) measures the current price level relative to an average price level over a given period of time. CCI is relatively high when prices are far above their average. CCI is relatively low when prices are far below their average. Using this method, CCI can be used to identify overbought and oversold levels.
You can set the period of CCI.
The i

Do You Like Catching 100+, 500+ Pips In Seconds, Trading During High Impact News Like NFP, and CPI..?
I have been trading news for 2 year with my mentor Raja Banks, playing the Buy Stop, Sell Stop pending orders.
In normal news events price shots straight-down or straight-up based on the data of the event, and sometimes it whipsaws up and down.
As a manual trader, somedays I would miss out on securing big profits because price moved too quick, and retraced back to hit my Stop Loss, or eve

This Renko is: Live : constantly updated on the market prices Dynamic : updating on each new ATR value Backtestable : Generating the chart during backtest, allowing Real Ticks Accuracy and Time Period Accuracy Guppy Built-in : GMMA with 12 EMA built-in This is what you are looking for! RENKO A Renko chart is a type of chart, developed by the Japanese, that is built using price movement rather than both price and standardized time intervals like most charts are. It is thought to be named a

이 지표는 트레이더가 시장의 방향을 식별하는 데 도움이 되도록 개발되었습니다. 트레이딩에는 세 가지 유형의 움직임과 UPTREND, DOWNTREND 및 SIDEWAYS가 있습니다. 사이드웨이 시장 움직임은 대부분의 트레이더가 갇히는 곳입니다. 통합, 이것은 단순히 방향이 없음을 의미합니다. 스캘퍼에게 이것은 자산 클래스가 이 기간에 있는 시기를 식별하는 방법을 알고 있는 경우에만 이점이 될 수 있습니다.
추세를 식별하기 위해 괭이를 개발하려는 시도는 이 지표의 모든 것입니다. 가격이 녹색 점 위에 있을 때 고수하고 2개의 연속 점이 발생한 후 매수 거래를 하거나 가격이 빨간색 점 아래에 있을 때 매도 포지션에 집중합니다. .
내가 이 지표에서 한 것은 시장이 범위 내에 있을 때, 가격이 빨간색 점 아래에 있지 않을 때, 가격이 녹색 점 위에 있지 않을 때 판매하지 않는 것, 구매하지 않는 것을 피하는 것입니다.
내 항목의 대부분은 가격이 점보다 높을 때까지 기다린 다음
FREE

다중 시간 프레임 이동 평균 OSW
(메타트레이더 5)
이 표시기를 사용하면 모든 유형의 구성에 대한 이동 평균을 추가할 수 있습니다. 단, 시간 프레임에 있는 경우 더 높은 수준에서 추가할 수 있다는 차이점이 있습니다(예: 5분 시간 프레임에 있는 경우). 15분, 1시간, 4시간의 시간성 20의 이동 평균 지수를 보고 싶다면 지표 메뉴에서 올바른 매개변수를 구성해야만 지표 이미지에 표시된 대로 볼 수 있습니다. 다중 시간 프레임 이동 평균 OSW
(메타트레이더 5)
이 표시기를 사용하면 모든 유형의 구성에 대한 이동 평균을 추가할 수 있습니다. 단, 시간 프레임에 있는 경우 더 높은 수준에서 추가할 수 있다는 차이점이 있습니다(예: 5분 시간 프레임에 있는 경우). 15분, 1시간, 4시간의 시간성 20의 이동 평균 지수를 보고 싶다면 지표 메뉴에서 올바른 매개변수를 구성해야만 지표 이미지에 표시된 대로 볼 수 있습니다.

지표 소개:
지표는 추세선과 히스토그램을 그립니다. 가격 지연이 적고 미래 기능이 없으며 신호가 표류하지 않습니다. 시장이 지역간 변동을 보일 때 표시기가 빨간색과 녹색 히스토그램으로 나타나면 저가 구역이고, 표시기가 자홍색과 노란색 히스토그램으로 나타나면 고가 구역입니다. 또한 고가 및 저가 영역에 따라 시장의 추세를 분석하는 데 사용할 수 있습니다. 표시기 이전 k 라인에 위쪽 화살표 또는 아래쪽 화살표가 있을 때 이 신호를 사용하여 때때로 거래할 수 있도록 편의를 제공하기 위해 이메일, 경고 및 알림을 보낼 수 있습니다. 표시기에는 히스토그램의 높이, 선의 기간 및 비율을 포함하여 변경 가능한 매개변수가 있습니다. 모든 시간대에 적용되며 M1 이상의 시간대에 적합합니다. 표시기의 작업은 스크린샷에 나와 있습니다. 이 표시기가 거래에 도움이 되기를 바랍니다.
FREE
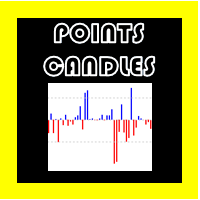
포인트 캔들 OSW
(메타트레이더 5)
이 지표를 사용하면 차트에서 처리되고 있는 각 양초의 크기를 포인트 단위로 알 수 있으며 각 양초의 크기와 방향에 대한 정보를 제공합니다. 지표는 강세일 경우 위를 가리키고 약세일 경우 아래를 가리킵니다. . 또한 모든 양초를 숨기거나 표시할 수도 있습니다. 강세만 또는 약세만 표시할 수 있습니다. 이는 Deriv와 같이 한 방향으로 더 강한 양초를 제공하는 자산을 관리하는 중개인을 위한 것입니다. 브로커가 정상인 경우 이렇게 해서는 안됩니다. 개발할 전략이 없다면? 포인트 캔들 OSW
(메타트레이더 5)
이 지표를 사용하면 차트에서 처리되고 있는 각 양초의 크기를 포인트 단위로 알 수 있으며 각 양초의 크기와 방향에 대한 정보를 제공합니다. 지표는 강세일 경우 위를 가리키고 약세일 경우 아래를 가리킵니다. . 또한 모든 양초를 숨기거나 표시할 수도 있습니다. 강세만 또는 약세만 표시할 수 있습니다. 이는 Deriv와 같이 한
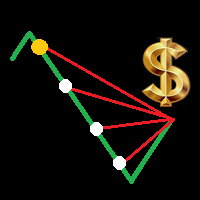
Is your trade at a loss? Does not matter ! You can use this Extra martingale tool. In the set loss of your trade or your EA's trade , this tool will open another trade at a better price. It can also open multiple trades at different distances and with different lot sizes. Each trade will be assigned a TakeProfit. This tool has a lot of settings. You can set variable lot sizes, variable trade distances, variable TakeProfit sizes, maximum total profit or loss in money. You can also close trades

Indicator introduction: The indicator draws wave lines and histograms, It has small price lag, and the signal will not drift. The indicator can send emails, alerts and notifications to you when previous k line has an up arrow and it is under the histogram sections or it has a down arrow. you can choose whether or not to send the two kind of alerts, the alerts repetition times can also be changed. If the indicator appears red and green histograms, this is a buy zone. It can be used to analyze mar
FREE

The indicator represents the session boxes for the Asian, European and American sessions. It is possible to change the time of each session, such as color. It is also possible to disable the display of each session. You will find in input parameters variables to modify in format hh:mm. In Colors tab you can change the color of boxes of each sessions. If you need some implementations please contact me.
FREE

! IMPORTANT ! To ensure that the backtest runs without errors, the following must be set in the settings: Limit Time Range: Timerange = True must be selected. The time must be set so that the EA does not trade during the rollover of your broker. Exit at End of Range is not relevant and can be set to either true or false!
The "The Real Supertrend EA" shows in the backtest a stable increase of the equity from 2016 until today.
Yearly over 50% in the USDJPY. This is not a guarantee of winning!

Indicator introduction:
The indicator is calculated by volumes and prices, It is a single side indicator, only has up arrow signals. It is better to use it in conjunction with other trend indicators, and you need to find the most efficient time to use it in order to acquire a high winning probability. The indicator can send emails, alerts and notifications to you when the indicator before k line has an up arrow. The indicator's parameters can be changed, including the computation period of the
FREE

This indicator allows to know the remaining time before the closing of the candle. It works on every timeframe. It is very usefull when your trading strategy depend of the close or the open of a specific candle. So use it like you want. Don't forget to leave a comment or a request for a EA or an indicator. Also spread it to your friends and don't hesitate to visit my profile to see others tools.
FREE
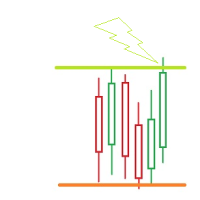
- simple PRICE Action Indicator/ Tool - SELF-Adjusting - you choose the UPPER Border of your RANGE ( Resistance) - you choose the LOWER Border of your RANGE ( Support) # Alert happens when the PRICE TOUCHes 1 of these Borders # (we release a CLOSED above/below - Version too) - popup Alert or custom sound - PUSH notification ( no email - that tool is for quicker action) - once a Border got hit --> it doesnt disappear --> it goes a selectable amount of POINTS ( RANGE(new) ) above/b
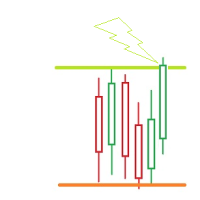
- simple PRICE Action Indicator/ Tool - SELF-Adjusting - you choose the UPPER Border of your RANGE ( Resistance) - you choose the LOWER Border of your RANGE ( Support) # Alert happens when the PRICE CLOSES above/below 1 of these Borders # (we released a TOUCH - Version too) - popup Alert or custom sound - PUSH notification - eMAIL notification - once a Border got crossed(closed candle! )--> it doesnt disappear --> it goes a selectable amount of POINTS ( RANGE(new) ) above/below t

What is the Volume Weighted Average Price (VWAP)? The volume weighted average price (VWAP) is a trading benchmark used by traders that gives the average price an instrument has traded at throughout the day, based on both volume and price. It is important because it provides traders with insight into both the trend and value of the instrument.
What is the Difference between VWAP and AVWAP? While VWAP is having as starting point the beggining of the day,week,month etc. in the AVWAP you can p
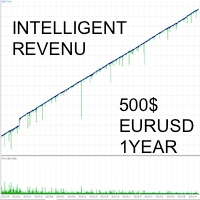
The INTELLIGENT INCOME strategy is a combination of custom indicators and a very advanced trading algorithm. It has been tested with real ticks, and passed the stress test with slippage approximating real market conditions over a period of 5 years. SMART INCOME EA IS FOR THOSE WHO: - HAVE NO KNOWLEDGE PUSH IN TRADING - WANT TO HAVE A PASSIVE INCOME EVERY DAY - WISH TO ATTEND OTHER OCCUPATIONS - WISH TO RISK THE MINIMUM CAPITAL POSSIBLE
FEATURES - Only with the EURUSD pair; The Multi-currency
FREE
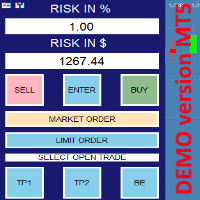
this is DEMO VERISON (for demo acc.) of TRADING OVERLAY with PARTIAL take profit ("virtual TP") and % risk lot size
--- full version available on my 'seller page' as well as version for MT4 Take better control of your trades with ease ! Easy lot size calculation with easy SL/TP setting. Your trading will be much more comfortable with this tool!
Main goal with this tool is very SIMPLE and FAST operation! Works like any EA, add it to selected chart and trade !
Features: start
FREE

Watch permanently the strength of all majors! The strength is shown through horizontal bars in the top left corner. Additionally you get a recommendetation which pair is currently the strongest/weakest and should therefore be bought or sold. Simple and easy! I use this indicator in my own expert advisor - but I will probably NOT publish this expert advisor! Sorry guys!

To download MT4 version please click here . - This is vortex indicator. - It is used to detect trend strength and direction. - It consists of two line(buffers). ==> VIM and VIP - There are three types of signals related to this indicator: 1. crossing VIM and VIP 2. threshold on distance between VIP and VIM 3. VIP above VIM vice versa. - This is a non-repaint indicator with light processing.
FREE
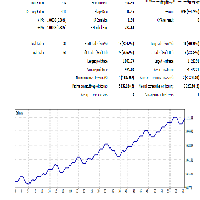
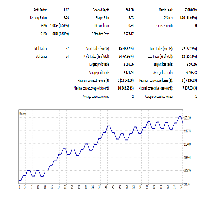
This Expert is developed to optimize parameters to trade intraday trending markets. Simply use optimization to find the proper inputs for specific symbol you are interested in. This is a light load EA from processing point of view. You can easily run this on several charts simultaneously. Make sure to set a different magic number for each. note: The screenshot shows a 12% profitability in EURUSD for a period of a year and 2% draw-down using optimization to find best inputs.
FREE

The Quantitative Qualitative Estimation (QQE) indicator is derived from Wilder’s famous Relative Strength Index (RSI). In essence, the QQE is a heavily smoothed RSI.
Modification of this version: ( converted from tradingview script by Mihkell00, original from Glaz)
So there are Two QQEs. One that is shown on the chart as columns, and the other "hidden" in the background which also has a 50 MA bollinger band acting as a zero line.
When both of them agree - you get a blue or a red bar.
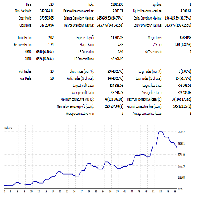
This is MacroTrendTrader. It trades in DAILY time frame even if you run it on lower time frames. It opens/closes trades once per day at a specific time that you choose via input tab: - "param(1-5)" are optimization parameters. - "Open/Close Hour" is set via input tab. Make sure to choose this to be away from nightly server shutdown. - "high risk" mode if chosen, sets a closer stop loss level. Therefore higher lot sizes are taken. This is a light load EA from processing point of view. Calculatio
FREE
This Expert is developed to optimize parameters to trade in choppy markets. Simply use optimization to find the proper inputs for specific symbol you are interested in. This is a light load EA from processing point of view. You can easily run this on several charts simultaneously. Make sure to set a different magic number for each. note: The screenshot shows a 20% profitability in USDCAD for a period of 4-months and 5% draw-down using optimization to find best inputs.
FREE

Right here, is the utility tool to help traders with opening, managing, and closing multiple trading positions at the same time. This Utility tool does not work on strategy tester. To test this utility, follow the blog link below to download the demo version. https://www.mql5.com/en/blogs/post/751097
Specifications. 1) User-friendly - No complications and any trader can find it easy to use. - A simple click on a button is all it takes to perform the desired task. 2) Do
FREE
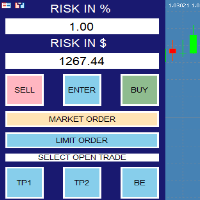
RISK CALCULATOR - TRADING PANEL - CHART OVERLAY with:
PARTIAL TAKE PROFIT ("virtual TP") % RISK LOT SIZE TRAILING STOP LOSS Fast and simple control of your trades Easy lot size calculation with easy SL/TP setting. Your trading will be much more comfortable with this tool!
Works like any EA, add it to selected chart and trade !
(this version is converted from MT4)
Features: start trade with calculated lot based on % of account balance * that you want to risk/ or base
With correctly identifying the " Order Blocks " we can estimate the approximate location of price exhaustion. These are locations which the big players place their orders. We gathered this data by our experience and years of hard work and put it into this EA This is important that our EA is NOT martingale and have a very good TP/SL ratio and each order will have a hard SL and TP it can trade on many symbols but recommended ones are already as default
Symbols that expert trade best

This EA opens a buy sell order based on the H4 trend and Candle Sticks. When the price goes over 100 pips ea keep opening orders against the price until the profit is positive and EA will close all orders and continue the new round. Requirement - Flatform: MT5 - Symbol: XAUUSD. - Time frame: M15 - Minimum deposit: >1000$ - Leverage: 1:500 and higher - ECN broker - Virtual Private Server hosting (VPS)

Get it for less than $99 while you can! Will be increased to $300 very shortly after a few downloads!!
Set files provided in the comments. Please follow my Telegram and Discord as more set files are released every couple of days.
Join my Discord and Telegram Channel - Max's Strategy For any assistance and help please send me a message here. https://t.me/Maxs_Strategy https://discord.gg/yysxRUJT This EA does not use any martingale and/or grid functionalities. Send me a message if you need
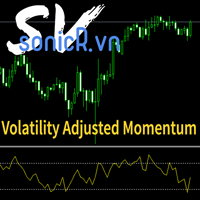
It's a indicators that computes volatility-adjusted momentum. The problem with the momentum indicator is that it's absolute and it's hard to interpret its value. For example, if you'll change the timeframe or instrument value of Momentum will be very different. We tried to solve that by expressing momentum in volatility . This way you can easier spot overbought/oversold values. You can choose to use Standard Deviation or ATR for adjustments. Our method is base on Momentum and the Cross-secti
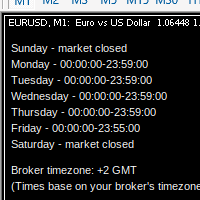
MarketSchedule displays market sessions' open/close time for each day through out the week, also broker's timezone.
It also supports instruments that have more than 1 session per day (maximum of 2 as most instruments don't have more than this)
e.g. crypto market such as BTCUSD which usually has a few hours break mid-day thus it spans into 2 market sessions. You don't have to spend time looking for such information on broker's website. It's an on-demand script that you can drop onto the chart t

Утилита Trade By Time предназначена для автоматизации торговли для списка валютных пар в определённое время, например, во время выхода новостей. Принцип работы будет описан немного ниже. Сама утилита работает только с заранее подготовленным файлом с таймингом и списком инструментов. Сам файл нужно положить в каталоге данных в папку Files , указать название этого файла в настройках утилиты и перезапустить её. Файл должен содержать строки с данными следующей структуры: yyyy.mm.dd hh:mm; <EURUSD|
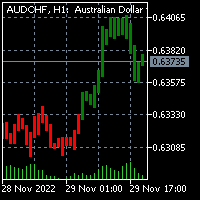
To download the MT4 version of Donchian Candles please click here . You may also check this link . This is inspired by TradingView: "Donchian Trend Ribbon" By "LonesomeTheBlue". This indicator merges Ribbon data into chart Candles. The result is one of the coolest indicators out there to detect trend direction and strength. As a trader you always need such indicator to avoid getting chopped in range markets. - You can message in private chat for further changes you need. The indicator is l
Volatilities Scalper is an EA based on the High/Lows of a Candle, it uses lots of indicators to get an accurate entry, Hedges if the price was on opposite direction. See the Parameters Below and please dont use the default settings. Feel free to optimized also so you can see its capabilities on the live market. For Volatility Index 75 Use the settings Below :
Autolots :0.0000001 SL : Optional TP : Optional Close All in Pips : 500000 ( it will close all the trades No Matter How on the Desired

Keltner Channels (ou Canais de Keltner ) é mais um indicador de volatilidade utilizado pela análise técnica. Também chamado de envelope , esse canal foi criado por Chester Keltner para monitorar os seus investimentos no mercado futuro de café na década de 1960. Porém, com o passar do tempo, passou também a ser utilizado para outros ativos e, atualmente, é uma das ferramentas mais utilizadas pelos traders. Nesta versão customizada foram adicionados novas opções de método de média movel

A Média Móvel é um indicador que faz parte da Análise Técnica. Com ela, é possível identificar o equilíbrio dos preços no mercado, observando tendências de alta, neutra ou baixa. Este indicador customizado traz opções extras pera definir o método de cálculo podendo-se esclolher entre SMA,EMA,SSMA,LWMA,JJMA,JurX,ParMA,T3,Vidya,AMA,HULL MA. Também conta com varias opções para escolher o método de cálculo para o preço base a ser usado no cáculo da média.

Multiple Timeframe MACD indicator. This indicator was built for making multiple timeframe analysis possible in MT5 using MACD Indicator. MACD Indicator traditionally shows two lines and one histogram. MACD Line(Yellow) is calculated by subtracting 12period EMA(fast) from 26period EMA (slow). Signal Line(Blue) is created by a 9period EMA from MACD Line. Histogram is just the difference between MACD and Signal lines. Histogram is colored based on the difference between its value and the previous h

지원 및 저항 구역 표시기 MT5 이 표시기는 상단과 하단을 자동으로 식별하는 방법을 알고 있습니다. 이 지지선과 저항선 표시기는 상단과 하단을 기준으로 지지선과 저항선을 만듭니다. 지지선과 저항선을 만드는 방법. 자동 지지선과 저항선을 만드는 지표입니다. 지표로 지원 수준을 찾는 방법 이 표시기는 자동으로 상단과 하단을 찾습니다. 지그재그(ZigZag)가 자동으로 바닥을 생성하거나 새로운 바닥을 이전 바닥보다 낮게 만들 때마다 표시기가 자동으로 지지선을 생성하므로 표시기가 자동으로 화면에 자동 지지선을 그립니다. 저항선을 만드는 방법. 지그재그(ZigZag)가 새로운 최고점이나 최고점을 이전 최고점보다 높게 만들 때마다 표시기가 지지선을 생성하는 것과 같은 방식으로 자동으로 저항선을 생성하므로 표시기가 자동으로 새로운 저항을 생성하므로 사용자가 상단과 하단 레벨이 어디에 있는지 걱정해야 합니다. 이 지표는 트레이더가 차트에 지지와 저항을 표시할 수 있는 쉬운 방법입니다. 상단 표시
FREE
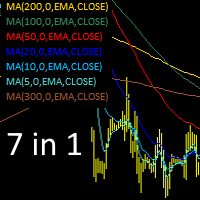
Moving Average indicators - 7 in 1. Installing 7 indicators at once, setting their parameters and properties. The indicators used (with basic properties) are shown in the upper left corner of the chart. When you click on the properties, the indicator turns on (activates) or turns off. The properties of the active indicator are displayed by its color. The properties of a disabled (not active) indicator is grayed out.
In the ind_ma indicator parameters: 1. Display the indicator on the chart (yes

For a more refined algorithm capable of detecting highs and lows everyday, opt for : Ice Scalper Pro!!! : https://www.mql5.com/en/market/product/93215 MT4 Version : https://www.mql5.com/en/market/product/94060
Check my other products here : Pivot Points Master : https://www.mql5.com/en/market/product/95744 Pivot Points Master MT4 Version : https://www.mql5.com/en/market/product/95981
Check my other products here :
Ice Scalper is a fully automated scalping robot that uses a highly ef
FREE

Build your EA with Build EA Simple, with it you can build your strategy with the available indicators and tools.
Build EA Simple does not have any defined strategy, but with it you can use combinations of indicators and use them as signals or filters and build your strategy!
Build EA Simple is a simplified version of Build EA that doesn't have as many tools. Discover Build EA Pro https://www.mql5.com/pt/market/product/88859?source=Unknown%3Ahttps%3A%2F%2Fwww.mql5.com%2Fpt%2Fmarket%2Fmy
I
FREE
MetaTrader 마켓은 과거 데이터를 이용한 테스트 및 최적화를 위해 무료 데모 거래 로봇을 다운로드할 수 있는 유일한 스토어입니다.
어플리케이션의 개요와 다른 고객의 리뷰를 읽어보시고 터미널에 바로 다운로드하신 다음 구매 전 트레이딩 로봇을 테스트해보시기 바랍니다. 오직 MetaTrader 마켓에서만 무료로 애플리케이션을 테스트할 수 있습니다.
트레이딩 기회를 놓치고 있어요:
- 무료 트레이딩 앱
- 복사용 8,000 이상의 시그널
- 금융 시장 개척을 위한 경제 뉴스
등록
로그인
계정이 없으시면, 가입하십시오
MQL5.com 웹사이트에 로그인을 하기 위해 쿠키를 허용하십시오.
브라우저에서 필요한 설정을 활성화하시지 않으면, 로그인할 수 없습니다.