适用于MetaTrader 5的付费技术指标 - 70

The key logic of SignalTech is generated by Artificial Intelligence. The machine learning module should continue optimizing the core logic on the server side to guarantee that SignalTech System can accurately track the market's movement.
SignalTech can generate AI based signals with Buy/Sell Arrows and Pop-Up/Sound Alerts. Each signal has clear Entry and stop Loss levels, which should be automatically flagged on the chart, as well as potential Targets 1, 2, and 3.
SignalTech can work on EURU
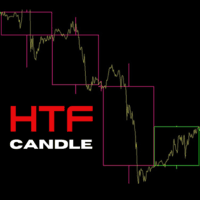
ICT Traders! Here's another cool Indicator that will allow to trade the HTF narrative while focus on price action on your entry timeframes. The following are the input for setup the indicator: Maximum Bar: The number of HTF bar you want to display High Timeframe: the Timeframe which narrative you want to base on and trade from the lower timeframe. Visual Timeframe: the largest Timeframe the indicator will print the HTF candles. Bullish Candle: The color of the bullish candle Bearish Candle: The
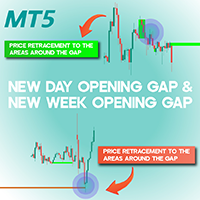
New Day Opening Gap and New Week Opening Gap NWOG NDOG MT5 The New Day and New Week Opening Gap (NDOG-NWOG) indicator is a powerful tool designed for traders using MetaTrader 5. It detects price gaps that emerge at the start of a new trading day or week and visually represents them on the chart. When the market reopens following a daily or weekly closure, the price often shifts from its prior closing level, leading to a gap. This indicator highlights weekly gaps (NWOG) in red and daily gaps (

A Fair Value Gap (FVG) is a three-candle price imbalance where price moves aggressively in one direction, creating a gap between the wicks of the first and third candle.
How to Identify an FVG: The second candle must have a large body , showing strong displacement.
The wick of the third candle must not overlap with the wick of the first candle , leaving an inefficiency. The third candle should not close beyond the high (bullish) or low (bearish) of the second candle.
Usage: Internal Range
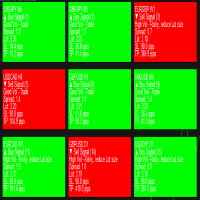
Introducing Telos Dashboard Indicator – Your Ultimate Trading Companion Optimized For Forex! Note: This is a dashboard indicator and won't work on the strategy tester. Demoing it there is a waste. Instead get the main indicator or, use the demo of DynamicCOG to see how it works with arrows, although Telos is a more refined and filtered version than the DynamicCOG indicator. Never Miss a Trading Opportunity Again!
Welcome to the future of trading with the Telos Dashboard Indicator ! Inspired
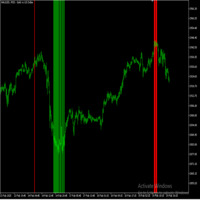
Reversal Radar – 市场反转分析技术指标 概述
Reversal Radar 是一款技术指标,旨在帮助识别潜在的市场转折点。它通过分析历史价格数据,检测显著的高点和低点,并提供视觉信号,帮助交易者识别市场动量可能发生变化的区域。 主要特点 极端价格检测:
识别可能预示市场方向发生变化的重要高点和低点。 降噪处理:
利用波动率过滤器最小化微小波动,重点关注显著的价格变动。 可自定义参数:
提供可调节的灵敏度和设置,适应不同的交易风格和时间周期。 视觉警报:
在图表上显示清晰信号,支持及时决策。 工作原理
Reversal Radar 分析历史价格走势,定位稳健的极值水平。通过应用动态波动率阈值,过滤掉不太重要的波动,从而突出显示市场可能准备反转趋势的区域。指标的可调参数允许交易者根据特定市场条件调整其响应性。 使用建议 时间周期:
在 H1 图表及以上时间周期上效果最佳,可更清晰地显示信号。 市场:
适用于外汇、指数、商品、加密货币和股票。 辅助分析:
可与其他技术分析工具有效结合,以获得额外确认。 免责声明
Reversal Radar 仅作为辅助识别潜在市场反转的分析
ADBIN BAND – Adaptive Channel Indicator for XAUUSD and DE30
Description:
The ADBIN BAND is a trading indicator designed for analysis of XAUUSD (Gold) and DE30 (German Stock Index) . It generates dynamic price channels using an Adaptive Moving Average (AMA) to reflect market volatility. Functionality: Dynamic Channels : Plots upper and lower bands around price, adjusting to volatility via AMA. Signal Generation : A green arrow appears when price closes above the upper band. A r

The indicator is designed to help in making a decision on the direction of trading (buy or sell). It is a history scanner that searches for matches of the current pattern (combination of several current bars) with historical data in percentage terms by the relative vertical position of candles relative to each other, the size of each candle, the size of the candle body and the candle shadows. In history, the matches found are indicated by vertical lines on the candle of the beginning of the soug

Crash Raptor A Powerful Spike Trading System [VPS Recommended] Crash Raptor Spike Detector is a professional trading indicator designed to identify high-probability sell setups in Deriv Indices. This indicator combines the power of Reversal Strategy to generate reliable trading signals with precise entry, stop-loss, and take-profit levels. Only trading Signals when Crash 1000 is in Downtrend Key Features Clear Visual Signals : Prominent arrow markers for sell signals Automatic SL/TP Levels : St
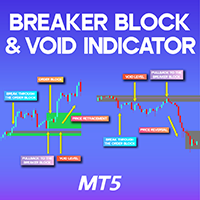
Breaker Block & Void Indicator MT5
A Breaker Block represents a price zone where the market revisits after breaching an Order Block . In simple terms, when the price pulls back to a previously broken order block, it forms a breaker block. The Breaker Block Indicator is designed to automatically detect these critical zones, marking them once an order block is violated and the price retraces. By analyzing market movements, it helps traders identify recurring patterns in price action. «Indicator I
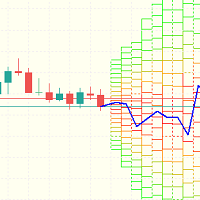
该指标使用 布朗运动 和 蒙特卡洛迭代 来计算 价格向某个方向移动的概率 。 该指标显示什么? 一方面,它绘制了 热力图 ,根据价格达到某个水平的概率,将区域分为三个部分: 红色区域 :概率 大于 50% 。 橙色区域 :概率 在 25% 到 50% 之间 。 绿色区域 :概率 低于 25% 。 另一方面,它绘制了一条 蓝色线 ,代表 最有可能的轨迹 。 最后,该指标考虑了多头和空头概率状态的数量,并在专家窗口中返回整个走势为上涨或下跌的概率。 输入参数 MonteCarloIterations - 每根未来K线的蒙特卡洛模拟次数。值越高, 概率估计越精确 ,但计算也会 变得更慢 。 FutureCandles - 要模拟的未来K线数量,即热力图和蓝色轨迹上投影的K线数量。 Bins - 热力图直方图的划分数,更多的 bins 代表 更高的价格分布精度 。 HoursBack - 用于分析的历史数据时长,时长越长,统计稳定性越好。 SimTimeframe - 用于模拟的时间

ATR Master – 您图表上的波动性大师! ATR Master 是一款 专业的 ATR 指标 ,可直接在图表上实时显示关键数据!它帮助您 分析价格波动范围、确定已移动的点数和剩余的潜在波动空间 ,并监控蜡烛计时器和当前点差。 为什么交易者选择 ATR Master? 每日 ATR 分析 – 查看当天的平均价格波动范围,括号内显示所选周期。
ATR 已移动 – 跟踪价格已移动的点数。
ATR 剩余 – 判断市场是否仍有进一步波动的潜力。
蜡烛计时器 – 了解当前 K 线关闭前剩余的时间。
点差监控 – 在进入交易前了解市场条件。
语言选择(中文/英文) – 一键切换文本显示! ATR Master 的核心功能: 实时数据 – 信息即时更新,无延迟。
灵活的自定义设置 – 可调整颜色、大小和标签位置。
简单易用 – 适用于所有交易者的直观界面。
兼容性强 – 适用于所有金融工具和时间周期。 谁适合使用 ATR Master? 剥头皮交易者 – 了解市场还剩多少波动空间。
日内交易者 – 在进场前评
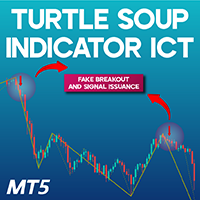
Turtle Soup Indicator ICT for MT5 The Turtle Soup Indicator for MetaTrader 5 is a specialized tool aligned with the "ICT" trading methodology. This indicator is designed to detect false breakouts (Fake Breakouts) and identify potential counter-trend trading setups when conditions are favorable. As a result, it is highly optimized for reversal trading strategies. The indicator simplifies false breakout identification by categorizing them into internal and external classifications. Moreover, newly

The "Setup Bivit" Indicator The "Setup Bivit" is an advanced technical indicator designed for MetaTrader 5, developed to provide a clear and comprehensive visual analysis of the financial market. Inspired by customized strategies, this indicator combines intuitive visual elements and decision-support tools, making it a powerful ally for traders looking to identify trends, support and resistance zones, and price patterns across different timeframes. With a rich and interactive graphical interface

Manyal trading system, CovEchoTrend Robot, focuses on reliability and flexibility. By employing statistical analysis methods to study the relationships between the base indicator and market patterns, the system enables a deeper understanding of market processes. Intelligent pattern analysis: The application of statistical data processing helps identify key trend reversal points more accurately, signaling significant market shifts. Informed decision-making is based on the intersection of indicato

Super Trend Indicator – Trend Following Tool
Description:
The Super Trend Indicator is a trend-following tool designed to assist traders in identifying market trends. Utilizing the Average True Range (ATR), it dynamically adjusts to market volatility and generates visual signals. The indicator plots lines directly on the chart, changing color based on trend direction. Crosses between the price and indicator line may suggest potential trend shifts. Key Features: Dynamic trend detection using ATR.
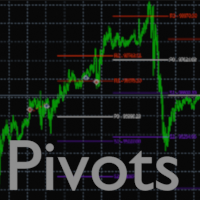
Pivots Points Indicator:
Displays the Pivots Points lines for the Daily, Weekly or Monthly periods
Several parameters are possible:
1 - Choice of calculation method:
- Classic
- Woodie
- Camarilla
- Fibonacci
2 - The choice of the period for calculating the pivot points ( Daily, Weekly or Monthly )
3 - The display or not of the price labels (to the right of each line) as well as the size of the associated font
4 - The number of pivot points (previous) that we want to display
5 - Po
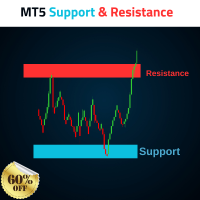
MT5 Support and Resistance Indicator Automatic Drawing of Multiple Supports and Resistances with levels. Supports As follow 1. Weak Support 2. Untested Support 3. Verified Support 4. Proven Support 5. Turncoat Support Resistances As follow 1. Weak Resistance 2. Untested Resistance 3. Verified Resistance 4. Proven Resistance 5. Turncoat Resistance Best Strategy to use 1. Identify Trend Direction on Daily Time Frame, Example Gold =

Trend Follower Cloud Trend is your freind. Advanced Indicator follow the trend, and gives a clear levels to buy and sell, and have Stop loss and Targets. Watch the Video to know how to use it combined with our Support and Resistance Indicator. Blue Trend Line Take a buy when we get a cloud intersection above the Bule line. Red Trend line Take a Sell when the Cloud drops below the Red line.

Range Breakout Signal (RBS) is a powerful trading indicator based on the Fair Value Gap (FVG) concept. This strategy identifies imbalances in price action, where liquidity gaps create high-probability trading opportunities. The indicator pinpoints these gaps and marks potential buy and sell zones for traders to capitalize on market inefficiencies. Key Features:
Detects Fair Value Gaps (FVG) for strategic entries Identifies strong breakout zones with price range expansion Displays clear buy a

Market Session Asia Eu USA – Visualize Global Trading Sessions on Any Timeframe Market Session is a powerful MetaTrader 5 indicator that highlights the key trading sessions— Asian, European, and US —directly on your chart. It works across all timeframes , allowing traders to quickly identify market activity and volatility during different global trading hours. Features:
️ Displays session boundaries for Asia, Europe, and the US
️ Works on all timeframes for a flexible trading experience

Indicator Description: "Currency Strength Panel with Trend Analysis" This indicator is designed for analyzing the strength of currency pairs and determining their current trends, helping traders make more informed trading decisions. It displays a panel on the chart that shows the strength of each currency pair based on price movements across different timeframes (H1, H4, D1) and identifies whether the pair is in a trend or counter-trend. How to Use this Indicator: Currency Pair Strength Analysis

Indicador IPCPayroll – O Segredo dos Traders de Sucesso! Quer operar com mais confiança e precisão com os preços do dia da divulgação do Payroll e do IPC Americano ? O Indicador IPCPayroll foi desenvolvido para traders que querem acompanhar o impacto dessas notícias no mercado de forma estratégica e organizada. Marcação Automática das Notícias
O indicador insere automaticamente linhas horizontais no preço de abertura do candle de 5 minutos das datas de Payroll e IPC. Visualização Clar

This Indicator enhances the default Relative Strength Index (RSI) by introducing several improvements. First, it visually highlights overbought and oversold regions by changing the RSI color from white to red. Second, it includes additional reference lines at 20, 40, 50, 60, and 80, providing a clearer framework for assessing RSI values. The most notable feature is the use of the middle 50-line to indicate the current market cycle. The color of the 50-line dynamically reflects the cycle: green f

Smart Key Levels Indicator for MT5- Advanced Support & Resistance Tool The Smart Key Levels Indicator is a professional-grade tool for traders seeking precise support and resistance levels. Using advanced algorithms, it identifies key price levels with dynamic strength scoring, volume filtering, and higher timeframe confluence. Perfect for all trading styles and timeframes, this indicator provides clear visual signals with customizable settings. Available for both MT4 and MT5 platforms. Unlo
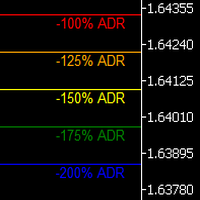
Uncover the market’s secret zones with the ADR Levels+ Indicator. This dynamic tool plots ADR extension levels at 100%, 125%, 150%, and 200% right on your chart. In most cases, price dances between these boundaries—but when it breaks out, it often signals a prime opportunity for a mean reversion trade or the start of an evolving trend. Plus, an integrated alarm system triggers as soon as these key levels are reached, ensuring you never miss a lucrative trading opportunity. Elevate your strategy
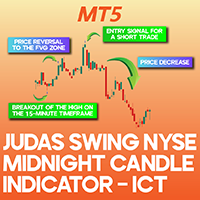
Judas Swing NYSE Midnight Candle Indicator ICT MT5 The Judas Swing Indicator is designed to operate between midnight and 5:00 AM New York time , offering precise buy and sell signals by detecting Change of Character (CHoCH) , Fair Value Gaps (FVGs) , and order block zones . This tool highlights CHoCH occurrences and price pullbacks to FVGs or order blocks with a gray arrow . If all trading conditions align, a green arrow represents a buy signal, whereas a red arrow signifies a sell opportunity.
NormaDevWaves is a manual system designed to trade the most juicy and liquid pairs, such as EURUSD, GBPUSD, and XAUUSD. Main idea: system implements the concept of a base indicator and utilizes statistical principles of correlation between price flow determination metrics in relation to standard deviations of prices from their driving force. This allows for a deep analysis of market behavior and the identification of hidden patterns. Market Adaptation: thanks to a balanced consideration of sh
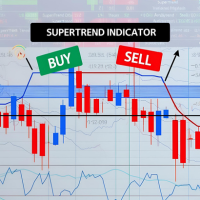
The Machine Learning Supertrend is a highly effective trading indicator specifically designed to identify and illustrate potential buy and sell signals through the use of clearly marked arrows.
One of the key advantages of this indicator is that it operates as a leading indicator, meaning it anticipates market movements rather than following them. Unlike many traditional indicators, the Machine Learning Supertrend does not lag or repaint, ensuring the signals provided are timely and reliable.
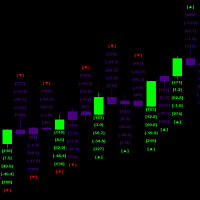
This indicator helps identify the start of significant market movements by analyzing candle patterns and their relative price action strength
the indicator runs multiple simultaneous calculation every millisecond and it also does a triple set verification historically in order to calculate future probabilities the historical processing has to be completed before new Candlestick can be processed as one total set out of the total available history from the starting date and time in order to

Long&Short Cointegration Analyzer An advanced tool for traders looking to profit from cointegration. Analyzes any asset pair for Long&Short strategies. What does the Long&Short Cointegration Analyzer do? Identifies cointegrated pairs that revert to the mean, ideal for profitable trades. Provides a detailed panel with statistical data for confident decisions. Works with any currency pair, on any timeframe.
Find buying and selling opportunities based on cointegration. Minimize risks with a relia
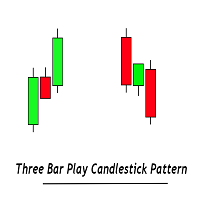
The Three Bar Reversal Pattern indicator identifies and highlights three bar reversal patterns on the user price chart.
The script also provides an option for incorporating various trend indicators used to filter out detected signals, allowing them to enhance their accuracy and help obtain a more comprehensive analysis.
USAGE Figure 1 The script automates the detection of three-bar reversal patterns and provides a clear, visually identifiable signal for potential trend reversals. Fi
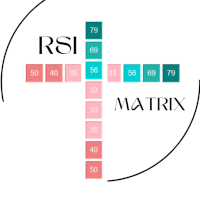
With the RSI matrix, you can display the RSI values from M5 to W1 very easily and clearly. This gives you a quick overview of the trend strengths on all superordinate and subordinate timeframes.
The threshold values used are 30, 40, 50, 60, 70. If these are exceeded or fallen short of, this is indicated by coloring. The colors can be customized by you.
* You can display the time frames you are interested in
* The display can be vertical or horizontal
* Colors can be set for the threshold va
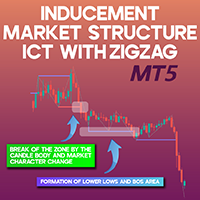
ICT Market Structure Indicator with Inducements MT5 The ICT Market Structure Indicator with Inducements is an advanced analytical tool built around Smart Money trading principles and is fully compatible with the MetaTrader 5 platform. This indicator utilizes three key components— Change of Character (CHoCH), Break of Structure (BOS), and Inducements (IDM) —to give traders a comprehensive and structured perspective on price action dynamics.
It automatically maps out Change of Character (CHoCH) le

Session Break Out 指标 – 交易时段分析的终极工具 立即加入,每天获取实时交易信号! https://t.me/sessionbreakout
Session Break Out 指标 是一款先进的工具,旨在帮助交易者监测市场交易时段,并有效利用基于时间的交易策略。专业交易者深知,在外汇市场中,不同交易时段的货币强度和波动性各不相同,时间因素至关重要。 使用此强大指标,您可以:
追踪市场交易时段 – 立即识别当前活跃的交易时段及开放的市场。
监测时段高点和低点 – 关注关键价位,寻找突破或反转机会。
捕捉全新突破 – 当交易时段的高点或低点被突破时,实时收到提醒。
适配任何时区 – 轻松调整指标以匹配您的本地 GMT 设置。
可视化交易时段重叠 – 通过精美的图形界面清晰展示交易时段的转换。
历史交易时段框架 – 轻松开启历史时段显示,回顾市场结构。
即时买入 & 卖出信号 – 突破发生时,屏幕上显示实时提醒和箭头。 为什么选择 Session Break Out 指标? 简单安装 – 只需几秒钟即可轻松设置,无需复杂配置。
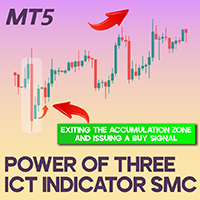
Power of Three ICT Indicator in Smart Money Concept MT5 The Power of Three Indicator is an advanced trading tool available for MetaTrader 5 , designed to highlight three crucial market phases: Accumulation, Manipulation, and Distribution , which align with Smart Money trading principles. These phases represent distinct price behaviors, guiding traders in analyzing market stability, liquidity movements, and directional trends. The indicator marks accumulation zones with red boxes, while manipulat

使用 Predator VWAP 蜡烛图和斐波那契比率,解锁精准交易的全新境界!厌倦了市场噪音和不确定的信号吗? 这款指标将为您带来前所未有的清晰度和信心。
这款简单的成交量加权平均价格 (VWAP) 指标是您提升交易策略的关键。无论您是经验丰富的交易者还是刚刚起步,Predator VWAP 都能帮助您更好地理解市场动态,做出更明智的决策。 Predator VWAP 蜡烛图指标巧妙地融合了 VWAP 的动态特性与斐波那契比率的精准性,从而生成清晰、简洁且不会重绘的信号和颜色。这意味着您将不再需要猜测,而是可以依靠可靠的指标来指导您的交易。 本指标旨在帮助您识别关键的支撑位和阻力位,这些是市场反转或趋势延续的重要信号。此外,它还能帮助您确认潜在的突破、反转和各种交易模式,从而提高您的交易成功率。无论您采用何种交易策略,例如 SMC(智能资金概念)、ICT(内部圈交易)、江恩理论、艾略特波浪理论等,Predator VWAP 都能完美地融入并增强您的现有方法。它就像一位经验丰富的助手,随时为您提供额外的洞察力和验证。 这款易于使用的 Predator VWAP 指标还配备了斐波那契
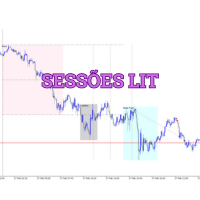
使用独家Sessões LIT指标掌控市场! Sessões LIT 是专为使用**LIT(流动性诱导交易者)**策略的交易者开发的指标。通过它,您可以清晰、准确地查看主要交易时段,并利用战略标记识别流动性区域和关键市场点。所有这些都可以在MetaTrader 5上自定义且直观地使用。 主要优势: 清晰的交易时段可视化: 彩色框突出显示亚洲、伦敦和纽约时段的时间。 完全可自定义:根据您的偏好调整时段时间、颜色和粗细。 水平和垂直标记: 水平标记: 识别亚洲时段的高点、低点和中点。 垂直标记: 突出显示**MMM(魔法操纵分钟)**和伦敦收盘时间,这是LIT操作的关键点。 易于集成: 兼容MetaTrader 5上的任何资产和时间框架。 快速直观的设置,无需高级知识。 注意: 在某些情况下,可能需要切换时间框架以刷新框和标记,确保所有数据正确显示。这是优化过程的一部分,以确保准确性。 历史分析: 显示过去 30天 (或根据配置)的框和标记,允许对市场行为进行回顾性分析。 该指标适合谁? LIT交易者: 识别流动性区域和关键点,如**MMM(魔法操纵分钟)**和伦敦收盘时间
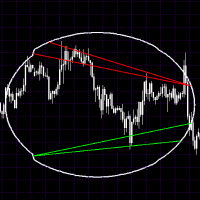
Trading concept: When price touches or exceeds the upper circle boundary = potential sell signal (overbought) When price touches or falls below the lower circle boundary = potential buy signal (oversold) The circle acts like a dynamic support/resistance band around the opening price The numbered points (1-24) help identify where in the cycle the price currently is This is similar to using Bollinger Bands or other envelope indicators, but with a fixed radius instead of standard deviations.
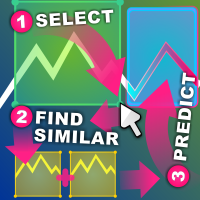
相似价格行为指标 相似价格行为将查找与您选择的图表区域尽可能相似的过去烛台图案序列。
该指标将从您选择的价格行为区域的第一个烛台之前开始搜索,直到图表的第一个最旧条。
评估两个序列之间的相似性有几个标准: 序列的长度必须相同,如果您选择的区域是 20 个烛台宽,那么任何匹配的结果也必须是 20 个烛台宽。您可以选择任意数量的蜡烛。 将根据序列的高低大小进行视觉比较 将根据序列的开盘价和收盘价大小和方向进行视觉比较。如果蜡烛图对一个序列来说是看涨的,而对另一个序列来说是看跌的,则得分设置为 0.0 序列有一组快速和慢速移动平均线,它们根据其增量进行比较。增量可以在该区域内相对比较,也可以在整个资产范围内绝对比较(相对和绝对模式) 序列有一组快速和慢速 ATR,用于比较其波动性。同样,比较可以是相对的,也可以是绝对的。 序列有一组快速和慢速 RSI,用于比较其局部强度。 以上所有内容混合在一起以获得最终评级,其中每个组件都由一个系数加权。指标的输入中提供了系数和比较方法。 指标的搜索引擎 simipac 将扫描过去所有可能的蜡烛图序列,而不会破坏蜡烛的顺序。
这些序列中的最佳序列将
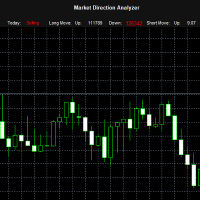
The "Market Direction Analyzer" is a technical indicator designed to provide traders with a comprehensive analysis of market trends, momentum, and potential reversals. By integrating multiple analytical tools, it offers a multi-dimensional perspective on market conditions, aiding in more informed trading decisions.
Using the Market Direction Analyzer in Trading: Trend Confirmation: By analyzing the aggregated sentiment score derived from its components, traders can confirm the prevailing market
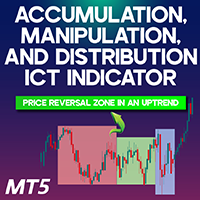
Accumulation, Manipulation, and Distribution ICT Indicator MT5
The AMD indicator is a sophisticated and highly effective tool designed for MetaTrader 5. By analyzing price fluctuations and trading volume across specific market sessions, it classifies price behavior into three key stages: Accumulation, Manipulation, and Distribution . To ensure clear distinction, the indicator highlights the Accumulation phase in pink, the Distribution phase in blue, and the Manipulation phase in green. «Indicat

介绍Always Win Currency Strength Analyzer:MT5终极货币强度仪表盘 这款MT5独立指标实时分析货币强度,识别最佳交易机会,提供可视化面板和自定义警报,是剥头皮和趋势交易者的必备工具。 核心功能:
实时强度追踪 – 分析外汇货币对与黄金(XAU)。
多时间框架分析 – 显示当前、1小时、4小时、8小时、24小时及1周前的强度。
自定义警报 – 设置强弱阈值并即时接收通知。
可视化面板 – 在MT5图表上一目了然。
捕捉趋势与反转 – 识别强弱货币对。 使用步骤: 将指标添加到MT5图表。 自定义分析周期与阈值。 监控多时间框架强度。 交易最强vs最弱货币。 阈值突破时接收警报。 立即开启智能交易! 跟踪货币与资产:
主要货币:
美元(USD)– 全球交易量第一
欧元(EUR)– 欧洲经济支柱
英镑(GBP)– 外汇市场主力
日元(JPY)– 避险首选
瑞郎(CHF)– 危机中的稳定器
澳元(AUD)– 大宗商品驱动
纽元(NZD)– 风险市场表现强
VarMomentPulse is a unique manual trading algorithm developed with precision and flexibility in mind, based on an extensive historical data cluster. Its operation is grounded in the principles of analyzing crossovers between normalized moving averages and dispersions across various time intervals, enabling it to uncover new opportunities in evaluating market trends. Key Features of the VarMomentPulse Indicator: Adaptability to Volatility:The use of price dispersion analysis allows VarMomentPul

Overview The ToughCookie Indicator is a powerful and versatile tool designed specifically for traders employing Dollar-Cost Averaging (DCA) strategies. This indicator enhances your trading experience by providing detailed position information, visualizing the average entry price as a horizontal line, and integrating a customizable Simple Moving Average (SMA) for trend and entry identification. Ideal for both novice and experienced traders, ToughCookie streamlines decision-making and offers real

Gold Finger Buy Sell Arrows - Trend Trading Indicator with Moving Average Filter
Gold Finger is a powerful and versatile trend-following indicator designed for MetaTrader 5 (MT5) that combines the classic buy/sell signal logic with an optional Moving Average (MA) filter for enhanced accuracy. This indicator generates clear Buy and Sell signals with customizable arrow visuals and a robust alert system, including terminal alerts, mobile notifications, and email notifications. Perfect for trader
Haven Trend Tracker PRO 是一个专业的指标,用于准确地确定所有金融市场的趋势。它 跟踪价格走势,帮助交易者根据明确的信号做出合理的交易决策。 其他产品 -> 在这里 主要特点: 清晰的趋势可视化 - 使用直观的系统显示趋势线:上涨趋势为蓝色,下跌趋势为红色 清晰的交易信号 - 箭头指示趋势变化时的进场点 多时间框架分析 - 可以在更高时间框架上跟踪趋势,以进行战略决策 可自定义参数 - 灵活的设置,可以根据任何交易风格调整指标 使用优势: 显著减少虚假信号的数量 帮助识别长期趋势,以获得更有利的交易 适合初学者和经验丰富的交易者 可广泛应用于各种市场: 外汇市场 股票市场(股票,ETF) 期货市场 商品市场 加密货币市场 债券市场 CFD合约 指数 该指标提供了一个清晰的趋势确定系统,帮助交易者根据主导价格走势进入市场,并在趋势变化之前保持头寸。

Fimathe Indicator The Fimathe Indicator is a tool for MetaTrader 5 designed to help traders identify support, resistance, neutral zones, and price channels. It features an interactive interface for drawing and managing support and resistance levels, generating take-profit channels and neutral zones, and providing visual and sound alerts for breakouts. Key Features Support and Resistance Lines: Dynamic and draggable lines to identify key levels. Reference Channel: Creates a channel between su
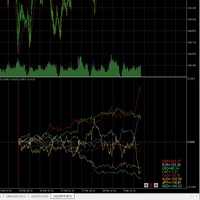
This indicator shows currency strength starting from the higher Zigzag.
In the parameter add_after, enter the additional characters used by each company.
Example: EURUSD_z → _z
Zigzag_timeframe determines the time frame of the Zigzag, but if the Zigzag timeframe is lower, the relevant timeframe will be used.
The left and right buttons at the bottom of the indicator move the Zigzag apex back and forth.
You can also move it to any location by selecting the vertical line that is the starting
重要通知 – 需要许可证和激活
激活说明:
完成购买后,请立即联系我们以获取您的许可证密钥、密码或激活详情。没有这些,软件将无法运行。我们将确保激活过程顺利进行,并随时为您解答任何疑问。
多语言定制
为了提升您的交易体验,我们提供软件的多语言完整定制服务。我们的团队可以提供以下语言的翻译:
中文 | 法语 | 葡萄牙语 | 西班牙语 | 俄语
日语 | 德语 | 韩语 | 意大利语 | 土耳其语
只需告诉我们您偏好的语言,我们将定制指标,确保为您提供用户友好的体验。
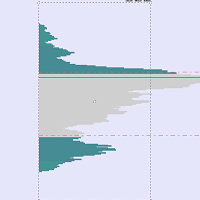
成交量分布 – 高级市场分析工具
成交量分布是一个复杂的分析工具,旨在为交易者提供对市场动态的深入洞察。它捕捉价格随时间的变化,提供实时图形化的拍卖数据表示,揭示影响价格变动的集体行为模式。
其核心是 价值区域 (Value Area) ,代表包含当天68%交易活动的价格范围。这一区域与标准差对齐,突出显示大多数交易发生的区域。
主要功能:
成交量控制点 (VPOC): 识别在指定时间内交易量最高的价格水平,作为公平价格。
价值
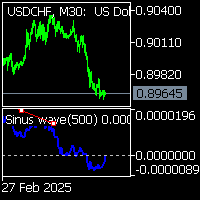
Sinus wave indicator is a extra ordinary oscillator.to find divergency.for mt5 it works all pairs and all timeframes. suitable for experienced and beginner traders.. indicator works on toward of the prices... while sinus wave go up side that means prices will up. and while sinus wave go down that means prices is going down. it gives divegency when trend reversals. there is wave to set default 500. on pictures divergency lines and letters has been drawn by hand.to explain how it works.
Title: MACD Signals Discover the MACD Signals indicator – your reliable assistant in the world of trading! Description: The "MACD Signals" indicator is designed to make your trading more successful and efficient. It displays signals on the main chart as bright vertical lines that are easy to spot. You can customize the color and thickness of these lines to perfectly match your style and preferences. Features: Signals: Vertical lines on the main chart that stand out among other elements.

The Currency Strength Inspector (CSI) is an indicator for MT5 that measures and displays in an intuitive way the relative strength of individual currencies. It evaluates the performance of the major forex currencies (namely AUD, CAD, CHF, EUR, GBP, JPY, NZD, and USD) by examining their behavior a gainst all the others' in the same basket. This helps traders to have a global view of the market and its underlying "sentiment", as well as to identify strong and weak currencies for potential trad

“ Easy Trend Scalper MT5 ”指标是为趋势方向内的剥头皮交易而设计的。
指标的工作原理。
该指标决定市场走势的方向。
红色大箭头表示看涨方向。
蓝色大箭头-表示看跌方向。
在看涨或看跌趋势中,有一种算法可以以小箭头的形式生成剥头皮信号。
橙色箭头是购买信号。
蓝色——表示销售。
可以用于任何交易工具和任何时间范围。 当信号出现时提供几种类型的警报,用于改变趋势方向和进入信号。 无需重新绘制,可让您预测 2-5 根蜡烛的价格走向。 箭头形成模式可以手动更改——在当前蜡烛上或在蜡烛收盘时。 在两种情况下,如果下一根蜡烛已经打开,则不会重新绘制前一根蜡烛上的箭头。
还可以手动更改需要为所需工具配置的参数。
“ Channel Width ” - 用于确定趋势的通道宽度,在较低时间范围内增加,在较高时间范围内增加。
“ Signal Generator ”——调整信号生成的频率,数字越大,信号数量越少。

Support & Resistance Auto Plot Lines Indicator for MT5 – Perfect for Scalping! Make your trading easier with our Support & Resistance Auto Plot Lines indicator for MT5. This powerful tool automatically detects key support and resistance levels on your chart, helping you make better trading decisions with minimal effort. Why Choose This Indicator? Perfect for Scalping – Quickly identify strong price zones for fast, precise entries and exits.
Automatic Level Detection – No need to manually dra

重要通知 – 需进行许可证和激活 激活说明: 完成购买后,请立即联系我们以获取您的许可证密钥、密码或激活详情。如果没有这些,软件将无法运行。我们将确保激活过程顺畅,并协助您解答任何问题。 多语言定制
为了提升您的交易体验,我们提供软件的多语言完整定制服务。我们的团队可以提供以下语言的翻译:
中文 | 法语 | 葡萄牙语 | 西班牙语 | 俄语
日语 | 德语 | 韩语 | 意大利语 | 土耳其语 只需告知我们您偏好的语言,我们将定制指标,确保提供用户友好的体验。 MT5市场轮廓指标 – 高级拍卖市场分析
市场轮廓是一种强大的图表工具,使交易者能够观察驱动所有市场运动的双向拍卖过程。它可视化了价格随时间的变化,揭示了群体行为和价格接受区域的关键模式。 本质上,市场轮廓是一个动态图形,持续记录和组织拍卖数据,帮助交易者精确地确定关键市场水平。 主要功能与概念 价值区域(VA) – 识别真正的市场平衡
价值区域表示包含一天交易活动中68%或70%(可调整)的价格范围,相当于价格分布的一个标准差。该区域突出显示了大部分交
在动态的交易世界中,混乱与模式交织在一起,Prime Breakout Convergence 如同一枚可靠的指南针,引导您在每一次交易决策中充满信心,并在市场中保持稳定。这不仅是一个手动系统;它是一个智能分析助手,能够解读深层次的市场趋势,将复杂的指标读数转化为清晰且可操作的交易决策。 为什么选择 Prime Breakout Convergence? 适应性: 通过利用先进的波动性分析方法,系统能够动态调整以适应市场条件,确保在各种时间框架下表现一致。 最佳入场点: 关键指标的组合充当有效过滤器,最大限度地减少错误信号,并仅在成功概率最高的时期启动交易。 多时段分析: Prime Breakout Convergence 跟踪亚洲、欧洲和美国交易时段的开盘情况,识别关键的相关性和分歧,使其成为交易 EURUSD、GBPUSD 和 USDCAD 的特别有价值的工具。 多功能性: 涵盖四个时间框架(M30、H1、H2、H3、H4),该系统既适合活跃的日内交易者,也适合专注于较长交易周期的交易者。 风险管理: 集成的风险评估机制优先考虑安全性和谨慎性,尽可能保护您的资

MURKA Levels PRO.
MURKA Levels PRO - is an indicator for MetaTrader 5, which displays High/Low, Open/Close, ATR levels (set manually) of the day, week, month on the chart. Marks round levels, signs the days of the week, numbers every week (you can set two types of round levels at the same time). ATH (All-time high) и ATL (All-time low). Levels are marked with price tags with a price symbol. Also, the indicator automatically calculates and displays on the chart the distance that the price has p
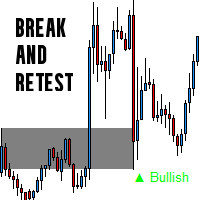
Break & Retest Indicator – Precision Market Structure Tool The Break and Retest Indicator is a powerful trading tool designed to help traders spot high-probability break-and-retest setups based purely on support and resistance levels . This indicator automatically identifies when price breaks a significant level and then retests it, providing clear bullish or bearish signals . Key Features: Automated Break & Retest Detection The indicator scans price action in real time to identify valid breakou

Probabilistic Price Predictor (QuantBreak Probability Suite) – The Bayesian Edge for Smarter Trading Unlock the Power of Probability in Market Forecasting. The Probabilistic Price Predictor is a revolutionary trading indicator that applies Bayes' Theorem to forecast breakout probabilities with mathematical precision. Instead of relying on traditional, rigid indicators, QuantBreak uses adaptive probability calculations to identify high-probability trade setups based on historical price action

Sonic R Indicator Description Overview The Sonic R Indicator for MT5 is designed to help traders analyze market trends using moving averages and volume analysis. This tool assists in identifying potential price movements by displaying trend zones and volume strength, making it suitable for various trading strategies. Key Features Dual EMA Trend Channels – Uses 34-period Exponential Moving Averages (EMA) to visualize price movement. Volume Analysis – A color-coded histogram to indicate changes i

If you are looking for precision in identifying strategic tops and bottoms, the ZigZag SMC/SMT Indicator for MT5 is the tool that will contribute to your technical analysis. Developed based on the advanced concepts of Smart Money Concepts (SMC) and Smart Money Trap (SMT), it offers an insight into market behavior, helping you make decisions.
What will you find in this indicator? Automatic identification of strategic tops and bottoms Based on institutional strategies Ideal for analyzing liqu
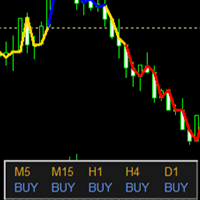
The trend indicator has the ability to adjust the viewing depth and sensitivity, does not repaint and does not lag. In addition to the current trend, the chart displays trends for 5 more periods with zero trend levels for them. This allows for a comprehensive assessment of the nature of the trend movement. There is a possibility to choose the trend algorithm settings {Only Open, Average Open/Close, Average High/Low} The trend indicator can be used for any Forex financial instruments. The color s

Adaptive Momentum Oscillator (AMO) – Next-Gen Momentum Indicator Overview The Adaptive Momentum Oscillator (AMO) is a powerful technical analysis tool that dynamically adjusts its sensitivity to market conditions by incorporating adaptive lookback periods, noise filtering, and normalization techniques . Traditional momentum indicators use fixed lookback periods, which can lead to inefficiencies in trending and ranging markets. The AMO overcomes this limitation by adapting its calculation based o
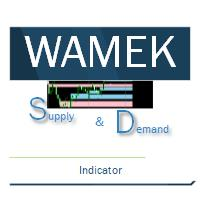
解锁机构级交易策略,使用我们的先进供需区指标! 利用我们的 供需区指标 ,掌握机构交易策略,精准识别金融市场中的 高胜率买卖点 !通过定位机构资金的买入和卖出区域,该指标让您能与市场大玩家同步交易,把握重大趋势反转,提升盈利机会! 为什么这款指标是专业交易者的必备工具? 无限历史区域扫描 – 自动检测并可视化关键的供需区,无需手动分析,适用于任何时间周期和资产。 精准锁定高盈利区域 – 该指标能清晰标记市场供需区,帮助您预测市场反转和突破,提高交易成功率。 自动扫描K线 – 实时信号提示潜在的入场点,让交易决策更加智能化。 清晰的颜色编码区域 :
粉色区域(供应区) – 突破后变成需求区,但颜色保持不变。
天蓝色区域(需求区) – 突破后变成供应区,颜色仍保持不变。 自动识别关键交易模式 :
Drop-Base-Drop(DBD) & Rally-Base-Drop(RBD) – 供应区。
Drop-Base-Rally(DBR) & Rally-Base-Rally(RBR) – 需求区。 掌握机构交易者的优势 大多数散户交易者亏损的

UzFx-Total TP'SL & Timer-MT5 指标旨在实时跟踪所有未平仓和挂单交易的总获利(TP)和止损(SL)值。此外,它还包括一个蜡烛倒计时器,用于显示当前蜡烛收盘的剩余时间。
(访问简介并查看所有其他 MT4/MT5 产品) (请不要忘记给予评论)
主要功能:
自动计算所有有效交易和挂单的预期总盈亏。 显示当前蜡烛收盘的剩余时间,帮助交易者有效管理进出场。 用户可以配置文本颜色、字体大小和位置,以提高可视性。 设计简单轻便,不会使图表变得杂乱无章。
用户输入: 选择止盈和止损显示的颜色。 自定义蜡烛计时器文本颜色。 调整字体大小和在图表上的位置。 使用案例:
️ 适合希望快速了解风险和收益水平的交易者,无需手动检查每个订单。 ️ 适合依赖蜡烛收盘时间来精确执行交易的剥头皮交易者和日间交易者。 ️ 通过对潜在盈利和亏损水平的一目了然,加强风险管理。

Currency Strength Indicator - Track Market Power
Overview: Gain a competitive edge with the Currency Strength Indicator for MetaTrader 5. This intuitive tool measures the relative strength of 8 major currencies and displays them in a clear, sortable table directly on your chart. Perfect for forex traders looking to identify strong and weak currencies at a glance. Key Features: Dynamic Strength Table: Displays real-time strength for EUR, USD, GBP, JPY, CHF, AUD, CAD, and NZD in the upper-left c
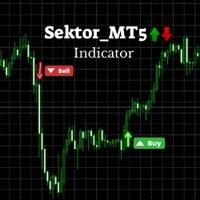
SektorMT5 - Advanced Trading Indicator Specification Automated Buy/Sell Signal Indicator for Meta Trader 5 (MT5)
Setting Description Recommended Value Timeframe (TF) The recommended chart timeframe for optimal signal accuracy. H1 (1 Hour) Symbol The financial instrument on which the indicator works best. XAUUSD (Gold) Lookback Period Number of candles used to determine breakout levels. 24 Candles (Adjustable) Buy Signal Green upward arrow appears when price breaks above resistance. Displayed on

BVP - 高级买卖方市场扫描器
通过BVP(买卖方面板)体验跨多个时间周期的实时市场情绪 - 这是一款为现代交易者设计的精密市场分析工具。 为什么选择BVP?
在当今充满活力的市场中,了解买方和卖方的主导地位至关重要。BVP在12个时间周期(从M1到D1)提供即时视觉反馈,帮助您在市场变化明显之前发现它们。 核心功能
具有动态百分比条的现代视觉界面 实时买卖方力量指标 一览多时间周期分析 带有颜色编码警报的智能信号系统 精确的百分比计算,助您做出明智决策 技术创新
BVP使用先进的计算方法来确定市场情绪,通过直观、清晰的实时更新界面显示买卖方比率。 实际优势
即时市场情绪概览 清晰的趋势强度视觉信号 多时间周期确认 快速决策支持 专业级精确度 谁需要BVP?
寻找市场方向的活跃交易者 分析多个时间周期的摆动交易者 需要情绪数据的技术分析师 需要快速市场解读的专业交易者 准备提升您的市场分析能力了吗?通过覆盖所有主要时间周期的精确市场情绪数据来改变您的交易。体验BVP带来的专业级市场分析能力。

高斯布林带结合高斯移动平均线 ️ 用一款将高级数学与技术分析实用性完美结合的创新指标,革新您的交易策略! ️ 无论您是初学者还是经验丰富的交易者, 高斯布林带 都能帮助您 提升市场分析的深度 。这一独特指标用高斯移动平均线 (GMA) 替代传统移动平均线,生成的布林带对市场的实际条件更加 敏感且适应性强 。 高斯布林带的亮点 ️ 独特的高斯移动平均线 :以高斯分布为基础,高效平滑价格数据,提供清晰准确的趋势识别。 ️ 可调节的参数 :可灵活调整周期、标准差和偏移量,以适应不同的资产和市场条件。 ️ 简单与复杂的融合 :既适合初学者,也能满足高级交易者对精准分析的需求。 如何使用及策略推荐 “突破外带,回归内带”策略 :当价格 突破外带 后又 回到内带 时,表明价格可能回归到中线,这是一种有效的入场机会,目标可设为中线位置。 超买和超卖区域捕捉 :利用上下轨识别 超买和超卖 区域,这些区域通常是高波动时的反转信号。 识别市场盘整阶段 :当布林带变窄时,这通常预示市场进入盘整,之后可能会出现剧烈波动,提前准备抓住机会。
MetaTrader市场是一个简单方便的网站,在这里开发者可以出售自己的交易应用程序。
我们将帮助您发布您的产品,并向您解释如何为市场准备您的产品描述。市场上所有的应用程序都是加密保护并且只能在买家的电脑上运行。非法拷贝是不可能的。
您错过了交易机会:
- 免费交易应用程序
- 8,000+信号可供复制
- 探索金融市场的经济新闻
注册
登录