适用于MetaTrader 5的技术指标 - 90

Antabod Genius Indicator—an advanced trading tool designed to give you accurate buy and sell signals directly on your MetaTrader 5 platform. Harnessing the combined power of Moving Averages (MA) and the Stochastic Oscillator, this indicator helps you identify optimal entry and exit points with ease. Key Features: • Precision with Dual Moving Averages: The Genius Indicator uses a fast and slow MA to detect key market momentum shifts. Crossovers between the MAs serve as reliable indicators for pot

Special Fair Value Gap (SFVG) Indicator
Unlock your trading potential with the Special Fair Value Gap (SFVG) Indicator! This innovative tool identifies critical price imbalances in the market, helping you pinpoint potential buying and selling opportunities with precision.
Key Features: - Multi Timeframe - Smart Money Tool - Identifies Key Price Levels: Automatically detects STRONG HIGH PROBABILITY gaps in price action where retracements are likely to occur, allowing you to make informed tra

Antabod Multiplier , the ultimate trading indicator designed to simplify your decision-making process and maximize your trading potential. Built with a robust combination of moving averages and stochastic oscillators, this tool provides clear, actionable signals for both buy and sell opportunities. The Antabod Multiplier stands out with its dynamic trend detection and precision filtering, giving you real-time visual signals to catch trend reversals and optimal entry/exit points with ease. Whethe

The "Profit and Fee" indicator was developed in MQL5 to help traders clearly visualize the fees involved in operations on the stock exchange (B3). It calculates and displays, in real time, the fees for emoluments and registration, allowing traders to understand the impact of these fees on their profit or loss.
Advantages and Features:
1. Financial Transparency: The indicator shows exactly how much you are paying in fees, providing a clear view of the real value of your operations. This helps
Overview
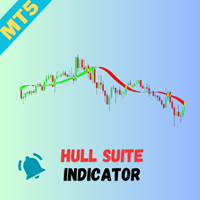
The Hull Suite is a highly responsive and smooth moving average indicator based on the Hull Moving Average (HMA), developed by Alan Hull in 2005. Known for its minimal lag and clear curves, the HMA has become a widely used technical analysis tool. This script brings together multiple Hull variations into one flexible and customizable indicator, ideal for traders looking for enhanced visual representation and trend analysis. Key Features
The Hull Suite offers three variations of the Hu

Description : In the world of trading, candlestick patterns are a popular technical analysis tool used by many traders. There are numerous candlestick patterns, ranging from reversal patterns to continuation patterns. However, remembering all these patterns can be challenging, especially for novice traders. This often leads to traders having to manually memorize and identify candlestick patterns, which can be time-consuming and prone to errors. Candle Pattern Pro is a powerful indicator desig

The first 100 units are gone for FREE! Now, grab the next 50 units at just $30 each. Act fast, because once they're gone, the price will jump to $99. Don’t wait
The *Rich Scalping* indicator is a powerful tool designed for traders who seek to maximize profits through fast-paced, short-term trading. Specifically tailored for scalping, it accurately identifies entry and exit points by detecting quick price movements and market trends.
With user-friendly signals and real-time alerts, Rich

Haven Market Session Time PRO – 您可靠的市场交易时段和新闻分析助手。 这款紧凑型指标能让您直接在图表上了解关键的交易时段和重要的经济新闻事件。您可以自定义需要显示的交易时段,例如亚洲、伦敦、美国等地区。 该指标会自动突出显示活动时间段,并显示每个交易时段的开始和结束时间。您还会收到即将发生的重要高影响经济新闻的提醒。 图表角落中的便捷面板显示纽约时间、服务器时间,以及距离最近新闻或交易时段的倒计时。该指标支持完全自定义,包括颜色、字体、对象显示等,满足您的个性化需求。 有了 Haven Market Session Time PRO ,您可以更高效地交易,基于对交易时段内市场活动的全面理解做出更明智的决策。 主要优势: 易于使用 :简单直观的界面设计。 灵活定制 :根据您的交易需求调整设置。 信息丰富但不冗余 :提供关键数据而不会造成视觉干扰。 提升交易效率 :通过更清晰的市场背景做出更好的决策。 高影响新闻提醒 :事件发生前15分钟发送通知。 交易时段提醒 :在每个时段开始时接收通知。

The Simple Market Sessions Indicator helps traders visualize the current status of major forex market sessions: Asian , London , New York , and Sydney . It shows whether each market is Open , Active (based on volume) , or Closed directly on the chart. With customizable session times and a volume threshold, this tool helps traders monitor session activity and volume strength, making it easier to decide the best times to trade.
Key features: Displays status: Open, Active (High Volume), or Closed

玻尔兹曼-霍普菲尔德混合预测指标是一个先进的MetaTrader指标,它结合神经网络预测和波动性分析来预测价格走势。该指标利用复杂的机器学习算法,通过结合玻尔兹曼机器和霍普菲尔德网络的优势,创建了一个强大的预测系统。系统会实时分析市场数据,并在每个新蜡烛图形成时自动进行学习。对预测的上涨走势显示绿色箭头,对下跌走势显示红色箭头。该指标仅在满足特定波动性条件时才生成信号,使用ATR、历史波动性和模式识别来过滤预测。波动性过滤系统允许交易者自定义ATR阈值、历史波动性周期和模式识别参数,以适应不同的市场条件和交易风格。机器学习算法持续学习市场条件以提高预测准确性,用户可以实时查看这些预测结果。该系统还包含了先进的风险管理功能,可以根据市场波动性自动调整预测信号的生成频率。 主要特点: 下一个周期方向的实时预测箭头 基于ATR、波动性和模式的高级过滤系统 玻尔兹曼-霍普菲尔德神经网络支持的机器学习预测 可自定义的波动性阈值参数 实时数据处理和可视化 自动学习和适应性预测系统 多时间周期分析支持 高级模式识别算法 自定义警报设置 详细分析报告生成 风险管理集成系统 市场条件自适应功能
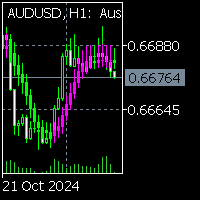
介紹適用於 MQL5 的線性回歸蠟燭指標 - 一款功能強大的工具,可在所有工具和時間框架中無縫運行。
此先進指標使用線性迴歸,直接在蠟燭圖上提供精確的趨勢可視化,幫助交易者精確識別價格方向和潛在反轉。
無論您是進行外匯、股票或商品交易,這款多功能工具都能為您提供清晰的市場動態洞察,從而增強您的決策能力。
線性回歸蠟燭指標是趨勢和區間交易的理想選擇,它能夠適應任何市場條件,確保所有水平的交易者都能獲得一致、可靠的結果。
如果您有任何問題,歡迎隨時詢問!
https://www.mql5.com/en/users/dennisfinimento (發送訊息)
給買家 如果您想將其納入有利可圖的自動化策略中,請隨時與我聯繫,我將根據您的要求和反饋,進行個人工作或將 EA 上傳到市場!

Multi-Timeframe Fractal Indicator Description for MQL5 Introducing the Multi-Timeframe Fractal Indicator! Key Features: Multi-Timeframe Analysis: Analyze Fractals on a timeframe independent of your chart's current timeframe. Gain insights from higher timeframes for informed trading decisions. Customizable Parameters: Timeframe: Choose the timeframe on which Fractals will be calculated (e.g., Daily, H4, etc.). Number of Bars: Specify the number of bars considered around a potential Fractal for c

Introducing Your Ultimate Trading Edge: Dynamic Support & Resistance, Advance Entry Levels Indicator for MT5 platform Unlock the power of precision trading with our cutting-edge Dynamic Support & Resistance Indicator. Designed to give traders unparalleled clarity, this indicator is your roadmap to identifying exactly where to buy and sell, maximizing your potential for consistent, sustainable profits. Why Choose Our Indicator? Crystal Clear Entry and Exit Points : No more guesswork. Our indicat
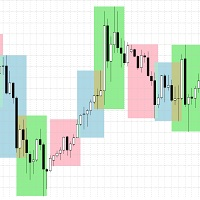
Session Boxes - Advanced Market Sessions Visualization Indicator
Overview The Session Boxes indicator is a powerful and highly customizable tool designed to help traders visualize major trading sessions directly on their charts. By clearly displaying the Asian, London, New York, Sydney, and Frankfurt sessions, traders can easily identify optimal trading times and potential market volatility periods.
Key Features
Multiple Session Support - Asian Session (Default: 00:00-09:00) - London Session

# Indicador MultiZigZag Pro para MetaTrader 5
O MultiZigZag Pro é um poderoso indicador técnico para a plataforma MetaTrader 5 que identifica, de forma inteligente e flexível, os principais pontos de inflexão e tendências nos gráficos de preços.
## Características principais: - Algoritmo avançado que filtra ruídos e movimentos irrelevantes do mercado - Múltiplos timeframes para análise de tendências de curto a longo prazo - Parâmetros de profundidade e desvio personalizáveis para adaptação a
Note 1:To get access to MT4 version please contact via private message. Note 2: Multi time frame option is not available with this indicator. To order multi time frame please contact via private message. This is the exact conversion from TradingView: "Supply and Demand Visible Range by LuxAlgo". The screenshot shows similar results from tradingview and Metatrader when tested on ICMarkets on both platforms. This is a light-load processing. Updates are made based on new candle open and chart updat
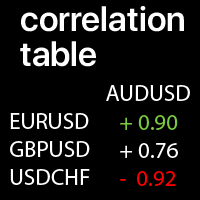
所选符号之间的相关性值:比较当前市场趋势 值为 +1: 表示完全 正 相关; 值为 -1: 表示完全 负 相关; 值为 0: 表示无明显相关性(价格互不影响,或相关性是 随机的 ); 我的 #1 工具 : 66+ 功能 | 联系我 如有任何问题 | MT4 版本 每个符号都可以自定义:删除 / 替换。每行 / 列最多可添加 10 个符号。 面板可以拖动到图表上的任何位置(任意拖放)。
在输入设置中,您可以配置: 用于计算的 周期 (所选时间帧的 柱数 )。 计算的 时间帧 :较高的 TF = 长期 相关性,较低的 TF = 短期 相关性。 极值 :用于警报和高亮显示。 高亮 选项:如果启用,极端相关性将以绿色 / 红色高亮显示。 警报 :可以为极值级别启用:正 / 负 / 两者。 视觉 样式:大小、深色 / 浅色主题。 程序文件必须放在 " Indicators " 目录中。
由于设置错误的takeprofit损失了多少利润。 有多少蜡烛图案拒绝工作,因为在他们形成的地方没有投标人感兴趣的领域。 在选择正确的全球方向时,错过的利润和无利可图的条目总是三分五裂的耻辱。 当我们试图在没有明确目标的情况下进行交易时,交易会带来很多痛苦和混乱。 通常,在交易手册或分析师预测中,他们会按照他们看到的方式绘制渠道和水平。 这没用! 问题是在这样的绘图中没有明确的规则和系统。 而这些大师的预测并不能得到真正成功交易的支持。 一百个人会画一百个不同的频道。 作为真正的交易者,我们每天都需要一个明确的计划。 基于这样的计划,我们将能够使我们的交易有利可图,并且更加有意识。 在从股市收集数据的同时,我们发现了大量积累的明显模式。 我们的方法是系统化水平的构建,并使它们达到任何金融工具的共同标准。 它的工作原理,它的工作原理惊人! 水平反映了市场参与者下达大限价订单的实际点。 股票价格计算出这样的水平非常准确。 使用"Tru"指标,您可以确定您的决定将在真正重要的交易量积累点做出。 你将获得一个强大的优势比其他投标人. 一个额外的免费添加是能够绘制重要的每周水平和标记烛台模式。

Supply & Demand Visible Range Indicator with Smart Alerts
Master the art of supply and demand trading with this powerful indicator that brings institutional-grade volume analysis to your charts! This sophisticated tool helps you identify key market levels where big players are active.
Key Features: - Dynamic supply and demand zone identification based on volume analysis - Smart alerts at crucial price levels (supply, demand, and mid-point zones) - Volume-weighted average calculations for pr

# Indicador MultiZigZag Pro para MetaTrader 5
O MultiZigZag Pro é um poderoso indicador técnico para a plataforma MetaTrader 5 que identifica, de forma inteligente e flexível, os principais pontos de inflexão e tendências nos gráficos de preços.
## Características principais: - Algoritmo avançado que filtra ruídos e movimentos irrelevantes do mercado - Múltiplos timeframes para análise de tendências de curto a longo prazo - Parâmetros de profundidade e desvio personalizáveis para adaptação a

Introducing Your Ultimate Trading Edge: Dynamic Support & Resistance, Advance Entry Levels Light Indicator for MT5 platform Unlock the power of precision trading with our cutting-edge Dynamic Support & Resistance Indicator. Designed to give traders unparalleled clarity, this indicator is your roadmap to identifying exactly where to buy and sell, maximizing your potential for consistent, sustainable profits. Why Choose Our Indicator? Crystal Clear Entry and Exit Points : No more guesswork. Our
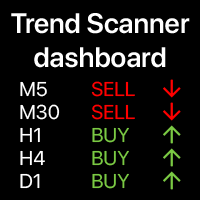
趋势仪表板:多时间框架指标,显示当前趋势的摘要 该工具 基于3个主要指标:RSI, 随机指标和商品通道指数。 警报 功能 将帮助 您 不会 错过 趋势 的 开始。 多功能工具 : 包含66+功能 | 联系我 如有任何问题 | MT4版本 多种选项将允许您根据需要自定义指标。 设置: 计算柱:当前(浮动)或上一个(已关闭)。 9个主要时间框架 可用: 每个 可以 选择 开启/关闭。 随机指标 : %K线周期; %D线周期; 慢速值; RSI指标: 快速周期; 慢速周期; 可视化 设置 : 颜色:买入、卖出和中性信号; 字体大小,距离乘数; 警报 设置 : 电子邮件/终端/推送(移动端); 程序文件必须放在" Indicators "目录中。 多功能工具 : 包含66+功能 | 联系我 如有任何问题 | MT4版本

释放斐波那契的力量,使用自适应斐波那契趋势带 (AFTR)! 准备好颠覆您的交易策略了吗?AFTR不仅仅是一个指标——它是您发现趋势、分析反转和精准操作的终极工具,提供无与伦比的清晰度。通过将强大的斐波那契数列与先进的多重移动平均线相结合,这款指标专为追求精确和灵活的交易者而设计。 让您脱颖而出的关键功能: 具有斐波那契精度的多重移动平均线 直观的趋势检测 动态彩色趋势区域 完全可定制,适应所有市场情况 趋势带在移动平均线之间填充颜色,随着趋势的强弱而变化。轻松识别关键水平和反转点,获得视觉确认,让您自信地抓住交易机会。 强化您的交易的洞察力: 基于斐波那契的市场掌控。 自信识别趋势和反转。 直观且快速的决策。 通过AFTR提升您的交易水平,将图表转化为市场走势的清晰地图。对新手和专业人士而言,这是一款在任何市场条件下赢得竞争优势的必备工具。 限时价格30美元,仅限前250次销售。在250次销售后,价格将上涨至100美元。
由 ChatGPT 版本 GPT-4 翻译

The "NBank Levels MT5 Indicator" is an essential tool for traders looking to refine their market strategies with precision. This indicator identifies and displays the key price levels for both the current day and the previous day, allowing traders to pinpoint exact entry points. By focusing on these specific levels, traders can enhance their decision-making process, leading to more accurate trade executions.
This indicator is designed to simplify the trading experience. It presents data clearl

Hey there! If you are using Moving Average indicator into RSI indicator's window and always wondering if there could be a way to get alerts on your smartphone when those two indicators get a crossover that would be great, right!? Then you have found the right tool for that. This indicator is nothing but a mix of MA indicator and RSI indicator into one indicator window as well as it will give you alerts for crossovers on your smartphone app, email and also on your trading terminal's (desktop) cha

Nro Lines 指 标通过线条绘制,提供了关键价格水平的精确和动态可视化。 这一功能使交易者能够执行优化的技术分析,这对于制定有效的交易策略和做出果断的市场进出决策至关重要。 主要功能: - 根据市 场变化调整的动态参考线,为交易者提供最新和相关的视觉表示。 - 自 动计算相关水平,使用户能够专注于图表解释。 - 与多个全球市 场兼容,使其成为在世界各地不同金融领域运作的交易者的多用途工具。 - 可 为不同的市场交易时段自定义时间表,这对于在不同时区操作或专注于特定交易时间的市场的交易者至关重要。 - 可自定 义的线条颜色、样式和粗细,允许每个交易者根据自己的视觉偏好和分析需求定制指标。 - 趋势线的固定或动态模式之间的灵活性,这意味着指标可以配置为自动适应市场条件或保持稳定以进行比较分析。 此外, Nro Lines 指 标设计用于任何类型的资产和图表时间框架,使其成为股票市场、外汇、商品、加密货币等的理想选择。 它的适用性使其成 为寻求在全球市场获得竞争优势的交易者不可或缺的工具,特别是那些需要将分析与特定交易时段时间同步以最大化成功机会的交易者 。

Loud Key Levels MT5 Indicator The "Loud Key Levels" indicator for MetaTrader 5 is an innovative trading tool designed to enhance your market analysis by identifying critical support and resistance levels. This indicator simplifies the decision-making process for traders by providing a visual representation of average key levels, as well as upper and lower close key levels, facilitating a clearer understanding of potential price action. Key Features Average Key Levels : The core function of the
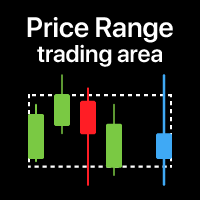
价格区间: 可视化 选定 时间 周期 的 交易 范围 特别 适用于 低 时间 框架 交易 , 以便 查看 更高 时间 框架 的 范围 。 我的 #1 工具 : 66+ 功能,包括此指标 | 联系我 如有任何问题 | MT4版本 适用场景: 使用多时间框架分析时 查看不同周期的整体情况 查看 选定 周期 的 完整 范围 设置: 区间颜色 填充区间: 若为 ' false ' , 则 仅 显示 范围 边界 线 包含当前(浮动)K线:若为' true ',当前(未闭合)K线也将计入范围。 计算方法:基于 实体 (开盘-收盘) / 影线 (最高-最低) 计算 所用 周期数 (下一参数) 周期类型 : K线 / 分钟 / 小时 / 天 使用[ K线 ]类型时,还需设置计算时间框架。 //----- 我的 #1 工具 : 66+ 功能,包括此指标 | 联系我 如有任何问题 | MT4版本
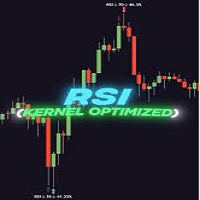
GENERAL OVERVIEW
Introducing our new KDE Optimized RSI Indicator! This indicator adds a new aspect to the well-known RSI indicator, with the help of the KDE (Kernel Density Estimation) algorithm, estimates the probability of a candlestick will be a pivot or not. For more information about the process, please check the "HOW DOES IT WORK ?" section. Features of the new KDE Optimized RSI Indicator :
A New Approach To Pivot Detection
Customizable KDE Algorithm
Realtime RSI & KDE Dashboard
Alert

TrendFusionXplorer consists of three powerful trend-analyzing indicators — TRP , PMax and OTT — developed by Kivanc Ozbilgic. Each indicator displays the trend's support and resistance levels based on its unique properties and methodology. TrendFusionXplorer assists in determining entry and exit points for markets and can also be used for setting trailing stop-loss (SL) and take-profit (TP) levels on open positions.
Specifications
1. Trend Reversal Predictor (TRP): TRP follows Thomas R. DeMar
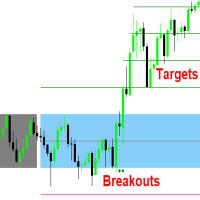
This indicator measures and displays the price range created from the first period within a new trading session, along with price breakouts from that range and targets associated with the range width. The Opening Range can be a powerful tool for making a clear distinction between ranging and trending trading days. Using a rigid structure for drawing a range, provides a consistent basis to make judgments and comparisons that will better assist the user in determining a hypothesis for the day's pr

AutoFib: Advanced Fibonacci Retracement for MetaTrader 5 Automate Fibonacci Analysis for Smarter Trading Decisions AutoFib simplifies Fibonacci retracement analysis by automatically identifying key levels of support and resistance directly on your MT5 charts. Whether you're new to Fibonacci analysis or an advanced trader, AutoFib enhances your ability to identify potential reversals, continuations, and critical price levels. Key Features: Automatic Fibonacci Levels – Identify retracement and ext
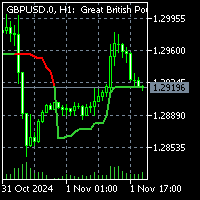
To get access to MT4 version please contact via private message. This is the exact conversion from TradingView:"ATR Trailing Stoploss" by "ceyhun" The screenshot shows similar results from tradingview and Metatrader when tested on ICMarkets on both platforms. This is a light-load processing indicator. It is a non-repaint indicator. Colored Candle option is not available. Buffers are available for processing in EAs. You can message in private chat for further changes you need.

This indicator automatically draws trendlines, Fibonacci levels, support and resistance zones, and identifies BOS (Break of Structure) and CHOCH (Change of Character) patterns on the chart. Just by placing it on the graph, it handles the essential technical analysis tasks for traders, providing a streamlined, effective trading tool this tools is alway make every one easy for trading.

This is an advanced trend indicator designed to accurately identify reversals and the beginning of trend movements. With this tool, you will be able to receive high-quality signals for entering and exiting the market, minimizing false entry points and increasing the profitability of transactions. The indicator is suitable for any assets (currency pairs, stocks, indices) and time intervals, from minute to daily charts.

PLEASE NOTE THIS IS PROACTIVE PRODUCT, NOT A DONE FOR YOU SET AND FORGET. YOU MUST KNOW ABOUT OTPIMIZATION AND WANT TO BUILD YOUR OWN EA . Prop Trading Code is one of a kind product that lets you build your own prop trading EA to attempt to pass a challenge taking it buy each day. This is a generator that has all the conditions to generate a code that you can then use to build your own prop trading EA in your strategy tester. This empowers the trader to generate, define, build, alter and use

大家好,这里是流浪者队 Fx 我们成功地创建了捕捉 Boom 1000 指数、Boom 500 指数和 Boom 300 指数峰值的指标,事实上,该指标适用于所有可用的 Boom 以及未来仍将出现的其他 Boom。 如何使用该指标 首先,您必须将时间范围调整为 M1/M5 时间范围,该指标将向您发送警报,告知何时进行买入交易以及何时退出/平仓交易 (X),并且当您打开交易时不要害怕,并且只要该指标没有向您显示退出标志 (X),您就处于亏损状态,这意味着您仍然处于正确的市场方向 该指示器不重新绘制,它只会向您显示您在教程中看到的内容,仅此而已 请随时在 Mql5 上测试该指标或通过 WhatsApp me 获取它或直接在 Mql5 上购买 WhatsApp +27786420491 Dàjiā hǎo, zhèlǐ shì liúlàng zhě duì Fx wǒmen chénggōng de chuàngjiànle bǔzhuō Boom 1000 zhǐshù,Boom 500 zhǐshù hé Boom 300 zhǐshù fēngzhí de zhǐbiāo, shì

大家好,这是 Rangers Fx,我们成功地创建了捕捉 Crash 1000 指数、Crash 500 指数和 Crash 300 指数峰值的指标,事实上,这个指标词针对所有可用的 Crash 以及未来仍将出现的其他 Crash。如何使用该指标 首先,您必须将时间范围调整为 M1/M5 时间范围,该指标将向您发送警报,告知何时进行卖出交易以及何时退出/平仓交易 (X),并且不要害怕您开仓交易,只要该指标不向您显示退出标志 (X),您就处于亏损状态,这意味着您仍处于市场的正确方向。该指标不可重新绘制,它只会向您显示您所看到的内容在教程中仅此而已,请随意在 Mql5 上测试此指标或通过 WhatsApp 我获取它或直接在 Mql5 上购买 Dàjiā hǎo, zhè shì Rangers Fx, wǒmen chénggōng de chuàngjiànle bǔzhuō Crash 1000 zhǐshù,Crash 500 zhǐshù hé Crash 300 zhǐshù fēngzhí de zhǐbiāo, shìshí shàng, zhège zhǐbiāo cí

Cycle Identifier Pro: Advanced Swing Highs & Lows Indicator Description: Unlock the full potential of your trading strategy with Cycle Identifier Pro , a cutting-edge indicator meticulously designed to pinpoint swing highs and swing lows with unparalleled precision. Whether you’re a seasoned trader or just starting out, Cycle Identifier Pro offers the tools you need to navigate any market condition across all timeframes with confidence. Key Features: Accurate Swing Detection : Swing Highs and Lo

The Supertrend Indicator is a powerful trend-following tool designed for traders who seek clarity in identifying bullish and bearish market trends. Built for MQL5, it provides real-time analysis and helps users make informed trading decisions by highlighting entry and exit points. With customizable settings, this indicator adapts to various market conditions, ensuring flexibility and accuracy in trading strategies.

Imbalance DOM Crypto:通过加密货币订单薄的不平衡提升您的交易 小幅价格波动中的机会
Imbalance DOM Crypto 是一款不可或缺的工具,适合在加密货币中交易订单流的分析师。它非常适合剥头皮交易者,旨在帮助那些希望以高精度利用小幅价格波动的交易者。通过先进的计算,指标可以识别订单薄中的不平衡,为快速进出提供有价值的信号。 重要提示:设置和Binance数据收集脚本
为了使Imbalance DOM Crypto正常工作,必须加载 Book Data Binance 脚本。该脚本直接从Binance提取订单薄数据,使指标能够实时访问买卖信息,从而生成准确的计算。确保脚本处于活动状态并正确配置,以便指标能够实时捕捉订单薄的不平衡。 Imbalance DOM Crypto的好处 带有清晰颜色的高级订单薄分析
Imbalance DOM Crypto 通过特定颜色使订单不平衡的可视化变得更加简单: 绿色: 表示订单薄中的买单。 红色: 表示订单薄中的卖单。 金色: 指示买单和卖单之间的不平衡。 这些颜色允许快速清晰地读取订单流,

Times and Sales Crypto: 用 Times and Sales 在加密货币中提升你的交易 利用小幅价格波动进行精准操作 Times and Sales Crypto 是一款针对加密货币中订单流操作的必备工具。它非常适合做短线交易的交易员,专为那些希望利用小幅价格波动进行高精度操作的用户设计。通过先进的计算,该指标利用 times and sales 数据,提供宝贵的信号,帮助进行快速进出交易。 重要提示:Binance 数据收集脚本配置 为了使 Times and Sales Crypto 正常工作,必须加载 Volume Flow Binance 脚本。该脚本直接从 Binance 收集 times and sales 数据,允许该指标实时获取交易信息以进行精确计算。确保该脚本已激活并正确配置,以便指标可以实时捕捉交易数据。 Times and Sales Crypto 的优势 先进的 Times and Sales 分析与清晰的视觉效果 Times and Sales Crypto 通过特定的颜色简化了交易数据的可视化: 绿色
Japanese Candle Patterns (JCP) User Guide Overview and Features Japanese candlestick patterns, a foundational element of technical analysis, provide traders with visual insights into market psychology. Each pattern represents the battle between bulls and bears, encapsulating critical information about market sentiment, potential reversals, and continuation signals. Developed centuries ago and later popularized by Steve Nison in Japanese Candlestick Charting Techniques , these patterns are now wi

ICT Liquidity Levels 是一个高级指标,为追求精准交易的交易者设计,利用机构水平进行交易。该指标显示重要的每日和会话价格水平,提供符合 ICT Silver Bullet 策略的结构化视图,从而更加清晰和聚焦。 功能: 全面关键水平: 指标标记关键价格水平,包括: 每日高点和低点(当前和前一天) 伦敦会话高低点(当前和前一天) 纽约早盘和下午会话高低点(当前和前一天) 纽约午夜开盘价 ICT Silver Bullet 时间段内显示: 关键水平仅在 Silver Bullet 时间段内显示,减少图表杂乱,让交易者轻松扩展目标水平。 溢价和折价区: 每个会话使用颜色区分溢价和折价区域,参考纽约午夜开盘价。该视觉区分增强高概率区域的决策。 灵活的水平控制: 用户友好的控制面板允许交易者根据个人策略显示或隐藏任何关键水平。 ICT Key Levels 指标提供直观的工具,支持基于 ICT 的策略,适合追求机构关键水平的交易者。

The First Dawn indicator uses a unique mechanism to search and plot signals.
This keeps searching for signals, making it a great indicator for scaping and identification of changes in direction, swing trading and trend trading.
The First Dawn helps you get early signals. The backtest gives the true picture of how the indicator works with real/demo accounts.
Although this is a tiny indicator it is packed with advantageous settings that will help you whether you desire to: Snap the Peaks a

关于指标 该指标基于金融工具收盘价的蒙特卡罗模拟。按照定义,蒙特卡罗是一种统计技术,用于通过基于之前观察的结果的随机数来模拟不同结果的概率。
它是如何工作的? 该指标通过基于历史数据模拟随时间变化的随机价格变动,为证券生成多个价格情景。每次模拟试验使用随机变量来有效地模拟未来在给定时间范围内的市场波动,重点在 收盘价 的波动。
蒙特卡罗模拟的优势 - 蒙特卡罗模拟通过在多种可能的未来情景下进行测试,有助于分析不同交易策略的风险。 - 它有助于确定策略在不同市场条件下的表现,包括罕见的极端事件(尾部风险)。 - 与依赖单点预测不同,蒙特卡罗提供了具有相关概率的潜在结果范围。这有助于理解盈利或亏损的可能性。
对于希望基于不同结果的概率而不是绝对预测来管理风险的交易者来说,蒙特卡罗是一个有用的工具。

This indicator identifies and visually displays Support and Resistance zones on a financial chart, providing traders with critical insights into market structure and potential price action areas. Here's how it operates: Key Features: Zone Identification: Detects Support Zones (price levels where buying pressure is historically strong). Detects Resistance Zones (price levels where selling pressure is historically strong). Categorizes zones into: Weak Zones Untested Zones Turncoat Zones (previousl
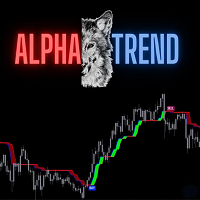
AlphaTrend is a brand new indicator which inspired by Trend Magic. In Magic Trend we had some problems, Alpha Trend tries to solve those problems such as:
1-To minimize stop losses and overcome sideways market conditions.
2-To have more accurate BUY/SELL signals during trending market conditions.
3- To have significant support and resistance levels.
4- To bring together indicators from different categories that are compatible with each other and make a meaningful combination regarding momen

ProEngulfing的免费版本是QualifiedEngulfing,每天仅限一个信号并具有较少的功能。 加入mql5社区的Koala Trading Solution频道,了解所有Koala产品的最新消息,加入链接如下: https ://www .mql5 .com /en /channels /koalatradingsolution 此产品的MT4版本可通过以下链接下载: https ://www .mql5 .com /en /market /product /52023 介绍ProEngulfing - 您的专业吞没形态指标,适用于MT4。 通过ProEngulfing,体验精准度的力量。此前沿指标专为识别和突出外汇市场中的高质量吞没形态而设计。ProEngulfing适用于MetaTrader 4,采用精确的形态识别方法,确保您仅接收最可靠的交易信号。 ProEngulfing如何运作: ProEngulfing使用复杂的算法,超越简单的形态识别,对吞没形态进行全面分析。该指标应用资格标准,评估烛体和影线的比例以确定整根蜡烛的大小。这种严谨的评估确保仅突出显示高概率

Hurst Cycles Diamonds Description This indicator is an alternative version inspired by the pioneering work of David Hickson and the Hurst Cycles Notes indicator developed by Grafton. The main objective is to provide a clear and intuitive view of the Hurst cycles. Credits Original Concept : David Hickson - Hurst Cycles Theory Inspiration : Grafton - Hurst Diamond Notation Pivots Alternative Version : Fillipe dos Santos Main Features Identifies and displays pivots in multiple time cycles Visual t
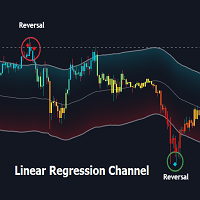
Overview:
The Linear Regression Channel Indicator is a versatile tool designed for Metatrader to help traders visualize price trends and potential reversal points. By calculating and plotting linear regression channels, bands, and future projections, this indicator provides comprehensive insights into market dynamics. It can highlight overbought and oversold conditions, identify trend direction, and offer visual cues for future price movements.
Key Features:
Linear Regression Bands: ( figur

Description :
The "MVRV by Age Approximation" indicator offers traders a unique on-chart visualization of the Market Value to Realized Value (MVRV) ratio, segmented by holding periods, or "age cohorts." This indicator is designed to approximate the MVRV metric by categorizing assets into short-term, mid-term, and long-term holders, providing a clear view of the relative unrealized profit or loss across different holding periods. Using simple moving averages over adjustable periods, this indicato

MLD RSI MT5 指标:利用自定义警报最大化 RSI 的潜力 简介 MLD RSI 指标为 MT5 添加了经典相对强弱指数(RSI)的高级功能,包括可自定义的警报和趋势确认功能。该工具非常适合初学者和经验丰富的交易者,并且适用于多种市场,包括外汇、股票、加密货币和合成指数。 什么是 RSI? 相对强弱指数(RSI)在 0 到 100 的范围内测量价格的动量: 高于 70 的数值表示资产超买。 低于 30 的数值表示资产超卖。 在强劲趋势中,标准的 RSI 信号可能会产生误导,因为 RSI 可能会长时间停留在超买或超卖区域。MLD RSI 指标通过帮助避免假信号并更好地选择交易入场时机,改进了 RSI 信号的解读。 MLD RSI MT5 的主要功能和优势 关键 RSI 水平的自定义警报 : 为超买水平(默认为 70)、超卖水平(默认为 30)以及 RSI 中线 50 设置独立的警报。 根据趋势方向自定义您想要收到的警报。 适应多种市场和时间框架 : 支持所有与 MT5 兼容的资产,包括外汇、加密货币、合成指数和商品。 适用于所有时间框架,为剥头皮交易和波段交易提供灵活性。 适用于

GTrendDetector Индикатор GTrendDetector предоставляет сигналы на покупку и продажу. Индикатор рассчитывает границы канала по рекурсивному методу, а также среднее, полученное из этих границ. Выход цены закрытия за границы канала генерирует сигналы на покупку/продажу. Индикатор рисуте границы канала, окрашивает область между средней и ценой закрытия, и выводит на график значки в местах смены тенденции. Входные параметры: Source - тип цены для расчета границ канала. Length - количество баров для ра
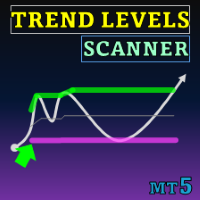
Special offer : ALL TOOLS , just $35 each! New tools will be $30 for the first week or the first 3 purchases ! Trading Tools Channel on MQL5 : Join my MQL5 channel to update the latest news from me 趋势水平 (Trend Levels) 指标精心设计,帮助在市场波动中确定关键的趋势水平——高、中、低。在自定义回溯期内基于最高、最低和中位值的实时计算,该工具为交易者提供了关于趋势动态和强度的结构化视图,帮助他们做出精确的交易决策。 查看更多 MT4 版本: Trend Levels MT4 查看更多产品: 所有产品 趋势水平指标的主要特点及使用方法 趋势变化信号 该指标通过追踪选定输入周期内的最高和最低值来识别趋势变化。当当前的最高值达到最大值时,指标显示上升趋势;相反,当当前的最低值达到最低水平时,显示下降趋势。这些趋势变化会在图表上以视觉方式呈现,帮助交

Here I bring you the Binary Boss OT1.0 MT5 indicator that provides signals for trading the rise or fall, higher or lower, call or put and more different options on the binary brokers.
This arrow indicator uses the technical trading rules, the candle patterns .The arrow appears at the opening of the candle for quick entries and the indicator provides multiple signals a day for more chances.
Instructions: On Deriv or Iqoptions, set time duration between 40 sec and 5 minutes.(According to your

Makuchaku Super Order Block
Introducing the "Makuchaku Super Order Block" – an all-in-one, powerhouse trading tool that combines the market’s most effective indicators in one, intuitive interface. This is more than just an indicator; it's a comprehensive market intelligence solution. Engineered for peak performance and precision, OBFVG is the best indicator of 2024 and a must-have for every serious trader. Let's dive into the key features of this indicator and how each can enhance your trading
Pivot Lines (PL) User Guide Overview and Features The Pivot Lines Indicator (PL) provides traders with a powerful tool for identifying potential support and resistance levels based on well-established pivot point calculation methods. By offering insights into possible price turning points, this indicator helps traders make more informed trading decisions and refine their entry and exit strategies. With customizable settings for different timeframes and calculation methods, PL is versatile and a

Fibo Daily Channel Indicator The Indicator is a powerful tool for traders, providing precise daily support and resistance levels based on Fibonacci retracement and extension calculations. This indicator automatically draws key pivot points (PP, R1, R2, S1, S2) as well as additional extension levels (R3, R4, S3, S4), helping traders identify potential reversal and breakout zones with ease. It includes customizable alerts and push notifications, allowing traders to receive updates whenever the pr
Trend Risk Indicator PRT finds trendy parts of the price movement and indicates the trend presence by a value in the buffer. Can be used for flat trading to disable trading when there is a possibility of price exiting the channel (recommended for D1) , in which trades are performed. It has two input parameters: • Bands range — bands calculation range • Deviation — the deviation value (the width of the allowed channel)
趨勢風險指標 PRT 發現價格變動的趨勢部分,並透過緩衝區中的數值指示趨勢的存在。 可用於橫盤交易,以在價格有可能退出執行交易的通
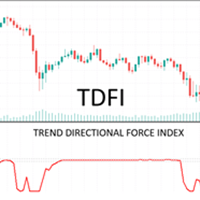
Trade Directional Force Index (TDFI) v1.0 One of the greatest challenges for trend traders lies in effectively timing entries and exits during periods of consolidation. These phases are often characterized by lower-than-average trading volume, making them tricky to navigate. In markets where volume data is unavailable, such as forex, the Trend Direction and Force Index (TDFI) serves as a reliable substitute. This is because volatility and volume are closely intertwined. What if you had an indica

解锁由SS7Trader开发的Neural FX Indicator的AI力量——这是一个基于神经网络的高级工具,旨在优化您在多个市场的交易表现。无论您交易的是外汇、股票、加密货币、指数还是XAUUSD,这款强大的指标都能提供非重绘的清晰买入和卖出信号,信号始终保持不变,让您能够实时自信地做出决策。 Neural FX Indicator专为MetaTrader 5 (MT5)平台设计,与全球最受信赖的交易平台之一完全兼容。支持所有时间周期,它可以无缝适应不同的交易风格,为您在各种市场条件下提供成功所需的灵活性。 主要功能: 多市场兼容性: 可应用于外汇、股票、加密货币、指数、XAUUSD等多个市场。 非重绘技术: 提供稳定可靠的信号,确保决策精准。 AI驱动: 基于最先进的神经网络算法,确保高准确度的交易信号。 仅支持MT5: 专为MetaTrader 5平台设计,提供全面强大的交易功能。 灵活的时间周期: 支持任何时间周期,适用于多种交易策略。 清晰的买入/卖出信号: 简单易懂的指标,帮助快速做出精准决策。 使用指南: 买入信号: 当市场在指标图表中的50水平线之上时: 等待买入信

Sliding Average with Bollinger Bands General Information: The indicator combines two popular technical analysis tools: Moving Averages (Simple Moving Average and Smoothed Moving Average) to assess the trend. Bollinger Bands to analyze market volatility. Main Components: SMA (Simple Moving Average): The simple moving average is calculated as the arithmetic mean of prices over a specified period. Formula: = (1 + 2 + ⋯ + ) / Where: 1, 2, …, are the closing prices for p
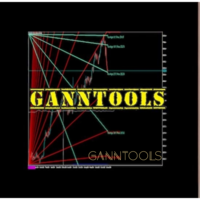
GannTools Indicator
The GannTools Indicator is a powerful trading tool inspired by W.D. Gann's strategies. This indicator provides traders with dynamic support and resistance levels, trend analysis, and key price patterns using Gann angles and cycles. Key Features: Customizable Gann Fans, Angles, and Cycles for precise market analysis. Automatic identification of key price levels and trend directions. Works on all timeframes and instruments for flexible trading strategies. Integrated visualiza

The Optimized MACD Divergence indicator is a powerful tool designed to identify potential trading opportunities by detecting divergences between price action and the MACD indicator. It combines classic divergence analysis with candlestick pattern recognition and volume filtering to provide more accurate and reliable signals. How it Works The indicator operates on the following principles: MACD Calculation: It calculates the MACD indicator using user-defined parameters for fast EMA, slow EMA,
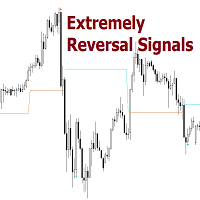
Reversal Signals [AlgoAlpha] – Master Market Reversals with Precision!
Elevate your trading strategy with the Reversal Signals indicator by AlgoAlpha. This advanced tool is designed to pinpoint potential bullish and bearish reversals by analyzing price action and, optionally, volume confirmations. It seamlessly combines reversal detection with trend analysis, giving you a comprehensive view of market dynamics to make informed trading decisions.
Key Features
Price Action Reve
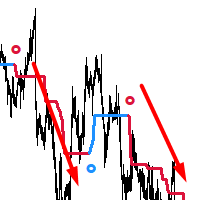
AdaptiveTrendHunter - 自适应趋势捕捉指标 主要特点: 通过颜色编码轻松识别趋势(蓝色表示上升趋势,红色表示下降趋势) 清晰的入场信号(通过箭头标记) 智能适应市场波动性 可自定义趋势确认设置 可选的新交易信号提醒 使用方法: 跟随趋势: 观察蓝色线条指示潜在上升趋势 观察红色线条指示潜在下降趋势 等待颜色变化以确认趋势转换 入场信号: 向上箭头表示适合买入的时机 向下箭头表示适合卖出的时机 始终确保箭头方向与主趋势线颜色相匹配 交易管理: 将趋势线用作动态支撑/阻力位 监控颜色变化以识别潜在的趋势反转 结合您自己的出场策略和风险管理规则 重要提示: 信号在当前K线形成,这意味着随着K线发展可能会重绘 始终采用适当的风险管理 - 不要仅仅依赖指标信号 在实盘交易前先在历史数据上进行充分测试 最佳效果来自与其他分析工具的结合使用 "延迟"参数允许您调整指标对价格变动的敏感度 推荐用途: 适用于任何时间周期 兼容所有交易工具(外汇、股票、加密货币、大宗商品) 同时适用于趋势跟踪和反转策略 适合日内交易和波段交易 技术说明: 箭头外观和位置可自定义 新信号可选报警系统 针
The MACD Divergence Indicator is a powerful tool designed to identify Classical (Normal) Divergences on the MACD, which can signal potential market reversals or continuation trends. Divergences occur when the price and the indicator move in opposing directions, highlighting potential shifts in momentum. What is a Classical (Normal) Divergence? Classical Divergences are categorized into two main types: Bullish Divergence: Occurs when the price forms lower lows, but the MACD forms higher lows. Thi

A2 Trade proudly present to you, Advanced and FULLY CUSTOMIZABLE Order Block to assist the traders for find the Supply and Demand or Support and Resistance Levels. The traders could customize of each areas to make it different from another areas, and the traders also can set the Supply and Demand or Support and Resistance timeframes themselves. hope you'll enjoy it.
MetaTrader市场是 出售自动交易和技术指标的最好地方。
您只需要以一个有吸引力的设计和良好的描述为MetaTrader平台开发应用程序。我们将为您解释如何在市场发布您的产品将它提供给数以百万计的MetaTrader用户。
您错过了交易机会:
- 免费交易应用程序
- 8,000+信号可供复制
- 探索金融市场的经济新闻
注册
登录