适用于MetaTrader 5的技术指标 - 85

The Angle Prices indicator is a tool that calculates the price angle based on price analysis, interpreting the time vector in the form of price points on the price chart. In other words, the X axis and Y axis are represented as price points, so you can actually calculate the angle with two axes of the same dimension. This allows traders to obtain information about the direction of price movement and possible entry or exit points for trades. Let's look at the main characteristics and interpretat

您准备好将您的交易提升到一个新的水平吗?隆重推出 WH Divergence Pro MT5 ,
先进的背离指标,让您可以从各种流行的技术指标中进行选择。
现在,您可以定制背离信号以匹配您独特的交易策略。 购买后联系我指导您完成整个过程 主要特征 :
指标选择 :从以下选项中选择您喜欢的指标: RSI(相对强度指数)。 很棒的振荡器。 CCI(商品通道指数)。 将添加更多指标。 精确信号 :根据您选择的指标,当出现背离或收敛时接收警报。 可定制的参数 :调整灵敏度、时间范围和其他设置以微调您的信号。 非重画 :信任准确的信号,无需担心重画。 怎么运行的 :
选择您的指标 :选择与您的交易风格产生共鸣的技术指标。 现货正常背离 :当所选指标和价格朝相反方向移动时,Divergence Pro 会检测到它。 现货隐藏背离 :当指标和价格朝同一方向移动时,Convergence Pro Plus 发出潜在回调的信号。
为什么使用 WH Divergence Pro MT5 ?
指标自由度 :选择与您的分析相符的工具。 微调 :自定义参数以匹配您的风险承受能力。 可靠的

Combination of Ichimoku and Super Trend indicators, with Signals and live notifications on Mobile App and Meta Trader Terminal. Features: Display five reliable signals of ARC Ichimoku Filter signals by their strength level (strong, neutral, weak) Send live notifications on Mobile App and Meta Trader terminal S ignals remain consistent without repainting Applicable across all time-frames Suitable for all markets Notifications format: "ARC Ichimoku | XAUUSD | BUY at 1849.79 | Tenken-Kijun cross |

Introducing the B4S BidLine CandleTimer An insightful indicator that combines real-time bid line visualization with a dynamic countdown timer. Gain a competitive edge in your trading as you stay informed about the time remaining until the next candle starts, all displayed seamlessly on your chart. Why B4S BidLine CandleTimer? Unleash the potential of your trading strategy with the B4S BidLine CandleTimer. Here's why this indicator stands out: Real-Time Bid Line: Witness market movements like nev

Brief Description: An advanced navigation, news display, and control panel indicator designed to revolutionize your chart analysis experience. Seamlessly navigate through timeframes, dates, and times with an intuitive control panel, and stay informed with visually represented detailed news events. Now with enhanced features and improvements for an even better trading experience. Key Features: User-Friendly Control Panel: Easily navigate through timeframes, dates, and times. Enable or disable the

Limited time offer, 30 usd only!!!
Discover the unparalleled capabilities of MentFX's structural rules , now optimized for MT5 ! Our state-of-the-art algorithm is engineered to commence calculations from a robust dataset spanning 1500 bars from the current position . This meticulous approach ensures unparalleled accuracy and dependability in your trading endeavors. Experience the seamless integration of MentFX with MT5 , empowering you to analyze markets with precision and confidence. With Men

仪表板扫描两个指标的读数:“MACD”和“随机指标”。在三列中显示信号:MACD、随机指标和结果列(如果两个指标的信号相同)。 可以选择在一个或多个时间范围内进行扫描。如果您禁用所有时间范围,仪表板仍会加载,但具有专门针对此类情况的设置。 始终检查指标的零柱(零柱是图表上最右边的柱)的信号。 参数说明。 “时间范围”- 选择将执行扫描的时间范围。 “MACD”和“随机指标”是指标的参数。每个时间范围的指标参数都是相同的。 “表格”- 设置表格的颜色:表格背景、表格标题颜色和表格第一列颜色。 信号描述。 对于 MACD,如果主线和信号线均低于零,且主线高于信号线,则形成上升信号。 “DOWN”信号则相反。 对于“随机”,如果该线低于“20”,则形成“向上”信号,如果该线高于“80”,则形成“向下”信号。 如果两个指标的信号相同,则该信号将显示在结果列中。如果信号不同,则不会产生信号。

The well-known ZigZag indicator that draws rays based on the "significant movement" specified by the pips parameter. If a ray appears, it will not disappear (the indicator is not redrawn), only its extremum will be updated until the opposite ray appears. You also can display text labels on each rays describing the width of the ray in bars and the length of the ray in points.
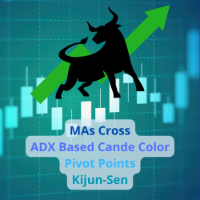
The set of most common indicators for day trading and long-term trading.
MAs Cross (Global Trend) ADX Based Candle Color (Local Trend) Pivot Points (Entry Levels) Kijun-Sen You can use this indicator in different ways, one of it is opening positions in trend direction on pivot points levels. Contact
If you have some questions or if you need help, contact me via Private Message.
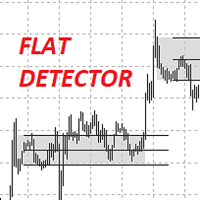
I present to you the IndFlatDetector indicator.
It belongs to the level indicators and shows the Trading Levels. This indicator combines the simplicity of intuitive settings and the accuracy of drawing levels.
Up count - the number of candlesticks up to determine the upper range
Down count - the number of candlesticks down to determine the lower range
Borders on the body or shadow - calculate the range by shadows or by body
Change the borders or not - change the boundaries of the original

The ZigZag Wave Entry Alert** indicator, created by Azad Gorgis in 2024, is designed for MetaTrader 5 and aims to provide traders with entry signals based on ZigZag patterns. Here's a brief overview of its functionality and key features:
Functionality:
- Detection of ZigZag Patterns: The indicator identifies significant price movements and outlines potential ZigZag patterns on the chart. It detects new highs and lows based on user-defined parameters such as Depth, Deviation, and Backstep. - A

This is the MT5 version of Extreme Reversal Sniper MT4 Indicator Extreme Value Sniper is a detrended price indicator Indicator finds the potential reversal levels by checking value ranges and price cycles.
***Indicator does NOT repaint so it provides accurate NO REPAINT REVERSAL SIGNALS***
MT4 Version of the Indicator: https://www.mql5.com/en/market/product/114426
It shows the overbought and oversold levels using the average range. Overbought Levels are between 4 and 10 Oversold levels are

The " Session Control " indicator is designed to display trading sessions on a price chart. This allows the trader to see at what points of activity the most important trading sessions occur: Pacific, European, American and Asian. Each of these sessions is characterized by a certain volatility and activity in the market, which is important for making trading decisions.
Peculiarities: Displaying sessions : The indicator shows time periods on the price chart corresponding to different trading se

"GoldenSwing" is a comprehensive MetaTrader 5 indicator meticulously crafted by Southern Star Trading, designed to enhance your trading strategies with precision swing high and swing low identification. Harnessing the power of swing analysis, this indicator provides traders with invaluable insights into market reversals and trend continuations, enabling them to make informed trading decisions.
With its advanced algorithm, GoldenSwing detects significant swing highs and swing lows in real-time,

The " Vertical Levels " indicator for the Forex market is a tool for displaying vertical levels on a price chart. These levels can be useful for a trader, as they help identify significant points in price movement and potential reversal or trend continuation zones.
Peculiarities:
Vertical Levels: The "Vertical Levels" indicator allows you to display vertical lines on the chart, indicating certain levels. These levels can be adjusted using input parameters. Setting options: Length : Length of

The indicator is designed to work on any trading platform. The program is based on proprietary algorithms and W.D.Ganna's mathematics, allowing you to calculate target levels of price movement based on three points with the highest degree of certainty. It is a great tool for stock trading. The indicator has three buttons: NEW - call up a triangle for calculation. DEL - delete the selected triangle. DELS - completely remove all constructions. The probability of achieving the goals is more than 80

Brief Description B4S Economic News Radar now offers enhanced features to keep traders informed and empowered. Experience comprehensive news coverage directly on your trading chart, including upcoming and past events, customizable reminders, and automatic time zone adjustments. Why News Events Matter: Market volatility triggered by economic indicators, central bank decisions, and geopolitical events can significantly impact trading outcomes. Stay ahead of these shifts with timely information and

Brief Description: A tool to display historical Open, High, Low, and Close (OHLC) price points for various time periods. Gain insights into market behavior with data from yesterday, the day before, the previous week, and the previous month. Recognize liquidity zones effectively. Features: 1. Comprehensive Timeframe Insights: Visualize crucial OHLC points for different timeframes. Historical data for yesterday, day before yesterday, previous week, and previous month. 2. Built on ICT's Teachings:

Brief Description The indicator is a powerful tool based on Inner Circle Trader's trading theory. It strategically plots lines at key prices relative to time, highlighting crucial market moments such as Tokyo Open, New York Midnight, London Open, New York Open, New York 8:30 AM, and New York Session End. The indicator is built on the foundation of Inner Circle Trader's trading theory, emphasizing the significance of key open times as liquidity and reference zones. These zones act as magnets for
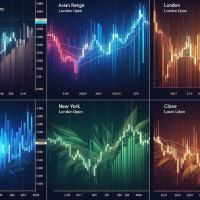
Brief Description The B4S_ICT_Killzones indicator is designed to enhance your trading strategy by highlighting key market times based on the Inner Circle Trader's (ICT) proven trading model. This indicator intelligently plots colored boxes around critical "killzone" periods, providing valuable insights into market behavior influenced by different geographical and time zone locations and time variations. Features / Indicator Settings 1. Killzone Identification Asian Range: Target the Asian tradin

Brief Description: The B4S_Institutional_Round_Number_Prices indicator identifies and marks key price levels, known as round number prices or institutional price levels, renowned for their psychological significance. These levels often influence institutional activity, attracting attention and triggering significant market moves. Features: Round Number Price Identification: The indicator excels at identifying round number prices, providing you with crucial insights into potential market moveme

Brief Description The B4S PriceLevel Watcher is a useful indicator designed to empower traders with precise price level notifications. It allows users to set customizable notifications based on specific price types, such as close, high, low, ask, bid, or either ask or bid of the current candle. Problem being solved In the ever-evolving world of trading, staying attuned to price movements is paramount. Traders need to remain vigilant, ready to act swiftly as market conditions change. However, t

Buy CTS scalping indicator, provide buying and selling signals, automatic channeling and sending signals to mobile phones
Using technical analysis and price action methods and modern methods, CTS indicator can draw price channels and recognize price trends with high accuracy and issue entry and exit signals according to them. Traders can easily fluctuate using this indicator in different time frames and in different markets. With the CTS indicator, you can signal in different ways. This indicato

The Chapon Channel indicator is a classic channel indicator that allows a trader to react when the price goes beyond the boundaries of the established channel. This channel is formed based on the analysis of several candles, starting with the last one, in order to determine the extremes in the period under consideration. These extrema are then used to construct channel lines.
Channel trading is one of the most popular strategies in the Forex market and due to its simplicity, even beginners can
Buy DEMA 3 Scalp Indicator, Signaling and Trend Finder for Forex DEMA 3 indicator is a professional indicator for finding trends as well as finding entry and exit points for a symbol. This indicator is designed based on the DEMA indicator, which can tell you the signals accurately and quickly. The DEMA 3 indicator can give you accurate and early entry points for swings. Features of the DEMA indicator 3
Receive signals as notifications on the Metatrader mobile application. Receive signals by ema
线性回归人工智能驱动指标:
线性回归是一种简单而有效的人工智能技术,是复杂神经网络的基础,该指标基于线性回归分析构建,并试图对市场即将发生的事件做出预测
输入:
train_bars:这控制了价格信息将被收集并用于训练其中的 AI 的柱数,该值越大越好,而且指标在初始化期间变得越慢,我建议值为 1000 Predict_next_bars:这决定了您希望指标接下来预测的蜡烛数量,默认情况下该值设置为 10。因为该指标尝试预测接下来 10 个蜡烛的上涨位置。 如果指标预测高于当前价格,则意味着指标预测市场将看涨,否则将看跌 include_ precision:设置为 true 时,指标会计算之前在预测过程中所犯的错误,并将这些错误的平均值包含在新的预测中,以使指标更加准确 在右下角,指示器显示有关训练和测试准确性、精度误差和平均/平均误差的有价值的信息。 在使用指标之前,请确保训练和测试准确度均为 0.6 至 0.9 范围内的良好值,分别代表 60% 至 90% 的准确度。如果指标没有为特定交易品种提供良好的准确度值,则该指标 可能不适合这样的符号。
该指标最适合所有交易品种

The best quality application of the famous Super Trend indicator that requires no introduction. It is completely faithful to the original algorithm and powered by the CCI indicator.
- easy to trade - It implements all kinds of warnings. - It implements a multi-timezone dashboard. - It cannot be repainted or backpainted.
Input parameters - ATR Period – This is the average true range period. - ATR Multiplier - The ATR multiplier that defines the trend. - CCI - Makes trend following powerful. - M
About:
Introducing the "Median Proximity Percentile" developed by AlgoAlpha, a sophisticated trading indicator engineered to augment market analysis. This tool adeptly monitors the proximity of median prices over a designated historical period and delineates its percentile position amidst dynamically evolving standard deviation bands. It furnishes traders with invaluable insights essential for well-informed decision-making.
Features: Color-Coded Visuals: Facilitate intuitive comprehension of
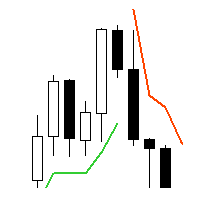
Supertrend - невероятно мощный и универсальный индикатор, предназначенный для помощи трейдерам в определении текущего тренда на конкретном торговом инструменте. С помощью двух встроенных индикаторов, Average True Range и Standard Deviation, трейдеры могут выбрать наиболее подходящий индикатор для своей стратегии торговли. Пользователи также могут настроить период этих индикаторов и выбрать цену (Close, High, Low, Open, Weighted), к которой он должен быть применен, с Typical price в качестве опци

Heikin Ashi Heikin Ashi is a charting technique that can be used to predict future price movements. It is similar to traditional candlestick charts. However, unlike a regular candlestick chart, the Heikin Ashi chart attempts to filter out some of the market noise by smoothing out strong price swings to better identify trend movements in the market.
To create Heiken Ashi, a formula is used in which price data is entered, while ordinary candles are built only on bare numbers, without using any c

An invention that will turn your working principles upside down.
Especially in horizontal and stagnant markets, annoying losses can occur.
Besides, following trend lines, support and resistance can be tiring.
To put an end to all this, I decided to create a professional "moving average" indicator.
All you have to do is follow the colors.
If you need additional support, I recommend the "Heiken-Ashi" candle indicator in my profile.
I wish you lots of profit..

The RSI Advanced tool will help traders capture trends and optimal entry points by:
- Enter a Buy order when the green line crosses the yellow line. Provided that the yellow line is near line 32 or 20 - Enter a Sell order when the green line crosses the yellow line. Provided that the yellow line is near line 68 or 80
Additionally, you can combine it with the convergence divergence that occurs at the green line.
**When you purchase the Mastering the RSI MT4 or Mastering the RSI MT5 indicator,

Description: Dimatis Watchtower is a powerful backtesting tool designed for traders seeking for an efficient way to test and optimize their trading strategies on the MetaTrader 5 platform. With a minimalist interface and advanced features, this tool provides an outstanding solution for evaluating the performance of your strategies in various market conditions. Key Features: Backtesting: Perform precise and reliable backtests of your strategies using historical data from your broker directly on M

StartPoint是一个很好的短线交易指示器,这个指标可以单独使用,但是最好是配合 HighQualityMap 一起使用,适用于任何时间框架,喜欢超短线的朋友可以使用M5时间框架。它能很好的体现出短期趋势的启动点,你可以很快的从这个指示器上寻找到最佳的buy和sell位置,同时也能很好根据指示器去坚守自己的持仓定订单。指标不含有未来函数,不会重新绘制,不仅能够应用到自己的手动交易过程中,还能完全可以写入到自己的EA中。(如果你感觉到这个指标能够帮助你进行更准确的交易,请帮忙给个好评,希望我的作品能够帮助更多有需要的人) ===================参数列表===================== 所有参数均采用默认参数即可,无需更改,若为激进型交易者,可以根据自己的需要来调整参数。 =================参考使用方法=================== 此指标可以适用于任何交易品种。

Source Trend Indicator: A Powerful Tool for Market Analysis!
Advantages: Trend Detection: The Source Trend indicator will help you immediately identify the direction of price movement and understand the interaction between buyers and sellers. Versatility: Works on all time frames and with any currency pairs, providing flexibility and adaptation to different market conditions. Accurate Signals: Provides reliable signals in both trending and flat markets, helping you make informed decisions. Com

PricePulse Pro - Indicator of Simple Solutions! Using this indicator is very easy - just follow the colored arrows on the chart. The indicator algorithm takes into account daily price fluctuations and focuses on measuring the "candlestick" share in the trend.
This indicator uses an algorithm that considers price changes based on various parameters such as H/C (high price/close), H/O (high price/open), LC (low price/close), LO (low price/open). This allows for a more detailed analysis of price

Supertrend is a trend following indicator based on the Average True Range (ATR) . Calculating the odd line combines trend detection and volatility. It can be used to detect changes in trend direction and position stops.
Basic knowledge Supertrend is a trend following indicator. It takes up space on the main chart and its plots show the current trend. A Supertrend can be used for varying durations (daily, weekly, intraday, etc.) and varying instruments (stocks, futures or forex). Supertr
Introducing the Reversal and Breakout Signals
This innovative tool is crafted to enhance your chart analysis by identifying potential reversal and breakout opportunities directly on your charts. It's designed with both novice and experienced traders in mind, providing intuitive visual cues for better decision-making. Let's dive into the key features and how it operates:
### Key Features:
Dynamic Period Settings: Customize the sensitivity of the indicator with user-def

The PriceActionOracle indicator greatly simplifies your trading decision-making process by providing accurate signals about market reversals. It is based on a built-in algorithm that not only recognizes possible reversals, but also confirms them at support and resistance levels. This indicator embodies the concept of market cyclicality in a form of technical analysis.
PriceActionOracle tracks the market trend with a high degree of reliability, ignoring short-term fluctuations and noise around

Vanguard's Volatility indicator is based on the analysis of long and short price volatility. It helps to determine market entry points by displaying favorable entry points with arrows. This indicator can be used as a filter in trading or as a tool to show the exact direction of the trend. It is suitable for both scalping on small time intervals and long-term trading. It is important to remember that successful trading requires a comprehensive approach, and additional information is needed to en

The Pivot Point Pioneer indicator is based on unique indicators capable of detecting extreme points. It is ideal for identifying reversals or sharp price movements in one direction. Thanks to this indicator, you will be informed about upcoming events: a blue dot will appear for a buy signal, and a red dot for a sell signal.
This technical indicator allows you to assess the current state of the market and make a decision about entering a trend movement with minimal risk. It uses a process of an

Certainly! Let’s discuss the RSI Rush , an aggressive momentum indicator that combines weighted moving averages (WMAs) at lows, mid-price, and tight highs. Here are the key components: Weighted Moving Averages (WMAs) : The RSI Rush employs three WMAs: WMA at Lows : Calculated based on the lowest prices during a specific period. WMA at Mid-Price : Considers the average price (midway between highs and lows) during the same period. WMA at Tight Highs : Based on the highest prices during the speci
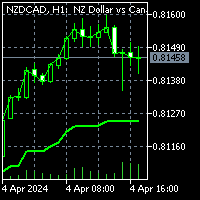
To get access to MT4 version please click here . This is the exact conversion from TradingView: "G-Channel Trend Detection" by "jaggedsoft". This is a light-load processing and non-repaint indicator. You can message in private chat for further changes you need. All input options are available. Buffers are available for processing within EAs. Highlight option is omitted as does not show good in Metatrader.

Breakouts with strong momentum are challenging to catch. The purpose of the Super Breakouts Monitor is to identify such market conditions. This indicator is inspired by a concept from renowned Technical Analyst Tushar Chande, who combines two highly adaptive indicators, VIDYA and the Dynamic Momentum Index (both his creations), to capture the early stages of a successful breakout. At Minions Labs, we've added our unique enhancements to adapt these great ideas for modern markets like stocks, cryp

移动平均线扫描仪是一款多时间范围扫描仪,非常适合在不更改图表的情况下一目了然地查看多个时间范围内的趋势。 它最多可以在 9 个时间单位内使用您选择的 4 条移动平均线。 它是完全可配置的,只需“拖放”即可将其移动到图表上的任何位置。 移动平均线可以配置为 4 种不同的计算方法。 您还可以根据移动平均数和周期数设置警报。
MT4版本在这里。
输入参数: 筛选器布局: 允许您调整图表上显示的扫描仪的所需大小以及显示文本的大小。 移动平均线: 您可以配置 4 个不同的移动平均周期和 4 种计算方法:简单/指数/平滑和线性加权。 警报 : 要设置警报,您所要做的就是选择所需的时间范围数量(看涨/看跌)以及选择触发警报的移动平均线。 可通过弹出/推送通知和邮件发出警报。 警报文本是完全可定制的。
SPARTACUS 2024
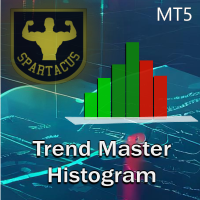
Trend Chart Histogram is an indicator based on an algorithm using two moving averages and several oscillators. Thanks to its color code, it allows you to quickly identify the trend and take advantage of the biggest market impulses. Light colors indicate the trend, dark colors define impulses and gray indicates that you should not enter the market. It will be a very good ally in your decision-making, combined with your other indicators.
MT4 version here.
Input parameters: - Period 1 (fast perio

介绍NakaSide - 您的终极市场机会指标!
您是否厌倦了错过盈利的交易机会?您是否准备将交易提升到新的水平?不用再找了,因为NakaSide已经出现,将彻底改变您的交易方式!
NakaSide不仅仅是又一个普通的指标;它是您在复杂的金融市场中自信而准确导航的秘密武器。凭借其先进的算法和尖端技术,NakaSide旨在检测趋势变化,并在看涨和看跌市场中发现有利可图的机会。
当NakaSide检测到向上趋势转变时,它会以鲜艳的绿色美元符号发出信号,表明可能的购买机会。相反,如果趋势反转,将出现引人注目的红色美元符号,表明可能的卖出机会。
但这就是NakaSide真正脱颖而出的地方:它不仅仅停留在识别趋势上。在侧向市场中,其他人可能会遇到困难的地方,NakaSide表现得最出色,将多个美元符号散布在整个图表上,表明了多个潜在的入场点。这意味着您有更多的机会利用市场波动,无论是上升、下降还是横盘趋势!
但这还不是全部-NakaSide还允许您通过手动输入订单来灵活控制您的交易。无论您是执行买入还是卖出订单,只需按照指示-绿色表示买入,红色表示卖出-并抓住进入市场的时机。
重要

这是一个判断趋势的指标,是一个关于利用布林带,并通过指数化的方法,从而利用颜色来判断现在的趋势是顺势还是逆势,而且也利用中间颜色蓝色来判断即将转势的可能性。 并且,根据上轨,上轨EMA,中轨,中轨EMA,下轨,下轨EMA, 一共6条轨道来判断,价格是否处于适当范围里。
用法1: 判断趋势 A: 当上中下轨道通道都出现绿色,证明价格向上可能性大。 B: 当上中下轨道通道都出现红色,证明价格向下可能性大。 C: 当三轨道通道的颜色不一致时,有可能会有其他的变数。
用法2:关键点位 A:当价格超出上轨,证明价格偏向上。 B: 当价格超出下轨,证明价格偏向下。
另外, 配合不同的周期,例如:日线级别, 4小时级别, 利用这些级别的颜色来判断大趋势, 再利用低级别的周期的关键点位来进行下单。 还有一点就是参数 周期,系统默认的是20,个人觉得最佳的参数是144. 这是个人建议。

Higher Timeframe Chart Overlay will display higher timeframe candles, including the number of candles high/low you specify.
You no longer need to switch timeframes to check the candles. Everything can be shown in one chart. MT4 Version : https://www.mql5.com/en/market/product/115680 Almost everything can be change as you want. You can change/set:
- Choose different colors for the body and top/bottom wicks.
- Panel's height and width.
- The width of the body and wicks
- Change background an

Tired of information overload when analyzing forex currency strength? Introducing "All Currency Strength Live", the ultimate dashboard indicator for MetaTrader 5 that simplifies your trading life. This innovative tool provides a clear, concise overview of the strength of all major currencies, empowering you to make informed trading decisions with ease. With "All Currency Strength Live," you gain access to real-time insights into both price and volume strength across all major currencies. No mor

BS Time Band是一个很好的波段交易指示器,这个指标可以单独使用,但是最好是配合 StartPoint 一起使用效果更好,适用于任何时间框架,非常适合喜欢做波段交易的朋友。它能很好的体现出一个波段的完整信息,你可以很快的从这个指示器上寻找到最佳的预警区域,然后配合 StartPoint 找到最佳的buy位置和最佳的sell位置,也能很好根据指示器去坚守自己的持仓定订单。指标不含有未来函数,不会重新绘制,不仅能够应用到自己的手动交易过程中,还能完全可以写入到自己的EA中。(如果你感觉到这个指标能够帮助你进行更准确的交易,请帮忙给个好评,希望我的作品能够帮助更多有需要的人) =================参考使用方法=================== 此指标可以适用于任何交易品种。 做波段建议参数 timeFame:M5 如果配合 StartPoint 建议 StartPoint 的参数为(240,60)

Ultra-fast recognition of parabolic channels (as well as linear, horizontal and wavy channels) throughout the depth of history, creating a hierarchy of channels. Required setting: Max bars in chart: Unlimited This indicator is designed primarily for algorithmic trading, but can also be used for manual trading. This indicator will have a very active evolution in the near future and detailed descriptions on how to apply to create robots
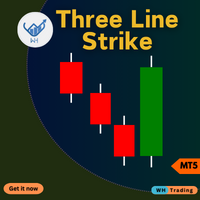
MetaTrader 5 (MT5) 的 ThreeLine Strike 指标 。此高级工具旨在帮助您精准轻松地识别市场中的潜在逆转。
无论您是初学者还是经验丰富的交易者,该指标都可以增强您的交易决策并最大化您的利润。 Contact me after purchase for guidance 主要特征: 准确的反转信号 :根据三线打击模式(技术分析中经过验证的蜡烛图形态)检测潜在的趋势反转。 可自定义的设置 :使用可调节的参数(例如,执行模式、时间范围和视觉偏好)来定制适合您的交易风格的指标。 实时警报 :当三线打击模式形成时立即收到通知,这样您就不会错过重要的市场机会。 用户友好界面 :直观的设计可以轻松解释信号并将其集成到您的交易策略中。 兼容性 :与您现有的 MT5 设置无缝集成,获得顺畅、高效的交易体验。 为何选择三线走势指标? 提高您的交易绩效 :通过可靠、及时的反转信号增强您的决策能力。 节省时间和精力 :自动化您的分析并专注于执行有利可图的交易。 适合所有交易者 :无论您是日内交易者、波段交易者还是长期投资者,该指标都适合您的交易风格。 立即试用三线走势指标,让您

I'm excited to introduce you to the fifth bar on Martin Armstrong's Forecast Array - The Trading Cycle .
This innovative tool represents a transverse form of cyclical frequency analysis, offering a unique perspective on market trends.
The model employs a color-coded system for easy interpretation. In this model, green signals the ideal timing for highs, red indicates ideal lows, and yellow signifies a convergence of highs and lows occurring simultaneously. This intuitive approach allows us

Subscribe to the MA7 Trading channel to receive notifications about new programs, updates and other information. Ask questions in the profile on the MQL5 .
Description of work The MA7 Clover indicator is based on candle shapes. Shows the "Pin Bar" candle pattern. Detailed information about the MA7 Clover indicator.
Indicator settings General settings: Min body size ; Max body size ; Min nose size ; Max nose size ; Minimum pattern size ; Maximum pattern size ; Analysis of the candle direction

To download MT4 version please click here .
- This is the exact conversion from TradingView: " PA-Adaptive Hull Parabolic " By "Loxx".
- This is a non-repaint and light processing load indicator
- You can message in private chat for further changes you need.
- All input options are available.
- Buffers are available for processing within EAs.
- Highlight option is omitted as does not show good in Metatrader.

这个 DYJ PowerSignalSource 是基于ATR技术指标的完整交易系统。该指标将分析并记录从M5-MN中每个周期和当前货币对趋势强度 DYJ PowerSignalSource 通过评估这些数据来创建一个趋势强度和入口点信号列表显示。当趋势百分比达大于等于75%时认为是强货币,如果趋势强度百分比达到100时候是最强,则一个警告会弹出来指示这种情况。 该指标可以独立使用判断大趋势信号,并在适当价格进场和离场,并且指标配备了发送信号策略,使用 跟单软件DYJ GameDevice 实现自动开仓关仓。您也能使用震荡类型信号源(例如 DYJ WPR 指示器)接收这些趋势信号,辅助震荡指标的精确入场和离场! Input
InpUseLanguage = English InpPowerSignalMinPercent = 100 // InpPowerSignalMinPercent:Min InpPowerSignalMaxPercent = 100

获取下一个反转走势信号 | 优化收益率统计 | 获取价格将测试的区域 | 非重绘、非延迟指标 - 手动和自动交易的理想选择 - 适用于所有资产和所有时间单位 推出时为 69 美元 --然后恢复到 >> 149 美元 购买后, 请联系我的频道 获取推荐设置 МТ4 - МТ5 版本 | 查看我们的 global MetaMethod ,以更轻松、更快速和更安全地最大化利润
剥了头皮就跑!
有了BladeSCALPER,你将在那些更可预测的M&W走势中分得一杯羹
只要把它插在你最喜欢的资产上,抓住那几个点,然后从人群中跑开。
为了什么?
你将发现的最可预测的模式是 "双顶 "和 "双底",通常被称为 "M "和 "W",因为这个字母明确表示了这些运动。
BladeSCALPER是一个新思路的集合,使其剥头皮更容易、更简单。
有了ScalpUP/ScalpDOWN信号--你就会得到下一个可能的移动信号 使用PowerZONE - 立即获得价格可能走向的区域 使用RewardBOX - 根据PowerZO
立即获得触及 3、4 或 5 次的战略区域,使价格磁化 | 根据强力区自动获得点数或价值的 TP1/TP2/TP3 | 直观检查您的风险/回报比是否安全 限时优惠 - 然后恢复到 $99 购买后 | 请联系我的频道 获取推荐设置 MT5 - MT4 版本 | 查看我们的三步MetaMethod,最大化您的利润: 1. TrendDECODER 2. PowerZONES 3. BladeSCALPER 想要获取多日信号图表? >> 订阅我们的 mql5 频道。
为什么更好?
我们在基本的支撑位和阻力位概念上进行了创新,增加了新的功能: 区域: 与线型相比,更符合现实交易情况 强度: 我们提供了一个简单的选项,显示支撑位/阻力位在过去被触及的次数 区域密度: 即两个区域之间的距离;密度越高,区域越多 区域颜色的变化取决于其位置与价格的关系: 如果价格低于区域,则 区域颜色变为 红色;如果价格高于区域,则 区域颜色变 为蓝色。 PowerZONES 将改变您的交易习惯,帮助您避免冲动交易。
我们的指标首次在图表上
您想在外汇市场取得成功吗? 我们创新的 AI Swing Trading 指标是您交易成功并盈利的秘密钥匙。 我们向您展示这个独特的工具:
我们的指标配备了内置神经网络,可让您分析大量数据、识别变化并预测价格走势。 该技术使您能够根据深入的市场分析做出明智的交易决策。 该指标算法基于:斐波那契水平、价格行为和交易量。 这使您可以根据数学模式确定潜在的进入点和市场进入点。 应在 M30 时间范围内对 EURUSD 货币对使用 AI 波段交易! AI Swing Trading 指标不会停滞不前。 在工作过程中,不断优化自身,适应不断变化的市场情况。 这意味着即使市场发生变化,您也将始终领先一步。
AI Swing Trading 不仅分析当前走势,还分析外汇市场的全球趋势。 这使您可以了解发生了什么并做出明智的决定。
该指标是从2009年开始的多年交易经验的成果。它是由交易者为交易者开发的,考虑到了外汇交易的各个方面。
不用担心错误信号。 AI Swing Trading 不会重绘,这意味着您看到的信号保持不变,您可以依靠它们做出已知的交易决策。
我们的指标的设计
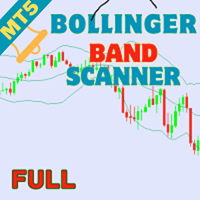
The Bollinger Bands Multicurrency Scanner Dashboard MT5 is a versatile tool for monitoring trading signals across multiple currency pairs and timeframes using Bollinger Bands. It organizes signals in an intuitive grid format, displaying each symbol’s status across timeframes from M1 to MN1. Traders can enable or disable specific timeframes to suit their strategies. You can find the MT4 version here Bollinger Band Scanner Full For detailed documentation click here Bollinger Bands Strategies: Th
RSI Pro 分析器指标是一款功能强大的工具,专为希望在多个时间范围内同时做出明智决策的交易者而设计。 该指标利用 RSI 提供超买、超卖和趋势信号,更容易识别入市机会。 它的主要优点是易于阅读, 因为它具有清晰而独特的颜色代码来指示不同的市场状况。
该指标显示五个不同时间范围(D、H4、H1、M30、M15) 的 RSI 值和相关信号,使交易者能够获得全面的市场视角并在多个时间范围内做出明智的决策。
使用颜色变化来识别不同时间范围内的趋势和潜在逆转。 寻找超买和超卖区域,以发现反趋势或趋势逆转的交易机会。
红色: RSI 指示下降趋势。
绿色 :RSI 指示上升趋势。
深红色 :RSI 表示超卖区域。
深绿色 :RSI 发出超买区域信号。
您还可以通过弹出、电子邮件和推送通知发送的精确警报来通知购买和销售条目。
RSI Pro 分析器指标是交易者决策过程中的补充工具。 建议将其与其他指标和分析结合使用,以了解市场概况。
MT4版本。
输入参数:
RSI period: 14(默认),可根据您的喜好调整。
Enable/disable alert: 启用或禁

Introducing the 'No Nonsense Reversal Megaprofits' indicator for MetaTrader 5 (MT5), your ultimate tool for identifying trend reversals with precision and confidence. This powerful indicator is designed to cut through the noise of the markets and pinpoint crucial turning points with ease. Powered by advanced algorithms, 'No Nonsense Reversal Megaprofits' analyzes price action and key market dynamics to accurately detect when a trend is about to reverse. Whether you're a novice trader or a season
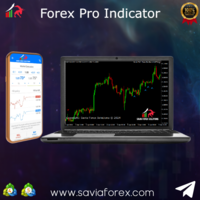
Savia Forex Pro Indicator (MT5) The Savia Forex Solutions Forex Pro Indicator gives you highly accurate entries on all Forex/Currency pairs, Indices and Cryptocurrencies. The Forex Pro Indicator is dynamic and powerful and is optimized for all timeframes and ALL Currency pairs, Indices, Commodities, and Cryptocurrency pairs. Trade with improved confidence and maximize your success rate. Benefits Dynamic and Powerful. Forex Pro Indicator is fully optimized for all chart timeframes. Forex Pro Indi

Boom and Crash Pro Indicator The Savia Forex Solutions Boom and Crash Pro Indicator gives you highly accurate entries on all Boom and Crash Indices. The Boom and Crash Pro Indicator is dynamic and powerful and is optimized for all timeframes. Trade with improved confidence and maximize your success rate. Benefits Dynamic and Powerful. Boom and Crash Pro Indicator is fully optimized for all chart timeframes. Whether price action is an uptrend, downtrend or trading sideways, Boom and Crash Pro Ind
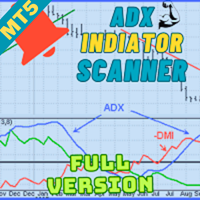
The ADX Multicurrency Scanner Dashboard MT5 is a powerful tool designed for traders who want to monitor multiple currency pairs and timeframes simultaneously using the Average Directional Index (ADX). It simplifies the process of tracking market trends, identifying confluence signals, and receiving real-time alerts, making it an indispensable asset for ADX-based trading strategies. You can find the MT5 version here ADX Multicurrency Scanner MT5 For detailed documentation click here
Multicur
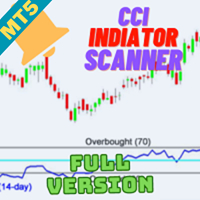
The CCI Multicurrency Scanner Dashboard MT5 is a robust trading tool that monitors signals across multiple currency pairs and timeframes using the Commodity Channel Index (CCI). It provides a streamlined grid interface that organizes signals by symbols and timeframes, ranging from M1 to MN1. Users can enable or disable specific timeframes to focus on their preferred strategies. You can find the MT4 version here CCI Multicurrency Scanner MT4 For detailed documentation click here CCI Indica

DYJ StochasticSignalSource随机振荡指标 显示为两条线。主线称为%K线。第二条线,称为%D线,是%K的移动平均线。 %K线通常显示为实线而%D线显示为虚线。有很多方法来解释随机振荡指标。其中有4种方法比较常用: 随机振荡指标(或%K或%D)降到特定水平以下(例如,20),可以买入。当随机振荡指标上升到特定水平以上(例如,80),需要卖出。 在线内区域交叉:K、D线在20以下时,%K线升到%D线以上买入。K、D线在80以上时,%K线降到%D线以下卖出。 只要交叉:%K线升到%D线以上买入。%K线降到%D线以下卖出
随机振荡指标(或%K或%D)升到特定水平以上(例如,20),可以买入。当随机振荡指标下降到特定水平以上(例如,80),需要卖出。 您能使用 DYJ Mathematical model trader 指标交易分析模型,显示指标真实交易开仓和关仓以及计算总体利润和最大浮动亏损! 此外, DYJ StochasticSignalSource随机振荡指标 还在入场点和出场点标记了彩色箭头,并且还根据这些位置实时统计总利润和最大浮亏2项判断交易概率的重要数据
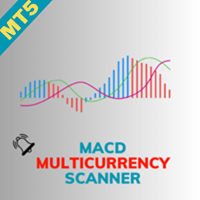
The MACD Multicurrency Scanner Dashboard MT5 is a comprehensive tool for tracking signals across multiple currency pairs and timeframes using the Moving Average Convergence Divergence (MACD) indicator. It organizes signals in a grid format, displaying each symbol's status across timeframes from M1 to MN1. Traders can enable or disable specific timeframes to focus on their strategies. You can find the MT4 version here MACD Multicurrency Scanner MT4 For detailed documentation click here MACD Int
Volatility Index Pro Indicator The Savia Forex Solutions Volatility Index Pro Indicator gives you highly accurate entries on all Volatility Indices and Jump Indices. The Volatility Index Pro Indicator is dynamic and powerful and is optimized for all timeframes. Trade with improved confidence and maximize your success rate. Benefits Dynamic and Powerful. Volatility Index Pro Indicator is fully optimized for all chart timeframes. Volatility Index Pro Indicator works with Volatility Indices and Jum
您知道为什么MetaTrader市场是出售交易策略和技术指标的最佳场所吗?不需要广告或软件保护,没有支付的麻烦。一切都在MetaTrader市场提供。
您错过了交易机会:
- 免费交易应用程序
- 8,000+信号可供复制
- 探索金融市场的经济新闻
注册
登录