适用于MetaTrader 5的技术指标 - 63
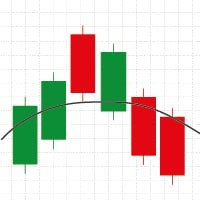
Wilder's Moving Average (Wilder's MA) is a smoothing technique developed by J. Welles Wilder, designed to reduce the impact of short-term price fluctuations and highlight longer-term trends. Unlike the standard Exponential Moving Average (EMA), Wilder's MA uses a unique smoothing factor, which gives it a slower and more stable response to changes in price. The calculation method emphasizes a more gradual adaptation to market changes, making it particularly useful in volatile markets. It helps tr

Silver Bullet Indicator - Optimize Your Market Analysis with the ICT Strategy Our Silver Bullet indicator is designed to help you conduct clearer and more effective analysis based on ICT's popular Silver Bullet Strategy. With advanced tools and customizable features, this indicator enhances your ability to identify trading opportunities. Key Features: Information Panel: Provides key data for your market analysis: DOL (Daily Objective Level): The target price for the session, where you should foc
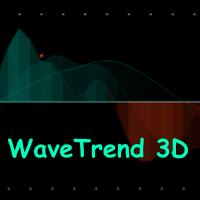
WaveTrend 3D is the mql version of this oscillator (By jdehorty and LazyBear). WaveTrend 3D (WT3D) is a novel implementation of the famous WaveTrend (WT) indicator and has been completely redesigned from the ground up to address some of the inherent shortcomings associated with the traditional WT algorithm.
WaveTrend 3D is an alternative implementation of WaveTrend that directly addresses some of the known shortcomings of the indicator, including its unbounded extremes, susceptibility to whip

*纳斯达克100“黄金指标”介绍!*
你是否在寻找一款强大的工具来提升你在纳斯达克100中的交易成功率?不必再犹豫!我们独家推出的指标经过两年对纳斯达克100走势的深入研究和分析,精心开发而成。
这个先进的移动平均线指标利用黄金分割、斐波那契水平和江恩角度,准确定位价格与移动平均线的交叉点。
*为什么选择这个指标?*
- *简单设置:* 只需下载并运行,无需复杂配置! - *最佳性能:* 最适用于1分钟和5分钟的时间框架,同时在所有时间框架中均表现出色。 - *趋势强度检测:* 当一根强势蜡烛越过移动平均线时进入交易(确保蜡烛实体80%以上位于平均线之上)。
*“魔法策略”的一部分!* 该指标是纳斯达克100“魔法策略”的三大重要工具之一。它提供早期的交易入场信号,为了最大化收益,使用另外两个指标(在产品描述中提到)至关重要。
*超值优惠!* 目前该指标的价格远低于其实际价值。立即获取它,迈出通往财务成功的重要一步! Note : As you know, the demo version of any indicator or expert advi

Bu kod, MetaTrader 5 platformu için özel bir gösterge oluşturur. Gösterge, ZigZag, Hareketli Ortalama (MA) ve Göreceli Güç Endeksi'nin (RSI) bir kombinasyonunu kullanarak güçlü alım ve satım sinyalleri üretir. İşte kodun ayrıntılı bir açıklaması:
İndikatör Tanımı ve Özellikleri: - Gösterge, grafik penceresinde görüntülenir. - 5 gösterge arabelleği ve 3 çizim kullanır. - ZigZag, alış sinyalleri ve satış sinyalleri için ayrı grafikler tanımlanır.
Giriş Parametreleri: - ZigZag, MA ve RSI için

The Relative Gap Index (RGI) is a powerful new tool designed for traders looking to identify market momentum and potential trend reversals with ease. Developed by Avydel Talbo, the RGI offers a fresh perspective on price action, making it an essential addition to your trading toolkit. Key Features: User-Friendly Scale : The RGI operates on a -100 to 100 scale, allowing you to quickly assess market conditions. Instant Color Signals : Green Line : Indicates bullish momentum when the RGI is above z
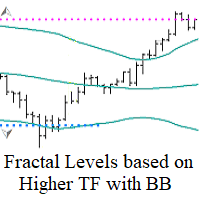
Fractal Levels based on Higher TF with BB Filter — 此工具旨在基于通过布林带(Bollinger Bands)指标过滤的高级别时间框架的分形构建精确的支撑和阻力水平。它为您提供购买和出售信号,并带有便捷的提醒功能。 原理工作:
该指标分析通过布林带指标过滤的高级别时间框架的分形水平,并在您的当前图表上显示它们。您可以在指标设置中轻松调整高级别时间框架,以获得最大精度并与您的策略相匹配。 使用 Fractal Levels based on Higher TF with BB Filter 的优势: 过滤虚假信号:
仅当分形超出布林带外侧时(波动性突破),水平才会形成。通过调整布林带参数,您可以控制指标对买卖信号的敏感度。 早期信号检测:
通过在较低时间框架上查看较高级别时间框架的分形水平,您可以在最早阶段识别潜在的买卖信号。 改善盈亏比:
在较低时间框架上早期进入允许您设置更短的止损,从而显著提高交易效率。 便捷的提醒:
永远不会错过重要的信号——即时收到有关入场和出场机会的通知。 提高分析准确性:
专注于真正重
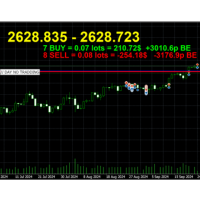
Breakeven Line v2 Indicator is a MetaTrader indicator that calculates breakeven level based on all open positions and displays it on your chart as a horizontal line. Additionally, it will calculate the total number trades, the total number of lots, and the distance to the breakeven line in points and profit/loss. The indicator is available for both MT5. Why use Breakeven Line Indicator? When you have multiple trades opened on a single symbol, it can be difficult to tell where your average ent

Premium Automatic Fibonacci Indicator Your Dynamic Edge in Trading Elevate your trading strategy with our cutting-edge Premium Automatic Fibonacci Indicator. This powerful tool combines the timeless wisdom of Fibonacci retracements with advanced dynamic features, giving you unparalleled insight into market trends and potential reversal points. Key Features: Dynamic to Static Conversion: Seamlessly switch between dynamic and static Fibonacci levels with a single click. Adapt to changing market c

This LogReturnsIndicator.mq5 calculates and displays the logarithmic returns ("log returns") of the closing prices of a financial asset.
It computes the log-returns for each period using the formula:
log return=ln(close[i]close[i−1])
This measures the relative variation between consecutive closing prices in logarithmic terms, a method often used in finance to analyze the returns of financial assets.
Benefits of Log Returns:
Logarithmic returns are preferred in certain financial

This MQL5 indicator, named "Change Of State-(Poisson Law).mq5", is designed to identify significant change points in price movements using a model based on the Poisson distribution. Here’s a summary of how it works:
Purpose of the Indicator
The indicator aims to mark significant change points on the price chart by using arrows to indicate when price variation exceeds a threshold defined by the Poisson distribution.
Chart Display
The points where price variations exceed the Poisson thresh

This algorithm is a custom indicator for MetaTrader 5 (MT5) that plots two simple moving averages (SMA) on a financial chart to assist in the technical analysis of price movements. Here's what the algorithm does: Two Simple Moving Averages (SMA) : The indicator uses two different SMA periods: The first SMA (SMA1) has a longer period, set to 8 periods by default (SMA 8). The second SMA (SMA2) has a shorter period, set to 3 periods by default (SMA 3). Calculation of the Moving Averages : For each
Ultimate Forex Trading Indicator Elevate your trading with our multi-functional indicator packed with advanced features! Key Features: 1. Non-repainting indicator for accurate signals 2. Max activations for peace of mind 3. 7+ strategies integrated for diverse trading styles 4. 10 Indicators all in one for comprehensive analysis 5. Perfect for Day and Swing Trading strategies 6. Trend following, reversal, and scalping strategies built-in 7. Create your own Custom strategies 8. Prop firm ready
FREE

Highest High and Lowest Low (HH_LL) Indicator Description: The HH_LL Indicator is a trading tool designed to help traders identify key market points by automatically drawing Higher High (HH) and Lower Low (LL) lines across multiple timeframes. This indicator allows traders to easily spot significant levels on the chart, facilitating more accurate trading decisions. Key Features: Multi-Timeframe Analysis: The indicator supports various timeframes, including M30, H1, and H4. This enables traders
FREE
MetaTrader市场提供了一个方便,安全的购买MetaTrader平台应用程序的场所。直接从您的程序端免费下载EA交易和指标的试用版在测试策略中进行测试。
在不同模式下测试应用程序来监视性能和为您想要使用MQL5.community支付系统的产品进行付款。
您错过了交易机会:
- 免费交易应用程序
- 8,000+信号可供复制
- 探索金融市场的经济新闻
注册
登录