MetaTrader 5용 기술 지표 - 63
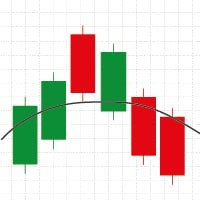
Wilder's Moving Average (Wilder's MA) is a smoothing technique developed by J. Welles Wilder, designed to reduce the impact of short-term price fluctuations and highlight longer-term trends. Unlike the standard Exponential Moving Average (EMA), Wilder's MA uses a unique smoothing factor, which gives it a slower and more stable response to changes in price. The calculation method emphasizes a more gradual adaptation to market changes, making it particularly useful in volatile markets. It helps tr

Silver Bullet Indicator - Optimize Your Market Analysis with the ICT Strategy Our Silver Bullet indicator is designed to help you conduct clearer and more effective analysis based on ICT's popular Silver Bullet Strategy. With advanced tools and customizable features, this indicator enhances your ability to identify trading opportunities. Key Features: Information Panel: Provides key data for your market analysis: DOL (Daily Objective Level): The target price for the session, where you should foc
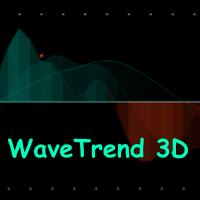
WaveTrend 3D is the mql version of this oscillator (By jdehorty and LazyBear). WaveTrend 3D (WT3D) is a novel implementation of the famous WaveTrend (WT) indicator and has been completely redesigned from the ground up to address some of the inherent shortcomings associated with the traditional WT algorithm.
WaveTrend 3D is an alternative implementation of WaveTrend that directly addresses some of the known shortcomings of the indicator, including its unbounded extremes, susceptibility to whip
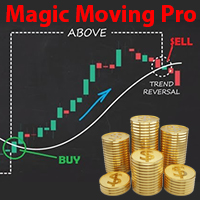
*NASDAQ 100을 위한 골든 지표 소개!*
NASDAQ 100에서 거래 성공을 향상시킬 강력한 도구를 찾고 계신가요? 더 이상 찾지 마세요! 저희의 독점 지표는 NASDAQ 100의 움직임에 대한 2년간의 광범위한 연구와 분석 끝에 세심하게 개발되었습니다.
이 고급 이동 평균 지표는 황금비율 원리, 피보나치 수준, 간 각도를 활용하여 가격과 이동 평균 간의 가장 정확한 교차 지점을 찾아냅니다.
*왜 이 지표를 선택해야 할까요?*
- *간편한 설정:* 다운로드하고 실행하기만 하면 됩니다. 복잡한 설정이 필요 없습니다! - *최적의 성능:* 1분 및 5분 타임 프레임에서 가장 효과적이며, 다른 모든 타임 프레임에서도 우수한 성과를 제공합니다. - *추세 강도 감지:* 강력한 캔들스틱이 이동 평균을 교차할 때 거래에 진입하세요. (캔들 몸체의 80% 이상이 이동 평균 위에 있어야 합니다.)
*매직 전략의 일부!* 이 지표는 NASDAQ 100에서 매직 전략을

Bu kod, MetaTrader 5 platformu için özel bir gösterge oluşturur. Gösterge, ZigZag, Hareketli Ortalama (MA) ve Göreceli Güç Endeksi'nin (RSI) bir kombinasyonunu kullanarak güçlü alım ve satım sinyalleri üretir. İşte kodun ayrıntılı bir açıklaması:
İndikatör Tanımı ve Özellikleri: - Gösterge, grafik penceresinde görüntülenir. - 5 gösterge arabelleği ve 3 çizim kullanır. - ZigZag, alış sinyalleri ve satış sinyalleri için ayrı grafikler tanımlanır.
Giriş Parametreleri: - ZigZag, MA ve RSI için

The Relative Gap Index (RGI) is a powerful new tool designed for traders looking to identify market momentum and potential trend reversals with ease. Developed by Avydel Talbo, the RGI offers a fresh perspective on price action, making it an essential addition to your trading toolkit. Key Features: User-Friendly Scale : The RGI operates on a -100 to 100 scale, allowing you to quickly assess market conditions. Instant Color Signals : Green Line : Indicates bullish momentum when the RGI is above z
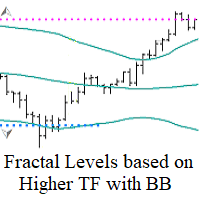
Fractal Levels based on Higher TF with BB Filter — 이 도구는 Bollinger Bands 지표로 필터링된 상위 타임프레임의 프랙탈을 기반으로 정확한 지지 및 저항 레벨을 구축하도록 설계되었습니다. 매수 및 매도 신호를 제공하며 편리한 알림 기능을 갖추고 있습니다. 작동 원리:
이 지표는 Bollinger Bands 지표로 필터링된 상위 타임프레임의 프랙탈 레벨을 분석하여 현재 차트에 표시합니다. 지표 설정에서 상위 타임프레임을 쉽게 조정하여 최대의 정확성을 얻고 전략과 일치시킬 수 있습니다. Fractal Levels based on Higher TF with BB Filter 사용의 장점: 거짓 신호 필터링:
프랙탈이 Bollinger Bands의 외부 밴드 밖에 있을 때만 레벨이 형성됩니다(변동성 돌파). Bollinger Bands의 매개변수를 조정하여 매수 및 매도 신호에 대한 지표의 민감도를 조절할 수 있습니다. 초기 신호 감
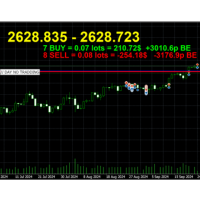
Breakeven Line v2 Indicator is a MetaTrader indicator that calculates breakeven level based on all open positions and displays it on your chart as a horizontal line. Additionally, it will calculate the total number trades, the total number of lots, and the distance to the breakeven line in points and profit/loss. The indicator is available for both MT5. Why use Breakeven Line Indicator? When you have multiple trades opened on a single symbol, it can be difficult to tell where your average ent

Premium Automatic Fibonacci Indicator Your Dynamic Edge in Trading Elevate your trading strategy with our cutting-edge Premium Automatic Fibonacci Indicator. This powerful tool combines the timeless wisdom of Fibonacci retracements with advanced dynamic features, giving you unparalleled insight into market trends and potential reversal points. Key Features: Dynamic to Static Conversion: Seamlessly switch between dynamic and static Fibonacci levels with a single click. Adapt to changing market c

This LogReturnsIndicator.mq5 calculates and displays the logarithmic returns ("log returns") of the closing prices of a financial asset.
It computes the log-returns for each period using the formula:
log return=ln(close[i]close[i−1])
This measures the relative variation between consecutive closing prices in logarithmic terms, a method often used in finance to analyze the returns of financial assets.
Benefits of Log Returns:
Logarithmic returns are preferred in certain financial

This MQL5 indicator, named "Change Of State-(Poisson Law).mq5", is designed to identify significant change points in price movements using a model based on the Poisson distribution. Here’s a summary of how it works:
Purpose of the Indicator
The indicator aims to mark significant change points on the price chart by using arrows to indicate when price variation exceeds a threshold defined by the Poisson distribution.
Chart Display
The points where price variations exceed the Poisson thresh

This algorithm is a custom indicator for MetaTrader 5 (MT5) that plots two simple moving averages (SMA) on a financial chart to assist in the technical analysis of price movements. Here's what the algorithm does: Two Simple Moving Averages (SMA) : The indicator uses two different SMA periods: The first SMA (SMA1) has a longer period, set to 8 periods by default (SMA 8). The second SMA (SMA2) has a shorter period, set to 3 periods by default (SMA 3). Calculation of the Moving Averages : For each
Ultimate Forex Trading Indicator Elevate your trading with our multi-functional indicator packed with advanced features! Key Features: 1. Non-repainting indicator for accurate signals 2. Max activations for peace of mind 3. 7+ strategies integrated for diverse trading styles 4. 10 Indicators all in one for comprehensive analysis 5. Perfect for Day and Swing Trading strategies 6. Trend following, reversal, and scalping strategies built-in 7. Create your own Custom strategies 8. Prop firm ready
FREE
트레이딩 전략과 기술 지표를 판매하기에 가장 좋은 장소가 왜 MetaTrader 마켓인지 알고 계십니까? 광고나 소프트웨어 보호가 필요 없고, 지불 문제도 없습니다. 모든 것이 MetaTrader 마켓에서 제공됩니다.
트레이딩 기회를 놓치고 있어요:
- 무료 트레이딩 앱
- 복사용 8,000 이상의 시그널
- 금융 시장 개척을 위한 경제 뉴스
등록
로그인
계정이 없으시면, 가입하십시오
MQL5.com 웹사이트에 로그인을 하기 위해 쿠키를 허용하십시오.
브라우저에서 필요한 설정을 활성화하시지 않으면, 로그인할 수 없습니다.