适用于MetaTrader 5的技术指标 - 62
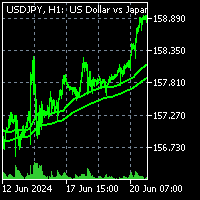
To get access to MT4 version please click here . This is the exact conversion from TradingView: "Liquidity Weighted Moving Averages" by "AlgoAlpha ". This is a light-load processing and non-repaint indicator. All input options are available expect time frame input . Buffers are available for processing in EAs. You can message in private chat for further information/changes you need. Thanks for downloading

TK - Rainbow 指标 描述: TK - Rainbow 指标是一个强大的技术分析工具,旨在通过多条线的方式提供市场趋势的清晰视图。通过30条计算不同周期的线,它提供了广泛的价格运动分析。该指标使用双色方案来突出显示上升和下降趋势,使市场状况一目了然。 主要特点: 30条线: 每条线代表不同的平滑周期,以涵盖广泛的市场趋势。 双色方案: 使用两种颜色区分上升(冷色)和下降(暖色)趋势。 可定制设置: 调整线宽、样式和步长以适应您的交易偏好。 如何使用 TK - Rainbow: 应用指标: 从 MetaTrader 5 的指标列表中将 TK - Rainbow 指标添加到您的图表中。 配置参数: 步长 (inpStep): 定义每条线之间的周期增量。调整此设置以设置线条间距。 价格 (inpPrice): 选择用于计算的价格类型(例如,收盘、开盘、最高、最低)。 线宽 (inpLinesWidth): 设置线条的厚度以提高清晰度。 线样式 (inpLinesStyle): 选择线条的样式(例如,实线、虚线)。 解读颜色: 上升趋势: 冷色(蓝色)的线条表示上升趋势。 下降趋势:

MACD ADX Oscillator for MT5 Elevate your trading strategy with the MACD ADX Oscillator – a powerful indicator that combines the best of the Moving Average Convergence Divergence (MACD) and the Average Directional Index (ADX) to provide unparalleled insights into market momentum and trend strength. Key Features: Dual Momentum Analysis : This indicator merges MACD's ability to detect changes in market momentum with ADX's strength measurement, giving you a comprehensive view of the market's directi
Welcome to Tomas Lekim's Cube theory. The Theory is based on the calculation of the largest pattern existing in nature. A pattern that contains all other patterns and sequences. All patterns such as prime numbers, Fibonacci and other number sequences are contained in the universal mesh of my theory. It is possible to perceive the price pattern and the meeting between the two opposing forces that exist in the entire logic of negotiation and competition. .Games in which a team competes with anothe

Ekom Spike Detector Pro
Take your trading to the next level with the Ekom Boom and Crash Spike Detector Indicator Pro, designed for serious traders who demand more. This advanced version provides: Key Features: - Accurate Spike Detection: Identify high-probability spike patterns in real-time using price action - Clear Visual Signals: Displays clear buy and sell arrows on the chart for easy decision-making - Customizable: easily change arrows and line colors and also select wether Boom or

1. What is this Due to the limitation of MT5 software, we can only see the minimum 1-minute candlestick chart. Sometimes this is not enough for high-frequency traders, or we want to see a more detailed candlestick chart. This tool allows you to see: A candlestick chart composed of N ticks, which allows you to better understand the price fluctuations. For example, each candle line has 20 ticks, or 70 ticks.
2. Parameters: NTick = 70; // The tick cnt for one candle BandsPeriod = 20;

1. What is this Due to the limitation of MT5 software, we can only see the minimum 1-minute candlestick chart. Sometimes this is not enough for high-frequency traders, or we want to see a more detailed candlestick chart. This tool allows you to see: A candlestick chart composed of N seconds, which allows you to better understand the price fluctuations. For example, each candle line has 20 seconds, or 30 seconds.
2. Parameters: SecondCandle = 20; // The second cnt for one candle, Need
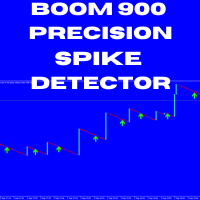
Boom 900 Precision Spike Detector The Boom 900 Precision Spike Detector is a powerful tool designed to help traders accurately identify spike opportunities in the Boom 900 market. With advanced features and precise alerts, this indicator takes the guesswork out of trading, enabling you to maximize your profits with confidence. Key Features: Non-Repainting Signals: Get reliable signals without repainting, ensuring your trading decisions are based on accurate, real-time data. Audible Alerts: Stay
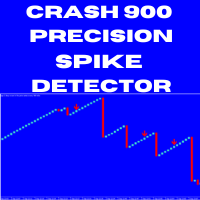
Crash 900 Precision Spike Detector The Crash 900 Precision Spike Detector is your ultimate tool for trading the Crash 900 market with precision and confidence. Equipped with advanced features, this indicator helps you identify potential sell opportunities and reversals, making it an essential tool for traders aiming to capture spikes with minimal effort. Key Features: Non-Repainting Signals: Accurate, non-repainting signals that you can trust for reliable trading decisions. Audible Alerts: Stay
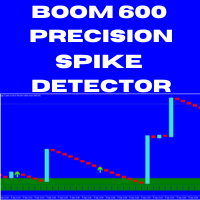
Boom 600 Precision Spike Detector The Boom 600 Precision Spike Detector is your ultimate tool for trading the Boom 600 market with precision and confidence. Equipped with advanced features, this indicator helps you identify potential buy opportunities and reversals, making it an essential tool for traders aiming to capture spikes with minimal effort. Key Features: Non-Repainting Signals: Accurate, non-repainting signals that you can trust for reliable trading decisions. Audible Alerts: Stay on t
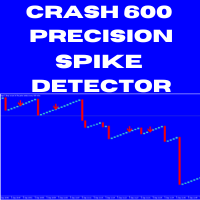
Crash 600 Precision Spike Detector The Crash 600 Precision Spike Detector is an essential tool designed to help traders navigate the Crash 600 market with accuracy and efficiency. Packed with advanced features, this indicator provides precise alerts that allow traders to capture spikes and reversals with confidence. Key Features: Non-Repainting Signals: Dependable, non-repainting signals that ensure your trading decisions are based on real-time, accurate data. Audible Alerts: Receive sound notif

In the context of trading, Malaysia SNR (Support and Resistance) refers to the technical analysis of support and resistance levels in financial markets, particularly for stocks, indices, or other assets traded. This is single timeframe version. Multiple timeframe version is avaiable here . There are three type of Malaysia SNR level Classic , GAP and Flipped 1. Classic Support is the price level at which an asset tends to stop falling and may start to rebound. It acts as a "floor" where demand is
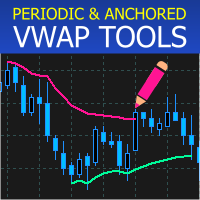
VWAP Tools features Daily VWAP , Weekly VWAP , Monthly VWAP , Anchored VWAP , VWAP by session and Drawing Panel to add, remove and change properties of multiple anchored VWAPs in a single indicator. With the panel of VWAP Tools you can: Draw VWAPs with a specific time interval or extend the VWAPs to the current bar time Change the properties of each VWAP individually Select a VWAP by clicking over it Delesect a VWAP by clicking anywhere on the chart Use any VWAP already drawn on the chart to dra
FREE
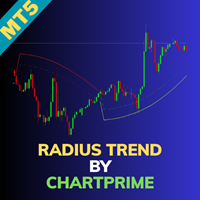
Radius Trend by ChartPrime Overview: The Radius Trend indicator is an advanced technical analysis tool designed to visualize market trends through an adaptive, radius-based method. With dynamic bands that react to price action and volatility, it offers traders a unique insight into trend strength, direction, and potential reversals. Unlike traditional trend lines, this indicator adjusts dynamically like a radius sweeping across the chart, creating a fluid approach to trend analysis. Key Features
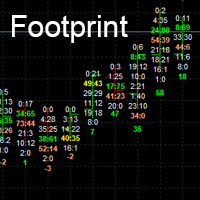
Footprint charts can add a level of depth to your visuals that standard charts cannot achieve.
Footprint charts are a powerful way to visualize the ups and downs of the market, helping you potentially to make better trading decisions. Orderflow Footprint in MT5. show # of market orders at each tick.
Inputs
Point Scale *1 to *10000
Number of candle to show. Font Size Max Bid Color (Top Seller) Max Ask Color (Top Buyer) Max Bid and Ask Color
Normal color

This indicator is one of our first brilliant programs, the indicator is quite useful and seems to give the best results when combined with price action, and a combination of oscillators , mainly the Bollinger bands and the moving average , you can also use this on all time frames but be careful on the lower time-frames as the trend is not too steady or rather moves fast, this will help you have better entries.

This is one of our best products available on the market, it will work with every pair you can think of, this ea works together hand in hand with the trend and support and resistance strategy , it will work with all the timeframes and all oscillators , this will amaze you on how best it works and makes trading a whole lot easier you can use this with the rsi oscillator for best results.
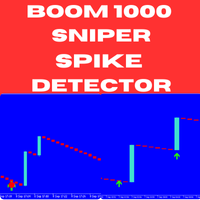
Boom and Crash Sniper Spike Detector - Boom 1000 The Boom and Crash Sniper Spike Detector is the ultimate tool for spike trading on Boom 1000, offering clear and reliable signals to help you capture high-probability trades. This advanced indicator is designed to enhance your trading strategy by simplifying spike detection and maximizing your profits. Key Features: Multi-Timeframe Compatibility : The indicator can be used on M1, M5, M15, M30, and H1 timeframes, but it works best on the M1 timefra
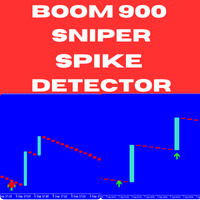
Boom and Crash Sniper Spike Detector - Boom 900 Unlock the potential of spike trading on Boom 900 with the Boom and Crash Sniper Spike Detector. This cutting-edge indicator provides precise and clear signals, helping you identify high-probability trades and capture spikes effortlessly. Designed for traders who want to enhance their trading performance, this tool simplifies the process of detecting spike opportunities. Key Features: Multi-Timeframe Compatibility : The indicator works across multi

CustomRSI50 Alert and Mail at Cross 指标 CustomRSI50 Alert and Mail at Cross 指标 描述 CustomRSI50 Alert and Mail at Cross 是一个基于流行的相对强弱指数 (RSI) 的高级技术指标,旨在简化自动交易,当 RSI 水平跨越 50 个阈值时,通过警报和电子邮件提供即时通知。该指标提供了 RSI 的清晰和可定制的可视化,特别强调了许多交易者在动量分析中至关重要的 50 个关键水平。 主要特点 在 50 水平交叉时发送警报和电子邮件通知 可配置的 RSI 周期 突出显示 50 个参考水平 可定制的应用价格类型 在单独的窗口中显示 固定的 0 到 100 的刻度,易于解释 可定制参数 RSI_Period: 允许设置 RSI 计算的周期(默认:14) applied_price: 允许选择用于计算的价格类型(默认:收盘价) EnableAlert: 启用或禁用声音警报 EnableEmail: 启用或禁用发送电子邮件通知 LookBackCandles: 考虑交叉的蜡烛数量(默认:5)

Chandelier Exit for MT5 The Chandelier Exit indicator is designed to dynamically set stop-loss levels based on market volatility, measured through the Average True Range (ATR). It helps traders secure positions during trend changes by using price extremes and dynamic stop-losses for both long and short positions. Key Features: ATR-Based Stops : The indicator calculates stop-loss levels for long and short positions using a moving average of the True Range (ATR), adapting to market volatility chan

Heiken Ashi CE Filtered – Premium Buy/Sell Indicator with Advanced Filtering Introducing the "Heiken Ashi CE Filtered" – a high-quality custom indicator designed for traders seeking precision and clarity in their trading signals. This premium indicator combines the smooth visual simplicity of Heiken Ashi candles with the power of an ATR-based chandelier exit strategy and a zero-lag LSMA filter for highly reliable buy and sell signals. Key Features: Reliable Buy/Sell Signals: The indicator genera
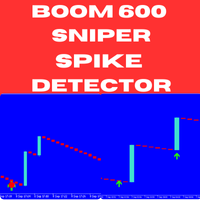
Boom 600 Sniper Spike Detector - MQL5 Listing Description Introducing the Boom 600 Sniper Spike Detector – a cutting-edge, non-repainting indicator designed to help you effectively capitalize on spikes in the Boom 600 market. Ideal for both seasoned traders and beginners, this indicator offers precise, actionable signals to enhance your trading strategy and maximize your profit potential. Key Features: Non-Repainting Signals : Guarantees reliable and consistent signals that do not repaint, provi
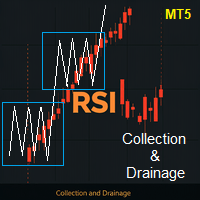
高级 RSI 调整: 该指标对 RSI 进行了修改,使其类似于紧密的锯齿形运动,从而形成类似于积累和分配区域的区域,直到发生突破。 可定制的移动平均线: 该指标包括四条可定制的移动平均线(10、30、50 和 200),这些线可以通过设置界面轻松调整。移动平均线有助于交易者更好地分析趋势并理解市场变化。 直线蓝色和红色线条: 趋势和动量线条: 当直线蓝色线条伴随着上升的蓝色阶梯图案时,通常表示上升趋势,同时考虑到积累和分配的运动以及移动平均值。而直线红色线条则在伴随着下降的红色阶梯图案时表示下降趋势,也考虑到其他积累和分配运动及移动平均值。 结合移动平均线分析 RSI 运动: 有时 RSI 运动可能会形成积累和分配区域,这可能表明市场正在为新一轮上涨或下跌做准备。结合移动平均线的信号,这一观察可以帮助识别潜在的市场反转。 反转、积累和分配: 需要注意的是,这些线条可能预示着市场即将反转,尤其是在市场处于积累或分配阶段时。将 RSI 运动与移动平均线结合使用可以提供有关趋势变化或反转的强烈信号。 回撤、积累和分配: 必须意识到,积累和分配运动以及蓝色和红色线条通常类似于启动新市场波动之
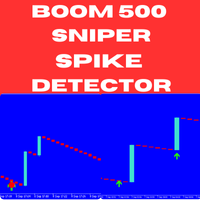
Introducing the Boom 500 Sniper Spike Detector – an advanced, non-repainting indicator specifically crafted to help you capture spikes in the Boom 500 market with precision. Whether you are an experienced trader or just starting, this indicator provides reliable signals that simplify spike trading, making it an essential addition to your trading arsenal. Key Features: Non-Repainting Signals : The Boom 500 Sniper Spike Detector generates highly reliable signals that do not repaint, allowing you t
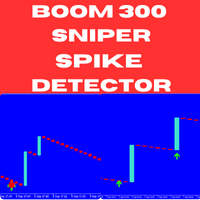
Introducing the Boom 300 Sniper Spike Detector – a powerful, non-repainting indicator specifically engineered to help you master spike trading in the Boom 300 market. Whether you're a seasoned trader or new to the game, this tool offers precise and timely signals, allowing you to catch spikes with confidence and improve your overall trading performance. Key Features: Non-Repainting Signals : Ensures consistent and accurate signals that do not repaint, providing you with reliable data to make con
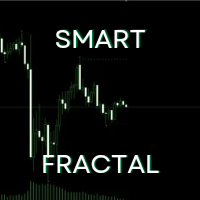
Smart Fractals 指标 - 一个强化的 Fractal 用于您的 MT5 交易 Smart Fractals 是您熟悉并在图表中使用的经典 Fractal 指标的进化版。专为 MetaTrader 5 设计,此指标不仅仅是识别市场的经典反转点,它更进一步,使您的交易更加高效和盈利。我们采用了基本的 Fractal 概念,并将其转变为更智能、更功能化的工具。 主要特点: 买入和卖出信号:除了传统的 Fractal 指标外,Smart Fractals 包含明确的买入和卖出信号,这些信号通过图表上的黄色和紫色箭头可视化展示。这些信号使您更有信心进入交易。 改善的可视化:每个 Fractal 都以清晰直观的方式显示,通过可定制的颜色区分 "向上" 和 "向下" Fractal。此外,市场结构突破 (BOS) 实时显示,以确认方向的有效性。 可定制的颜色和风格:您可以通过各种颜色和样式选项将指标调整为符合您的视觉偏好。正如图片中所示,指标可配置,使图表分析更加清晰和快速。 多功能性和精确性:可在任何时间框架和所有主要资产(外汇、指数、加密货币等)上使用,为您提供精确和更新的信号。

The Super Trend Extended Indicator is a powerful tool designed to assist traders in identifying market trends and making informed trading decisions. It combines a robust trend-following algorithm with advanced filtering options to provide precise entry and exit signals. Key Features: Trend Identification : The indicator effectively highlights the current market trend, whether bullish or bearish, helping traders stay on the right side of the market. Customizable Parameters : Users can adjust sens
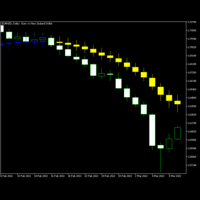
Moving Average Candlesticks MetaTrader indicator — is a chart visualization of a standard moving average using the candlestick bars. It draws the candlesticks based on the moving average values calculated for Close, Open, Low, and High. It allows seeing a compact snapshot of the more detailed market information compared with the classic MA indicator. It works with any currency pair, timeframe, and MA mode. The indicator is available for MT4 and MT5. Input parameters MAPeriod (default = 10

Certainly. Here's the explanation in English: This program is a custom indicator that calculates the MACD (Moving Average Convergence Divergence) and shows the crossovers between the MACD and Signal lines. Here are the main functions of the program: MACD Calculation: Calculates the difference between the Fast EMA (Exponential Moving Average) and Slow EMA. This difference forms the MACD line. Signal Line Calculation: Creates the Signal line by taking a simple moving average (SMA) of the MACD valu

RSI Condition:
The Relative Strength Index (RSI) for the current period is below a specified low threshold (RsiLow). This indicates oversold conditions. Candlestick Pattern:
It checks for a specific candlestick pattern across three consecutive candles: The current candle (1) closes higher than it opens (bullish) The previous candle (2) closes lower than it opens (bearish) The current candle's close is below the high of the previous candle Price Action:
The alert also checks that the curre
FREE
MetaTrader市场提供了一个方便,安全的购买MetaTrader平台应用程序的场所。直接从您的程序端免费下载EA交易和指标的试用版在测试策略中进行测试。
在不同模式下测试应用程序来监视性能和为您想要使用MQL5.community支付系统的产品进行付款。
您错过了交易机会:
- 免费交易应用程序
- 8,000+信号可供复制
- 探索金融市场的经济新闻
注册
登录