Conheça o Mercado MQL5 no YouTube, assista aos vídeos tutoriais
Como comprar um robô de negociação ou indicador?
Execute seu EA na
hospedagem virtual
hospedagem virtual
Teste indicadores/robôs de negociação antes de comprá-los
Quer ganhar dinheiro no Mercado?
Como apresentar um produto para o consumidor final?
Indicadores Técnicos para MetaTrader 5 - 62

If you like this project, leave a 5 star review.
Follow on TikTok: @quantum.trader
[ Any Symbol Can Be ADDED ] DM me for adding any Pair symbol, crypto, index, stock or anything related. you can also DM me in TikTok [@quantum.trader] Works on [ EURUSD-GBPUSD-GBPJPY-USDJPY-XAUUSD-US30-BTCUSD-ETHUSD-SOLUSD ]
This indicator calculate and draw the Prediction or Forecast the peaks of the current day ( forecast high - forecast low - forecast middle - forecast upper q - forecast lower
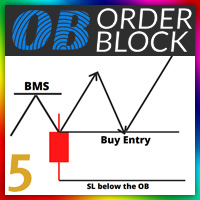
Orde Block Detector: The order block detector can automatically identify the breakthrough of the market structure. After the trend framework breaks through, the order block area can be drawn automatically. In order to draw the OB area more accurately, we also automatically find the candle on the left and right sides of the original candle according to its trading principle, and draw a more accurate ob area through more subtle quantitative rule judgment. Futures : 1. Customize the BMS color, a

RTS5Pattern AVG RTS5Pattern AVG is a revolutionary statistical indicator designed for the MetaTrader 5 platform, bringing an innovative approach to technical analysis and market movement prediction. This indicator combines advanced mathematical methods, including normalization and historical data analysis, with a user-friendly interface and precise trading capabilities. RTS5Pattern AVG is an ideal tool for traders looking to improve their trading strategies and achieve better results. Key Featur

The MS High Low Lines indicator is a tool designed to enhance trend visualization for MT5. It displays high and low prices as lines, using your preferred Moving Average (MA) settings (either SMA or EMA, with customizable periods). The indicator shows configured signals when prices break above or below these MAs. By setting it up with highly functional MAs, traders can better understand market trends and make trades with a statistical edge. You can modify settings and place multiple indicators o

Here is a version for MetaTrader 5 of the famous Wave Trend indicator. Introducing the Wave Trend Oscillator Indicator for MT5 We are excited to present our Wave Trend Oscillator Indicator, exclusively designed for MetaTrader 5. This advanced tool is a must-have for traders who seek precision and efficiency in their trading journey. Our oscillator is built on the principles of wave trend analysis, capturing the ebb and flow of market trends with unparalleled accuracy. It helps traders identify p
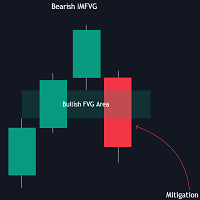
The FVG Instantaneous Mitigation Signals indicator detects and highlights "instantaneously" mitigated fair value gaps (FVG), that is FVGs that get mitigated one bar after their creation, returning signals upon mitigation.
Take profit/stop loss areas, as well as a trailing stop loss are also included to complement the signals.
USAGE Figure 1 Instantaneous Fair Value Gap mitigation is a new concept introduced in this script and refers to the event of price mitigating a fair value gap

Easy Fibonacci é um indicador para MT5 que permite traçar facilmente retrações de Fibonacci. Características Até 10 níveis de Fibonacci podem ser definidos nas configurações do indicador. Cada nível pode ter estilo de linha diferente, cor da linha, largura da linha e outras configurações personalizáveis. Você pode usar um mouse com botões extras para mapear as teclas V e B e traçar Fibonacci convenientemente. Ações dos Botões: B e V: Traçar Fibonacci superior/inferior na área visível do gráfico.

Indicador Financeiro SolarTrade Suite: Indicador do Mercado Terrestre - O seu Guia de Confiança no Mundo dos Mercados Financeiros!
Este é um substituto para os castiçais japoneses cinzentos padrão, que utilizam algoritmos especiais inovadores e avançados para calcular o seu valor e também têm um design agradável à vista.
É muito simples compreender as leituras deste indicador: azul - compra, vermelho - venda. Quanto mais brilhante for a cor, mais forte será o sinal.
Veja os nossos outros
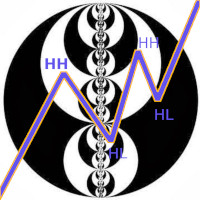
O indicador da estrutura do mercado no timeframe atual encontra:
1. Tendência (ondas ascendentes e descendentes). A mudança de direção da onda ocorre após uma interrupção do Extremo (retirada da liquidez do lado oposto). A renderização da tendência ocorre levando em conta as barras externas (em uma barra externa pode haver 2 extremos). A tendência pode ser desenhada tendo em conta o número mínimo de barras na onda (2 ou mais). Configurável pelo parâmetro QTY_bars_for_wave
2. BoS-quebra de e

The indicator displays the total number of ticks during the formation of a single bar. It can be used to analyze market activity in financial trading. Peaks and troughs of the indicator effectively highlight potential reversal points in price movements. This tool is particularly useful for traders seeking to identify periods of high volatility, allowing them to make informed decisions based on tick volume patterns. By observing changes in tick frequency, traders can gain insights into market se
Introducing the Gold Market Arrow Indicator, specifically designed for the 15-minute chart. This advanced tool provides clear and actionable buy and sell arrows, enabling traders to make timely and informed decisions in the gold market. Whether you're a seasoned trader or a novice, our indicator simplifies complex market data into straightforward signals, ensuring you never miss an opportunity to capitalize on gold price movements." This indicator works with a custom build in strategy The indic

Indicador Financeiro SolarTrade Suite: Indicador de Mercado Urano - O seu Guia de Confiança no Mundo dos Mercados Financeiros!
São duas médias móveis que utilizam algoritmos especiais inovadores e avançados para calcular o seu valor, e têm também um design agradável.
É muito fácil compreender as leituras deste indicador: azul - compra, vermelho - venda.
Quanto mais brilhante for a cor, mais forte será o sinal.
Veja os nossos outros produtos da série SolarTrade Suite na parte inferior da

Indicador Financeiro SolarTrade Suite: Neptune Market Indicator - O seu guia de confiança no mundo dos mercados financeiros!
Existem seis médias móveis que utilizam algoritmos especiais inovadores e avançados para calcular o seu valor e têm também um design agradável.
É muito fácil compreender as leituras deste indicador: azul - compra, vermelho - venda.
Quanto mais brilhante for a cor, mais forte será o sinal.
Veja os nossos outros produtos da série SolarTrade Suite na parte inferior d

Para download gratuito, junte-se ao nosso grupo. Oferta por tempo limitado ! Visão Geral: Identifique as moedas mais fortes de relance com o Currency Strength Chart para MetaTrader 5. Este poderoso indicador fornece uma representação visual clara da força relativa das principais moedas nos últimos 30 dias, permitindo que você tome decisões comerciais mais informadas. Principais Características: Análise Comparativa de 30 Dias: Compare a força de cada moeda principal ao longo de um período de 30 d
A simple indicator for plotting a tick chart.
This indicator will allow you to track the spread dynamics and the price behavior in general.
In the settings, you can select the price to display on the chart - Bid, Ask or both prices at the same time.
Tick Chart Indicator will definitely be useful when using scalping strategies. The MT4 version is available here . Good luck to everyone and successful trading!

Para um download gratuito, junte-se ao nosso grupo. Oferta por tempo limitado! Apresentamos nosso inovador indicador MQL5, projetado para melhorar sua experiência de negociação fornecendo sinais visuais claros dos limites das velas diárias em timeframes menores. Esta ferramenta é perfeita para traders que desejam se manter informados sobre o progresso da vela diária, garantindo uma melhor tomada de decisões e execução de estratégias. Principais características Visualização da Caixa de Vela Diári
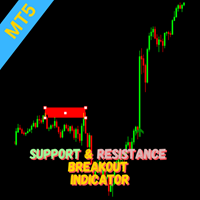
Indicator Overview This indicator utilizes the Zigzag indicator to identify potential support and resistance levels. When the price action breaks through one of these levels, a trading signal is generated. How it Works The Zigzag indicator is employed to pinpoint significant price highs and lows, forming potential support and resistance areas. A signal is triggered when the current candle closes beyond a previously established support or resistance level. Traders can consider entering a position

Breakthrough signal indicator for the MT5 platform: Your reliable assistant in the world of trading!
We are pleased to present you with an innovative signal indicator, which was created in collaboration with an outstanding mathematician. This indicator combines advanced algorithms and the best of the world of mathematical analysis, providing traders with a unique tool for predicting market movements.
Why is this indicator unique?
1 .Entry signals without redrawing If a signal appears, it
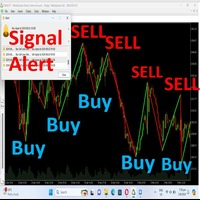
Hello Traders, *-For your bonus one indicator with SL,TP zone* just give your review, comment.Once finish developing I will give you**** Trend identification Indicator This is a indicator that will identify trend zone as bearish and bullish zone . This indicator can use for all pairs and any timeframe you can use it . *Green lime mean buy.Red line mean sell.You will receive alert sound when signal generate. The create best on high, low point and moving average calculation. You can customize valu
The VSA Scanner Dashboard is a multi-symbol, multi-timeframe scanner that displays VSA signals. It is based on the Volume Plus and VSA Signals indicator. Features Displays the VSA signal of the last closed candle. Monitors 28 customizable instruments (symbols) and up to 21 timeframes at the same time. Easily arrange symbols in any order. Each signal has a tooltip that displays the name and time of appearance. Click on each signal to open a new chart. All types of alerts (sound, pop-up, email,
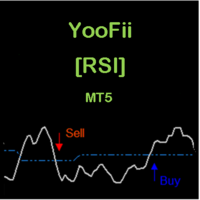
CONSTITUICAO YooFii [RSI] é um indicador constituído por um oscilador e um nível dinâmico. Através dos inputs pode-se ajustar o oscilador, o nível dinâmico e os sinais de alertas. Ele é projectado somente para a plataforma MT5. APLICACAO Este indicador, deve ser usado com um filtro de tendência [por exemplo duas medias moveis, MA 200 e MA 55] [veja os screen shots para mais detalhes]. quando o oscilador cruza o nivel dinâmico de baixo para cima, temos BULLISH move. quando o oscilador cruza o niv

Adjustable Consecutive Fractals looks for 2 or more fractals in one direction and sends out a on screen alert, sound alert and push notification, for strong reversal points .
Adjustable Consecutive Fractals, shows the fractals on chart along with a color changing text for buy and sell signals when one or more fractals appear on one side of price.
Adjustable Consecutive Fractals is based Bill Williams Fractals . The standard Bill Williams fractals are set at a non adjustable 5 bars, BUT withe
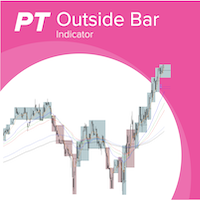
Outside bars (Außenstäbe) are important in professional price action trading and were made popular by Michael Voigt. Highs and lows of outside bars ( Aussenstäbe ) can be utilized as entry and exit for trades following different strategies. With combining different timeframes you can more easily detect the overall trend of the market, see potential resistance and support levels and also detect change in trend and framing of the market. Examples for strategies with inside bars (Innenstäbe) an

This MQL5 Speed Indicator script calculates the average speed of price movements for a selected financial instrument over a specified period. It uses the arithmetic mean to determine the average speed, which is computed by dividing the distance (change in price) by the time interval. The indicator then displays this value as a histogram in a separate window. Average Speed Calculation : The speed is calculated using the formula v = d t v = \frac{d}{t} v = t d , where d d d is the price differen
The "Order Block Indicator for MetaTrader 5" is an advanced trading tool designed to help traders identify key order block zones in the financial markets. Order blocks are areas of institutional buying and selling, often marking significant price levels where market reversals or continuations are likely to occur. This indicator provides a visual representation of these zones directly on the chart, enabling traders to make more informed trading decisions. Key Features: Accurate Order Block Identi

Session Box Indicator for MetaTrader 5
Description: The SessionBox indicator is designed to visually represent the trading sessions on a chart, specifically the Asian, European, and American sessions. This indicator draws customizable rectangles around each session, allowing traders to easily identify different trading periods. It also includes labels to denote each session, enhancing clarity.
Users only need to input the session start and end hours in their server time. Please note, the As
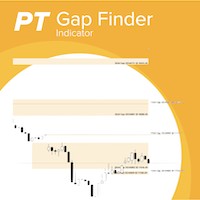
With the gaps finder indicator gaps between trading session are automatically added to you chart and you will never miss a gap which you can use in your trading strategies. Gaps often act as a magnet where the markets returns to or when a gap is closed often constitutes a reversal point.You don't have to draw manually gaps anymore. Key Features: Support for multiple trading sessions in a single chart, e.g market session and future session Configurable number of days to look back for gaps Highly
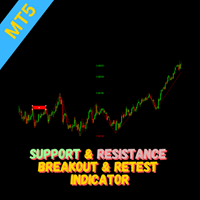
Overview The Breakout and Retest indicator is designed to identify potential trading opportunities by detecting price breakouts from significant support and resistance levels followed by a retest of the broken level. How it Works The indicator analyzes price data to determine key support and resistance areas. When the price decisively breaks through one of these levels and then retest it, then a potential breakout is signaled when it breakout again. To increase the probability of a successful t

In the world of trading, the key to success lies in having the right tools at the right time. Our innovative Volume Profile indicator was developed with one goal in mind: to provide traders with unprecedented access to vital market activity information. This cutting-edge tool allows you to not only see where and when volumes are traded but also to understand market depth with clarity never seen before. Main Features: Temporal Flexibility: Set the analysis range up to 1800 minutes to perfectly ma

Limited Time Offer!
Take advantage of our 19% discount in celebration of our panel upgrade, now including Bias (1D, 4H, 1W). Buy now and boost your market analysis! Introducing the Smart Money Concepts (SMC) and Inner Circle Trader (ICT) Indicator , an advanced tool designed for professional traders seeking precision in their decisions. This indicator directly integrates the fundamental principles of SMC/ICT into your charts, providing clear and reliable visual signals to help you identify ke

Maximize Your Trading Opportunities with the "Auto Trendlines" Indicator Discover the "Auto Trendlines" Indicator: "Auto Trendlines" is the essential tool for every technical trader. This indicator automatically plots trend lines, pinpointing support and resistance levels with surgical precision. It's ideal for those looking to capitalize on market breakouts and reversals. Key Features: Automatic Trendline Plotting: Identifies and draws crucial trend lines without manual intervention. Advanced C

Optimize Your Trading Decisions with the "autoFibo" Indicator Discover the "autoFibo" Indicator: "autoFibo" is the essential analysis tool for traders who want to fully leverage Fibonacci levels without the hassle of manual plotting. This indicator automates the Fibonacci retracement process, providing instant visual access to key support and resistance zones. Key Features: Automatic Fibonacci Retracement: Automatically plots Fibonacci levels, making it easy to identify support and resistance zo
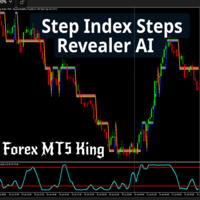
Unlock precision in your trading with the Step Index Steps Revealer AI . This advanced MT5 indicator is your ultimate tool for identifying key price levels on major forex pairs, including GBP/USD, EUR/USD, and others, as well as the step index
Key Features 1. Accurate Price Level Identification Plots precise key levels on major forex pairs like GBP/USD, EUR/USD, USD/JPY, and more. Ideal for traders looking to capitalize on bounce backs and breakouts with accuracy. 2. Optimized for Step Index C

Enhance Your Trading Performance with the "Better Volume" Indicator Discover the "Better Volume" Indicator: The "Better Volume" is the essential market volume analysis tool for traders aiming to stand out. It analyzes tick volumes with unprecedented accuracy, featuring an advanced moving average function (PERIOD_MA) and customizable buy and sell alerts. Key Features: Advanced Volume Analysis: Recognize volume peaks signaling crucial price movements. Intuitive Buy and Sell Alerts: Stay one step a

O SuperTrend é um dos indicadores técnicos mais eficazes e amplamente utilizados no trading, ideal para identificar a direção da tendência e gerar sinais de entrada e saída. Baseado na volatilidade e na tendência, este indicador adapta-se dinamicamente às condições de mercado, proporcionando uma referência visual clara para os traders. Principais Características: Detecção de Tendências: O SuperTrend segue a tendência do mercado, desenhando uma linha que se posiciona acima do preço em uma tendênc

Indicador Financeiro SolarTrade Suite: Comet Market Indicator - O seu guia de confiança no mundo dos mercados financeiros!
Este é um indicador de período que utiliza algoritmos especiais inovadores e avançados para calcular o seu valor, e também possui um design agradável e funções adicionais.
É muito fácil compreender as leituras deste indicador: uma linha vertical verde é o início de um novo período. Como funções adicionais: - clique várias vezes na metade superior da janela principal do
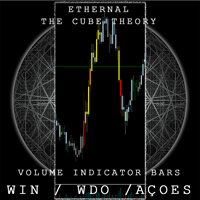
The Cube Bars Brasil pinta os candles de acordo com o volume , excelente para saber os picos de compra e venda . Pode ser regulado livremente pelo usario . Possui regulagem de parametro de entrada para que o usuario tenha a liberdade de regular o colume de acordo com o ativo que escolher . Possui 4 cores que diferenciam os candles de acordo com o tamanho do volume naquele instante
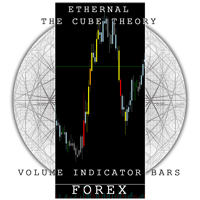
the cube bars forex é um indicador para meta trader 5 criado por mim Tomas Lekim para colorir os candles baseados nos picos de volumes dos grandes investidores do mercado forex . Ele rastreia os picos de compra e venda e pinta os candles de acordo com a quantidade de dinheiro investido pelos outros robos . É uma ferramenta poderosa contra os grandes robos porque identifica os momentos em que deve tomar decisoes . Pode ser configurado de acordo com o par de moedas que ira usar . Possui 4 cores di

Indicador "Fair Value Gap" (FVG) - Descubra o Poder das Descontinuidades de Mercado O mundo do trading está repleto de oportunidades ocultas, mas somente aqueles que possuem as ferramentas certas conseguem identificá-las e aproveitá-las de forma eficaz. O nosso Indicador FVG foi projetado para ajudá-lo a fazer exatamente isso. Se você é um trader que busca aprimorar sua capacidade de leitura do mercado e identificar os melhores pontos de entrada e saída, o Indicador FVG é o seu aliado perfeito.
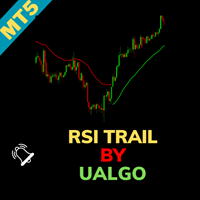
RSI Trail [UAlgo] Indicator for MetaTrader 5 The RSI Trail [UAlgo] indicator is a sophisticated technical analysis tool designed to enhance trading strategies by leveraging the Relative Strength Index (RSI) in conjunction with various moving average calculations. This indicator dynamically plots support and resistance levels based on RSI values, offering clear visual signals for potential bullish and bearish market conditions. Key Features:
Dynamic Support and Resistance Levels: The indicator
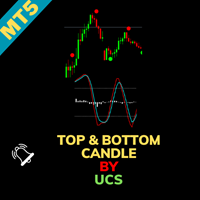
UCS_Top & Bottom Candle Indicator for MetaTrader 5 The UCS_Top & Bottom Candle is an innovative experimental indicator designed for MetaTrader 5. Based on momentum, this indicator identifies the top and bottom candles for most swing movements, assisting traders in making precise market entries and exits. Key Features: Momentum-Based Analysis: Utilizes momentum to detect the top and bottom candles for swing trading opportunities. Customizable Settings: Percent K: Set the Percent K value (default
O que é o "Schaff RSX"? O "Schaff RSX" combina a eficácia do Índice de Força Relativa (RSX) com a precisão do Ciclo Schaff, criando um indicador único que ajudará você a identificar com facilidade os melhores momentos para entrar e sair do mercado. É como ter um radar que detecta oportunidades de trading escondidas, dando a você uma vantagem competitiva que outros traders simplesmente não podem ignorar. Por que Escolher o "Schaff RSX"? Simplicidade Visual Clara e Intuitiva : As cores e linhas do

Perfil do mercado do HiperCube!
Um Perfil de Mercado é uma representação gráfica que combina informações de preços e de tempo sob a forma de distribuição. Apresenta informações de preço na escala vertical (eixo y) e informações de volume na escala horizontal (eixo x). Este tipo de gráfico fornece informações sobre a atividade do mercado, permitindo que os comerciantes visualizem e avaliem o valor justo de mercado em tempo real.
Funcionalidades: Cores personalizadas Gráfico personalizado Cla
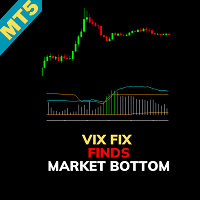
Indicator Name: CM_Williams_Vix_Fix Finds Market Bottoms Overview: The CM_Williams_Vix_Fix Finds Market Bottoms indicator is an advanced tool designed to identify market reversal points across various asset classes. Inspired by the original work of Larry Williams, this indicator provides similar insights to the VIX for stock indices but with the added flexibility of functioning effectively across all asset types. Key Features: Versatility Across Asset Classes: Unlike traditional indicators that

O "HiperCube USD INDEX (DXY /USDX) " é um referencial financeiro que representa o desempenho de um grupo específico de ativos, como ações, obrigações ou mercadorias, com valores denominados em dólares norte-americanos. Estes índices ajudam os investidores a acompanhar e comparar o desempenho de determinados setores ou mercados ao longo do tempo. Ao ser expresso em dólares americanos, o índice fornece uma medida consistente para avaliar os investimentos, independentemente da moeda nativa ou da l
Entry Confirmation Indicator for MT5: Precision Trading for Volatility Indices The Entry Confirmation Indicator for MetaTrader 5 (MT5) is a powerful and versatile tool tailored specifically for traders who focus on volatility indices. Whether you're looking to capitalize on trend continuations or identify key reversal points, this indicator is designed to provide clear and actionable signals that enhance your trading strategy. Targeted Instruments: A Focus on Volatility This indicator is optimiz
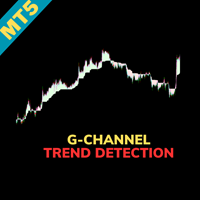
Indicator Name: G-Channel Trend Detection Overview: The G-Channel Trend Detection indicator offers a unique approach to trend analysis, leveraging AlexGrover's G-Channel methodology. This indicator provides a clear and simplified view of market trends by identifying bullish and bearish conditions based on price interactions with the G-Channel boundaries. Key Features: Trend-Based Market Analysis: The indicator determines trend direction by monitoring price action relative to the G-Channel bounda

DYJ SmoothedMA Strategy is a very simple but powerful system to get forex and s ynthetic market trend direction. This indicator is actually a moving average indicator containing 10 smoothing algorithms in a file . The indicator can help you to see the whole trend break out/rebound signal. And these BUY and SELL signals are sent out. You can use DYJ GameDevice follow-up software to receive these signals and realize automatic opening and closing of positions. And can use the game strategy fu

This is a early support and resistance indicator. It will allow you to choose how many candles back. You can use it on all timeframes. Change the color as you like. You can use it with other indicators for better entry prediction it will give you trend for bear market and bull market. It will help you predict sideways market trending market and falling market. Save trading
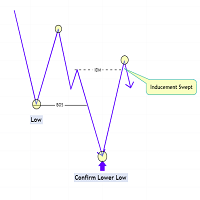
The Market Structure with Inducements & Sweeps indicator is a unique take on Smart Money Concepts related market structure labels that aims to give traders a more precise interpretation considering various factors.
Compared to traditional market structure scripts that include Change of Character (CHoCH) & Break of Structures (BOS) -- this script also includes the detection of Inducements (IDM) & Sweeps which are major components of determining other structures labeled on the chart.
SMC &

Previous Candle Levels MT5 shows the previous candle levels, it shows the previous candle Open High Low Close levels (OHLC Levels) in different time frame. It's designed to help the trader to analyse the market and pay attention to the previous candle levels in different time frame. We all know that the OHLC Levels in Monthly, Weekly and Daily are really strong and must of the time, the price strongly reacts at those levels. In the technical analysis, the user can use them as a support and res
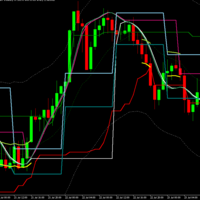
Mega Analyzer MT5 Indicator: A Comprehensive Trading Solution In the dynamic world of trading, having an edge can make all the difference. The "Mega Analyzer MT5 Indicator" offers traders that edge, providing a powerful tool that deciphers market movements with precision and clarity. Designed for both novice and experienced traders, this indicator is tailored to enhance decision-making and optimize trading strategies by revealing key price levels and market conditions that often go unnoticed by
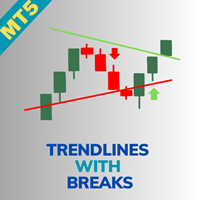
Indicator Name: Trendlines with Breaks [LuxAlgo] Overview: The Trendlines with Breaks [LuxAlgo] indicator provides traders with pivot point-based trendlines that highlight real-time breakouts. This tool is highly customizable, allowing users to adjust the steepness of trendlines, choose different slope calculation methods, and receive alerts on trendline breakouts. Key Features: Pivot Point-Based Trendlines: The indicator automatically generates trendlines based on pivot points, providing a clea

Buy Sell Storm
Professional indicator for trading on financial markets, designed for MT5 platform .
Trading on the indicator is very simple, Blue arrow to buy , Red arrow to sell.
The indicator does not redraw and does not change its values.
After purchase write to me and I will send you a Bonus in the form of an EA Buy Sell EA on this indicator.
( see the video of the EA on the indicator, the set file is attached).
In the default settings the Period parameter is set to -

Trendline Wizard Overview: The Trendline Wizard is a powerful and versatile MetaTrader 5 indicator designed for traders who rely on trendlines for their technical analysis. This indicator automatically monitors specified trendlines and provides real-time alerts when price action interacts with these critical levels. Whether you’re a swing trader, day trader, or long-term investor, the Trendline Wizard is an essential tool to enhance your trading strategy. Key Features: Customizable Alerts : Set

Resumo O Indicador de ATR Multinível e Bandas de Média Móvel é uma ferramenta poderosa projetada para ajudar os traders a identificar tendências de mercado, níveis de suporte e resistência, e volatilidade. O indicador combina múltiplas médias móveis com um multiplicador de ATR (Amplitude Média Verdadeira) para criar um gráfico de bandas visual ao redor da flutuação dos preços. Ajuda os traders a detectar possíveis áreas de reversão, condições de tendência e zonas de consolidação do mercado. Cara
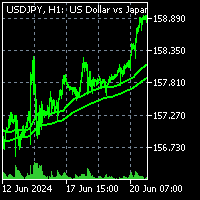
To get access to MT4 version please click here . This is the exact conversion from TradingView: "Liquidity Weighted Moving Averages" by "AlgoAlpha ". This is a light-load processing and non-repaint indicator. All input options are available expect time frame input . Buffers are available for processing in EAs. You can message in private chat for further information/changes you need. Thanks for downloading

Indicador TK - Rainbow Descrição: O indicador TK - Rainbow é uma ferramenta robusta para análise técnica, projetada para fornecer uma visão clara das tendências de mercado por meio de uma abordagem com várias linhas. Com 30 linhas calculadas em diferentes períodos, oferece uma análise extensa dos movimentos de preços. O indicador utiliza um esquema de duas cores para destacar tendências de alta e baixa, facilitando a interpretação das condições do mercado de relance. Principais Características:
Bem-vindos à teoria do Cubo de Tomas Lekim . A Teoria se baseia no calculo do maior padrao existente na natureza . Um padrao que contem todos os outros padroes e sequencias . Todos os padroes como numeros primos , Fibonacci e outras sequencias de numeros estao contidas na malha universal da minha teoria . É possivel perceber o padrao dos precos e o encontro entre as duas forças contraria existentes em toda a logica de negociacao e competicao . .Jogos em que um time compete com outro time . Jogo

Ekom Spike Detector Pro
Take your trading to the next level with the Ekom Boom and Crash Spike Detector Indicator Pro, designed for serious traders who demand more. This advanced version provides: Key Features: - Accurate Spike Detection: Identify high-probability spike patterns in real-time using price action - Clear Visual Signals: Displays clear buy and sell arrows on the chart for easy decision-making - Customizable: easily change arrows and line colors and also select wether Boom or

1. What is this Due to the limitation of MT5 software, we can only see the minimum 1-minute candlestick chart. Sometimes this is not enough for high-frequency traders, or we want to see a more detailed candlestick chart. This tool allows you to see: A candlestick chart composed of N seconds, which allows you to better understand the price fluctuations. For example, each candle line has 20 seconds, or 30 seconds.
2. Parameters: SecondCandle = 20; // The second cnt for one candle, Need
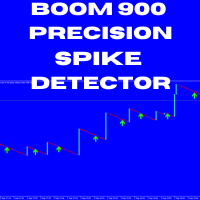
Boom 900 Precision Spike Detector The Boom 900 Precision Spike Detector is a powerful tool designed to help traders accurately identify spike opportunities in the Boom 900 market. With advanced features and precise alerts, this indicator takes the guesswork out of trading, enabling you to maximize your profits with confidence. Key Features: Non-Repainting Signals: Get reliable signals without repainting, ensuring your trading decisions are based on accurate, real-time data. Audible Alerts: Stay
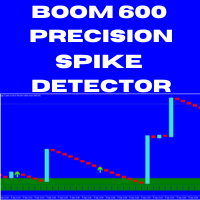
Boom 600 Precision Spike Detector The Boom 600 Precision Spike Detector is your ultimate tool for trading the Boom 600 market with precision and confidence. Equipped with advanced features, this indicator helps you identify potential buy opportunities and reversals, making it an essential tool for traders aiming to capture spikes with minimal effort. Key Features: Non-Repainting Signals: Accurate, non-repainting signals that you can trust for reliable trading decisions. Audible Alerts: Stay on t
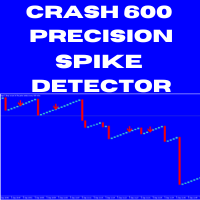
Crash 600 Precision Spike Detector The Crash 600 Precision Spike Detector is an essential tool designed to help traders navigate the Crash 600 market with accuracy and efficiency. Packed with advanced features, this indicator provides precise alerts that allow traders to capture spikes and reversals with confidence. Key Features: Non-Repainting Signals: Dependable, non-repainting signals that ensure your trading decisions are based on real-time, accurate data. Audible Alerts: Receive sound notif

In the context of trading, Malaysia SNR (Support and Resistance) refers to the technical analysis of support and resistance levels in financial markets, particularly for stocks, indices, or other assets traded. This is single timeframe version. Multiple timeframe version is avaiable here . There are three type of Malaysia SNR level Classic , GAP and Flipped 1. Classic Support is the price level at which an asset tends to stop falling and may start to rebound. It acts as a "floor" where demand is
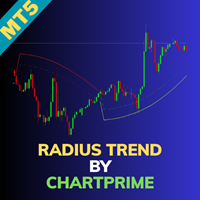
Radius Trend by ChartPrime Overview: The Radius Trend indicator is an advanced technical analysis tool designed to visualize market trends through an adaptive, radius-based method. With dynamic bands that react to price action and volatility, it offers traders a unique insight into trend strength, direction, and potential reversals. Unlike traditional trend lines, this indicator adjusts dynamically like a radius sweeping across the chart, creating a fluid approach to trend analysis. Key Features

This indicator is one of our first brilliant programs, the indicator is quite useful and seems to give the best results when combined with price action, and a combination of oscillators , mainly the Bollinger bands and the moving average , you can also use this on all time frames but be careful on the lower time-frames as the trend is not too steady or rather moves fast, this will help you have better entries.

This is one of our best products available on the market, it will work with every pair you can think of, this ea works together hand in hand with the trend and support and resistance strategy , it will work with all the timeframes and all oscillators , this will amaze you on how best it works and makes trading a whole lot easier you can use this with the rsi oscillator for best results.
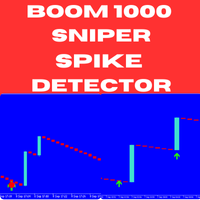
Boom and Crash Sniper Spike Detector - Boom 1000 The Boom and Crash Sniper Spike Detector is the ultimate tool for spike trading on Boom 1000, offering clear and reliable signals to help you capture high-probability trades. This advanced indicator is designed to enhance your trading strategy by simplifying spike detection and maximizing your profits. Key Features: Multi-Timeframe Compatibility : The indicator can be used on M1, M5, M15, M30, and H1 timeframes, but it works best on the M1 timefra
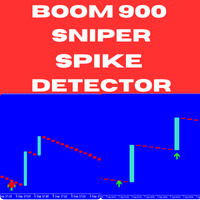
Boom and Crash Sniper Spike Detector - Boom 900 Unlock the potential of spike trading on Boom 900 with the Boom and Crash Sniper Spike Detector. This cutting-edge indicator provides precise and clear signals, helping you identify high-probability trades and capture spikes effortlessly. Designed for traders who want to enhance their trading performance, this tool simplifies the process of detecting spike opportunities. Key Features: Multi-Timeframe Compatibility : The indicator works across multi
O Mercado MetaTrader é o melhor lugar para vender robôs de negociação e indicadores técnicos.
Você apenas precisa desenvolver um aplicativo para a plataforma MetaTrader com um design atraente e uma boa descrição. Nós vamos explicar como publicar o seu produto no Mercado e oferecer a milhões de usuários MetaTrader.
Você está perdendo oportunidades de negociação:
- Aplicativos de negociação gratuitos
- 8 000+ sinais para cópia
- Notícias econômicas para análise dos mercados financeiros
Registro
Login
Se você não tem uma conta, por favor registre-se
Para login e uso do site MQL5.com, você deve ativar o uso de cookies.
Ative esta opção no seu navegador, caso contrário você não poderá fazer login.