适用于MetaTrader 5的技术指标 - 2

基于较高时间框架的分形水平是一款功能强大的工具,旨在根据较高时间框架的分形建立准确的支撑和阻力水平,为您提供买入和卖出信号,并发出便捷的警报。
工作原理:该指标分析高级时间框架上的分形水平,并将其显示在当前图表上。您可以在指标属性中轻松调整高级时间框架,以获得最大的准确性和策略相关性。
使用基于高级时间框架的分形水平线的好处:
早期信号检测:由于可以在较低的时间框架上看到较高时间框架的分形水平,因此可以在开始时识别潜在的买入和卖出信号。 提高盈亏比:在较低的时间框架上提前进场,可以设置更短的止损,从而显著提高交易效率。 便捷的警报:绝不会错过任何重要信号--即时获得进场和出场机会的通知。 提高分析准确性:专注于真正重要的关键水平,忽略不必要的市场噪音。 使用基于更高的时间框架的分形水平指标,可以让您以全新的方式观察市场,改善您的交易结果。发现新的交易机会,以无与伦比的准确性和效率实现您的目标。

Was: $99 Now: $34 Blahtech Daily Range indicator displays the average daily range alongside the individual session ranges. Using the daily open price as a reference the indicator shows fixed range and dynamic range targets as lines on the charts. These lines clearly show when the average range has been exhausted. Daily and session ranges can be useful for confirming entries or setting targets and is an excellent odds enhancer for many trading systems. Links [ Documentation | Install |

该指标在图表上绘制趋势线。该指标有六个输入。用户可以为这两行指定替代标签。如果使用了指标的多个实例,则标签必须不同。用户可以设置线条的宽度和颜色以及深度,以指定应使用哪些显着的峰。例如,“深度= 10”使用当前的峰和谷设置趋势线,这些峰和谷在右侧和左侧至少有10条,并且高/低比峰值的高/低小/大。指标还绘制以前的高峰和低谷。指示器还具有警报功能,当价格与支撑线/阻力线相距预设距离时,可用于通知用户。警报距离以点为单位设置。.............................................................................................
FREE

这是一种基于MACD的趋势跟踪指标,当处于200 MA之上时提供买入信号,当低于200 MA时提供卖出信号。当MACD穿过零线时,将生成信号。此指标还展示了可用作止损的支撑和阻力水平。
可调整的参数包括MA周期、MACD快速EMA、慢速EMA以及支撑-阻力间隔。它绘制在最近蜡烛的最低点和最高点。
默认设置如下: SR间隔:10, MA周期:200, 快速EMA:24, 慢速EMA:26。
调整这些值可能导致信号更频繁或更少,建议进行测试以确定最有效的配置。
推荐使用1小时或4小时的时间框架,但在任何时间框架上都可能有效。该指标适用于所有交易工具,包括外汇、股票和商品等。
欢迎进一步了解其详细应用和优势。此外,它还包含报警功能。
请查看我的其他产品: https://www.mql5.com/en/users/8587359/seller
FREE

該指標的主要目的是確定交易進入和退出的時刻,因此 ExactArrow 除了顯示進入和退出市場的位置的箭頭之外不會繪製任何其他內容。
儘管該指標表面上很簡單,但其內部卻具有復雜的分析算法,系統藉助這些算法確定進入和退出的時刻。
該指標給出了當前蠟燭上出現的準確、及時的進入和退出交易信號。 該指標平均比同類指標早 1-2 個蠟燭發出信號。
使用該指標非常簡單。 當出現向上箭頭時,打開買入交易。 當出現向下箭頭時,打開賣出交易。
指標的輸入參數:
SoundAlert-啟用/禁用警報 period - 指標週期 EmailAlert - 發生警報時發送電子郵件 MobileAlert - 當信號出現時向移動終端發送消息
該指標不會重繪其值:如果箭頭出現在某個位置,則它會停留在那裡。

节省时间并做出更明智的决策,使用锚定的 Sweet VWAP 如果您想测试这个工具的威力,您可以下载 MetaTrader 5 的锚定 VWAP 免费指标 。 除了这个指标可以独立工作外,它还是 Sweet VWAP 免费版本的一个扩展。 这是因为当您点击免费版本时,您在鼠标指针上看到的那个 VWAP 将被固定。为了更好地理解,固定在那里的是这个指标,具有其所有功能。 此指标与 Sweet VWAP 完全集成,这是 MetaTrader 5 的免费锚定 VWAP 指标。 功能 固定时间 这是您想要锚定 VWAP 的蜡烛。这是由 Sweet VWAP(免费版本)自动完成的,只需单击图表即可。 交易量类型 您可以选择交易量类型,也可以将其保持自动。自动表示它将使用交易资产的实际交易量作为优先级,前提是经纪商提供此信息。 VWAP 平滑方法 简单: 这是 VWAP 的标准计算,即价格加权交易量。 指数: 第一个变体。使用此计算,VWAP 对最新价格赋予更大的权重。如果您觉得市场刚刚形成了一个新的底部/顶部,这非常有用。然后,您检查在形成底部/顶部的蜡烛中形成的 AVWAP,并且在接下来的顶部

RSI divergence indicator finds divergences between price chart and RSI indicator and informs you with alerts (popup, mobile notification or email). Its main use is to find trend reversals in the chart. Always use the divergence indicators with other technical assets like support resistance zones, candlestick patterns and price action to have a higher possibility to find trend reversals. Three confirmation type for RSI divergences: RSI line cross 50 level Price returns to previous H/L C
FREE

A Heatmap with a Volume Profile is like a thermal imager or x-ray machine. It will help you to estimate the relative distribution of volume during the price movement and to understand the relationship between volume and price. Indicator Volume Profile "Volumos Maxima" is a powerful tool for analyzing this relationship. After simple experimentation with heatmap, you can find that each trading instrument has its own “ characteristic ” way of distributing volume. And this will help you to make a b

MT4 version | Owl Smart Levels Indicator | Owl Smart Levels策略 | FAQ
Fractals Indicator 是作者 Bill Williams 交易策略的要素之一。 它用於在價格圖表上搜索價格反轉點,從而搜索支撐位和阻力位。 Full Fractals Indicator 是改進的 Fractals,幾乎所有交易終端的工具包中都有。 唯一的區別是,為了構建分形,我們在主蠟燭的左側使用了 5 根蠟燭,在主蠟燭的右側使用了 2 根蠟燭(參見圖 1)。 除了基本構造之外,Full Fractals 還尋找價格已停止一段時間的水平。 Telegram 聊天: @it_trader_chat 新的 Expert Advisor Prop Master - 在您的交易终端中进行测试 https://www.mql5.com/zh/market/product/115375 Full Fractals Indicator 表示什麼。 分形在價格圖表上顯示為關鍵蠟燭上的向上和向下箭頭。 基於
FREE

The Forex Master Pattern is an alternative form of technical analysis that provides a framework which will help you to find and follow the hidden price pattern that reveals the true intentions of financial markets. This algorithm here does a good job detecting the Phase 1 of the Forex Master Pattern cycle, which is the contraction point (or Value).
On Phase 2 we get higher timeframe activation (also called Expansion), which is where price oscillates above and below the average price defined

Dark Sprint is an Indicator for intraday trading. This Indicator is based on Trend Following strategy, also adopting the use of the atr to determine the right volatility. We can enter in good price with this Indicator, in order to follow the strong impulse on the current instrument.
Key benefits
Easily visible sprint lines Intuitive directional arrows Automated adjustment for each timeframe and instrument Easy to use even for beginners Never repaints, never backpaints, Not Lag 100% compati

A simple indicator that automatically highlights all FVGs (Fair Value Gaps) formed on the chart, as well as FVGs on history. It is possible to select colors for FVGs of different directions (long or short), select the time interval, select the color of middle point and you can also choose whether to delete filled FVGs or leave them on the chart (the option is beneficial for backtesting). The indicator can be very useful for those, who trade according to the concept of smart money, ICT, or simply
FREE

The indicator draws the time scale on the chart. You can specify the time offset, adjust the size and font to display on the chart ( it is displaying your local time on your chart instead of MT time ). You can also select the desired format for displaying the date and time. You may be interested in my other product , which contains a more advanced version of the Time Scale .
Parameters Hours (time shift) — time shift (hours); Minutes (time shift) — time shift (minutes); Show time on mouse — sh
FREE

金融指标 SolarTrade Suite:水星市场指标 - 您在金融市场世界中的可靠指南!
这是一种移动平均线,使用特殊的创新和先进算法来计算其值,并且具有令人赏心悦目的设计。
理解此指标的读数非常简单:蓝色 - 买入,红色 - 卖出。
颜色越亮,信号越强。
在说明底部查看我们的其他 SolarTrade Suite 产品。
您想自信地驾驭投资和金融市场的世界吗? SolarTrade Suite 金融指标:水星市场指标是一款创新软件,旨在帮助您做出明智的投资决策并增加利润。
SolarTrade Suite 金融指标:水星市场指标的优势:
- 准确预测:我们的指标使用先进的算法和分析方法来准确预测市场走势。
获取有关买卖资产最佳时机的信号。
- 用户友好界面:直观的界面将使您能够轻松掌握该程序并在安装后立即开始享受其好处。 您可以从设置中更改线条的颜色、粗细和样式,所有其他设置均自动完成。 - 专家支持:我们的专业团队随时准备为您解答任何问题,并为您提供有关使用该程序的建议。
为什么选择 SolarTrade Suite 财务指标:水星市场

MA3 Trend MT5 - is the good trend indicator on three MAs . Benefits of the indicator: The indicator produces signals with high accuracy.
The confirmed signal of the indicator does not disappear and is not redrawn.
You can trade on the MetaTrader 5 trading platform of any broker.
You can trade any assets (currencies, metals, cryptocurrencies, stocks, indices etc.).
You can trade on any timeframes (M5-M15 scalping and day trading / M30-H1 medium-term trading / H4-D1 long-term trading).
FREE

The Supertrend indicator was originally created by a french fellow named Olivier Seban , and its goal is to identify the Primary Trend of prices . Its calculation is easy and based on the average of Highs and Lows and then we add the volatility of a custom period, plus a multiplier. This way we get the Supertrend Line. You can find in the web several approaches and trading strategies using this very useful indicator.
HOW TO "READ" THIS INDICATOR
If the closing prices are above Supertrend Line
FREE

One of the most powerful and important ICT concepts is the Power of 3. It explains the IPDA (Interbank Price Delivery Algorithm) phases. PO3 simply means there are 3 things that the market maker's algorithm do with price:
Accumulation, Manipulation and Distribution
ICT tells us how its important to identify the weekly candle expansion and then try to enter above or below the daily open, in the direction of the weekly expansion.
This handy indicator here helps you keep track of the weekly

MACD (short for Moving Average Convergence/Divergence) is one of the most famous and oldest indicators ever created and is widely used among beginners . However, there is a newer version of the MACD that is named Impulse MACD which have less false signals than the standard MACD. Classic MACD helps us to identify potential trends by displaying crossovers between two lines. If MACD line crosses above the Signal line it shows us that the market is potentially up trending and that

This indicator can identify more than 60 candlestick patterns on the chart, including their bullish and bearish variants. Just choose the pattern you want in the settings.
Available Patterns 2 Crows Gravestone Doji On Neck 3 Black Crows Hammer Piercing 3 Inside Hanging Man Rick Shawman 3 Line Strike Harami Rising and Falling Three Method 3 Outside Harami Cross Separating Lines 3 Stars in South High Wave Shooting Star 3 White Soldiers Hikkake Short Line Abandoned Baby Hikkake Modified Spinning
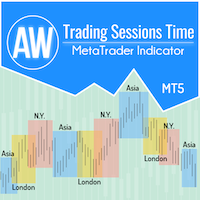
为了方便交易者获取市场表现数据并更好地制定交易策略,我们开发了交易时段指标。各个交易所的开盘时间会影响交易,因为它会影响市场活动和交易量。这些因素决定了不同工具的波动性和交易机会。 AW 交易时段指标显示亚洲、伦敦和纽约市场的交易时间。交易者可以显示或隐藏不同的时区以获得更好的体验。在图表上,您可以看到距离交易时段结束的时间,以及交易时段的大小。图表上数据的显示具有灵活的图形调整,适合不同风格的交易图表。
更多产品 -> 这里
优点:
显示亚洲、伦敦和纽约交易时段, 如果有必要,以数字显示会话大小, 开启后,显示交易时段结束的时间, 可以单独禁用交易时段, 图表上可自定义的会话边框样式 如果需要,可以在图表上显示垂直线 可以用纯色显示会话 自定义会话文本(颜色、偏移量、名称)
输入变量:
主要设置 Number_of_Days-显示指标的天数。
Show_Session_Size_in_Points - 启用后,指标将显示每个交易时段规模的数字值(以点为单位)。
Show_Time_Until_end_of_Session - 在图表的右上角显示或隐藏会话结束的时
FREE
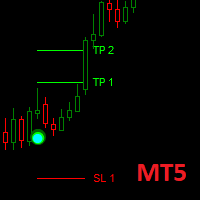
Dark Point is an Indicator for intraday trading. This Indicator is based on Trend Following strategy, also adopting the use of the atr to determine the right volatility. We can enter in good price with this Indicator, in order to follow the strong trend on the current instrument. If you love Dark Point, consider adding some power: Dark Power
Key benefits
Easily visible take profit/stop loss lines Intuitive directional points/arrows by colors Useful statistics , which indicate the
FREE

The Market Structures MT5 indicator finds and shows the Break Of Structures (BoS) pattern on the chart. The pattern is an important part of the Smart Money Concepts (SMC) system.
The appearance of a pattern means that the price breaks the last peak of an uptrend, or the last bottom of a downtrend. This indicates a change in the existing trend structure and the beginning of a new movement.
BOS is a technical analysis tool used to identify trend reversals.
The set of input parameters is simple
FREE

金融指标 SolarTrade Suite:冥王星市场指标 - 您在金融市场世界中的可靠指南!
它是一个波动率振荡器,使用特殊的创新和高级算法来计算其值,并且设计美观。
理解此指标的读数非常简单:绿色 - 低波动性和开立交易的最佳时间,橙色 - 高波动性和考虑平仓的时间。
颜色越亮,信号越强。
为方便起见,可以通过单击此指标的窗口来反转信号。
在说明底部查看我们的其他 SolarTrade Suite 产品。
您想自信地驾驭投资和金融市场的世界吗? SolarTrade Suite 金融指标:冥王星市场指标是一款创新软件,旨在帮助您做出明智的投资决策并增加您的利润。
SolarTrade Suite 金融指标:冥王星市场指标的优势:
- 准确预测:我们的指标使用先进的算法和分析方法来准确预测市场走势。 获取有关购买和出售资产的最佳时机的信号。 - 用户友好界面:直观的界面将使您能够轻松掌握程序并在安装后立即开始享受其优势。 从设置中,您可以更改线条的颜色、粗细和样式,所有其他设置均自动完成。 - 专家支持:我们的专业团队随时准备帮助您解决任何问题并提供

Classic MACD
It has MACD line, Signal line, and Histogram . The Histogram has 4 colors , showing its movement direction as simple as possible. The smoothing factor in the input helps to eliminate noisy signals. Besides different price types (hlc, hlcc, ohlc, ...), there is an option to use volume data as the source for MACD calculations (which is better to be used by real volume not unreliable tick volume). While the original MACD indicator uses Exponential Moving Average, this indicator provid
FREE

Seconds Chart For MetaTrader 5 The Indicators allows you to create charts in the MetaTrader 5 terminal with a timeframe in seconds. The timeframe on such a chart is set in seconds, not in minutes or hours. Thus, you can create charts with a timeframe less than M1. For example, S15 is a timeframe with a period of 15 seconds. You can apply indicators, Expert Advisors and scripts to the resulting chart. You get a fully functional chart on which you can work just as well as on a regular chart. The t

As it name implies, this is an exaustion oscillator. However, you may wonder: what differs you from others oscillators like RSI, Stochastic, CCI etc? The difference is that ours is more powerful and accurate ! Your oscillator filters the nois e made by other oscillators, and shows you only the exact moment to enter the trade. Of course, using it alone, like any other indicator, has its risks. Ideally, reconcile it with technical analysis and/or others indicators. If you buy i t you ge t up to 1

我们的指标将提供一个价差筛选器来同时监控多对的价差,并且蜡烛计时器倒计时显示当前柱关闭和新柱形成之前的剩余时间。
限时优惠:我们所有的溢价指标仅售 50 美元,通过访问我们的 MQL5 博客,您将找到我们溢价指标的所有详细信息。 点击这里。
主要特征 我们的指标将提供一个价差筛选器来同时监控多对的价差,并且蜡烛计时器倒计时显示当前柱关闭和新柱形成之前的剩余时间。
监控多对同时传播。 跟踪服务器时间,而不是本地时间。 可配置的文本颜色和字体大小 优化以减少 CPU 使用率 个性化的配对列表。
接触 如果您有任何问题或需要帮助,请通过私信联系我。
警告 警告 我们所有的指标和工具只能通过官方 Metatrader 商店 (MQL5 市场) 获得。
作者 SAYADI ACHREF,金融科技软件工程师和 Finansya 创始人
FREE

功能
斐波那契回调交易指标 根据之前选择的1小时、4小时、1天和1周中的某个时间段绘制斐波那契图表。 当市场价格触及斐波那契水平时,颜色会变化,并显示触摸时间。 斐波那契图在-23.6、0、23.6、38.2、50、61.8、76.4、100和123.6水平绘制,当柱更新时,图表会刷新。
变量
时间框架:根据选择的1小时、4小时、1天和1周时间框架绘制斐波那契图表。 FiboWidth:确定水平线的粗细。 FiboStyle:设置枢轴水平线的样式。 TouchedColor:触摸时变化的颜色。
如果您发现任何错误或希望看到改进,请发表评论。 评价对开发者非常有帮助。如果您满意,请给我们5星评价。
-----------------------
FREE

For any trader, the result of market analysis is the correct determination of entry and exit points from the market. The ClearArrows indicator does not display any unnecessary information that may distract or mislead the trader, but only the most important thing. The indicator is very easy to use, when a down arrow appears, you need to open a SELL deal, when an up arrow appears you need to open a BUY deal.
The ClearArrows indicator, despite its outward simplicity, has a large analytical algor

Volality Index scalper indicator Meant for Volality pairs such as Volality 10, 25, 50, 75 and 100 The indicator works on all timeframes from the 1 minute to the monthly timeframe the indicator is non repaint the indicator has 3 entry settings 1 color change on zero cross 2 color change on slope change 3 color change on signal line cross Orange line is your sell signal Blue line is your buy signal.

自动在你的图表上画出支撑位和阻力位以及推动性蜡烛缺口,这样你就可以看到价格接下来可能会走向哪里和/或可能会逆转。
该指标旨在作为我的网站(The Market Structure Trader)上教授的头寸交易方法的一部分,并显示目标和潜在入场的关键信息。 MT4 Version: https://www.mql5.com/en/market/product/97246/ 该指标有两个核心功能和四个附加功能: 核心功能1 - 日线、周线和月线的自动支持和阻力线 该指标为你自动绘制过去2天以及6周和数月前的最新支撑和阻力水平。你可以完全自定义这些水平的外观以适合你,并显示多少个。这些关键水平通常作为主要的支持和阻力区,价格将从这里转向并回撤或逆转。它们也是价格将走向的目标,因此你可以迅速看到在价格可能转向之前交易的潜在距离。
核心特征2--推进型蜡烛缺口目标 推进性缺口蜡烛是银行和机构通过在任何市场上执行大额头寸而创造的强劲、快速的移动。这些大阳线一旦形成,有两个关键作用。
1. 1.它们作为一个方向性信号,因为大型市场参与者已经选择了一个方向,一旦发生,价格往往会在一段
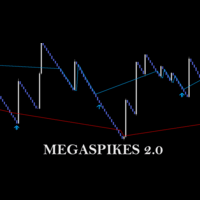
check out Megaclasic Spikes Robot here: https://www.mql5.com/en/market/product/109140 https://www.mql5.com/en/market/product/109140 MEGASPIKES BOOM AND CRASH v 2.0 NB: source codes of this indicator are available: PM me: https://t.me/Machofx The indicator is developed form a Studied combination of MA - Moving Average SAR - Parabolic Support and Resistance CCI - Commodity Channel Index
MegaSpikes 1.0 Download the 'MegaSpikes Boom and Crash' Technical Indicator for MetaTrader 5 in MetaTr
FREE

The indicator displays volume clusters or volume profiles to choose from. For trading symbols which contain the tape of deals, the indicator can perform calculations based on the tape of deals.
Input variables
StepPoint - cluster step in points, if the value is zero, the step is assigned automatically. HistoryTicks - size of tick history (for VolumeType in the mode TimeAndSales). AssociatedTimeframe - binding the indicator to the specified timeframe of the chart, if the value is equal to

FREE

The indicator draws supply and demand zones. The zone timeframe can be set independently of the chart timeframe. For instance, it is possible to set M5 zones on an H4 chart. The importance of zones can be adjusted using the zone strength parameter. Demand zones are displayed if at least one candle in the range of the zone is entirely above the zone. Similarly, supply zones are displayed if at least one candle within the zone is entirely below the zone.

This information indicator will be useful for those who always want to be aware of the current situation on the account.
- More useful indicators
The indicator displays data such as profit in points, percentage and currency, as well as the spread for the current pair and the time until the bar closes on the current timeframe. There are several options for placing the information line on the chart: - To the right of the price (runs behind the price); - As a comment (in the upper left corner
FREE

** All Symbols x All Timeframes scan just by pressing scanner button ** *** Contact me after the purchase to send you instructions and add you in "M W Scanner group" for sharing or seeing experiences with other users. Introduction: Double Top(M) and Double Bottom(W) is a very repetitive common type of price reversal patterns. Double Top resembles M pattern and indicates bearish reversal whereas Double Bottom resembles W pattern and indicates a bullish reversal that they have high win r

The order block locator is powered by three main search algorithms thar can be used to find order blocks. Simple Fractal Search Algorithm Naive Fractal Movers Algorithm
Candle Transition Algorithm You can even combine the power of your 2 favourite algorithms and get the best of both worlds: Mixed Algorithm (Naive Fractal + Candle transition) Mixed Algorithm (Simple Fractal + Candle Transition
Simple Fractal Search Algorithm
The algorithm finds the fractals based on your setting paramers fo

This is the latest iteration of my famous indicator, Reversal Fractals, published for the first time almost a decade ago. It examines the price structure of fractals to determine possible reversal points in the market, providing timing to positional traders that already have a fundamental or technical valuation model. [ Installation Guide | Update Guide | Troubleshooting | FAQ | All Products ] Reversal fractals can start long trends The indicator is non repainting
It implements alerts of all k
FREE

The Smart Liquidity Profile is color-coded based on the importance of the traded activity at specific price levels, allowing traders to identify significant price levels such as support and resistance levels, supply and demand zones, liquidity gaps, consolidation zones, Buy-Side/Sell-Side Liquidity and so on. Smart Liquidity Profile allows users to choose from a number of different time periods including 'Auto,' 'Fixed Range,' 'Swing High,' 'Swing Low,' 'Session,' 'Day,' 'Week,' 'Month,' 'Quart

The CAP Channel Trading is a volatility-based indicator that makes use of the “advanced envelope theory”. These envelopes consist of two outer lines. Envelope theory states that the market price will generally fall between the boundaries of the envelope (or channel). If prices move outside the envelope, it is a trading signal or trading opportunity.
Benefits of the Channel Trading Indicator CAP Channel Trading works with any asset
It can be applied to any financial assets: forex, cryptoc
FREE

FREE Heiken Ashi Smoothed indicator is fully adjustable, easy to use and comes with possibility to access the indicator via iCustom function so you can use it in your own trading software. Indicator can also pop up alerts when signal changes or send push notifications. For Metatrader 4 version click here: https://www.mql5.com/en/market/product/70824 For detailed information click: >>HERE<< Features
Easy to use Accessible via iCustom Fully adjustable Alerts and Push notifications Possi
FREE

你想成为一个持续盈利的五星级外汇交易商吗? 1. 阅读我们简单的 交易系统 的基本描述 和 以及它在2020年的主要策略更新 2. 发送您的购买截图,以获得我们独家交易聊天的个人邀请
FX趋势 实时显示所有时间框架的趋势方向、持续时间、强度和由此产生的趋势评级。
您将一目了然地看到趋势在哪个方向运行,它们持续多长时间以及它们有多强大。
所有这些使它成为初学者、高级和专业交易者的易于使用的趋势交易系统 。
分析功能 所有时间框架的实时趋势分析 所有时间框架的计算结果完全相同 配置您个人的时间框架集 可定制的趋势计算参数 图形功能 在紧凑模式、细节模式和仪表板模式之间一键切换 紧凑模式在一个缩小的面板中提供基本的趋势信息 细节模式提供相关符号的深入趋势分析 仪表板模式涵盖了所有主要的或你最喜欢的交易符号 只需在面板内点击一下,就可以访问所有的时间框架和符号 可移动的外汇趋势显示(通过拖放)。 适用于高分辨率的QHD、UHD和4K显示器 不需要重新画图 一般特征 自动的终端配置 针对平板电脑和触摸屏的使用进行了优化 通过电子邮件、信息和手机通知发出警报 为EA请求提供可访问的缓

Consolidation Zone Indicator is a powerful tool designed for traders to identify and capitalize on consolidation patterns in the market. This innovative indicator detects consolidation areas and provides timely alerts when the price breaks above or below these zones, enabling traders to make informed trading decisions. MT4 Version : https://www.mql5.com/en/market/product/118734
Key Features:
1. Consolidation Detection : - Precise Identification : The Consolidation Zone Indicator a
FREE

如果你象这个项目一样,就有5个饥饿审查。 塔克的后续工作: borelatech 这项指标采用了既定价格的公开、高、低价和关闭价格
可以对特定时间区加以调整。 许多机构和专业人士都认为这些是重要的。
贸易商可以为你了解他们可能更进一步的地点,
积极。 现有期间为: 前一日。 前一星期。 曾任Month。 曾任。 前一年。 或: 目前日。 目前周。 目前 Month。 目前配额。 今年。
FREE

This indicator shows Fractal Breakout Trendlines and Support and Resistance
The Fractal Ascending Trendline and Fractal Descending Trendline are drawn from the last valid fractals. Breakouts can be taken above or below these trendlines. Horizontal lines are drawn from the Last upper and Last lower fractal to show support and resistance levels. Horizontal Upper and Lower Intersection lines are drawn where a fractal trendline has been last intersected, to show where to place a buy or sell orde
FREE

您是否厌倦了在图表上手动绘制斐波那契水平?您是否正在寻找一种方便有效的方法来确定交易中的关键支撑位和阻力位?别再犹豫了! 隆重推出 DrawFib Pro,这是一款可自动执行 ibonacci 水平的 终极 MetaTrader 5 指标 在图表上绘制,并在突破这些水平时及时发出警报。借助 DrawFib Pro,您可以增强交易策略、节省时间并做出更明智的决策。 我的基于斐波那契的指标: Advanced Gartley Pattern MT5 || Price Wave Pattern MT5 主要特征:
自动 斐波那契绘图 . 可定制的 参数 . 准确 可靠. 实时 警报. 用户 友好的 界面 . 对于任何寻求高效、可靠且用户友好的方式在图表上自动绘制斐波那契的交易者来说,DrawFib Pro 是必备工具。 DrawFib Pro 能够提供实时警报并支持各种时间范围,使交易者能够做出更准确、更及时的决策。节省宝贵的时间和精力,同时提高您的交易绩效。立即使用 DrawFib Pro 释放自动斐波那契分析的力量!
FREE

FREE

Level 2 Book Visualization Indicator Our innovative indicator seamlessly integrates Level 2 order book data onto your trading chart, offering a real-time view of market depth and the dynamics of supply and demand. With its two key features, you can enhance your market analysis and make more informed trading decisions: Biggest Volume Highlight: This input allows traders to instantly identify the price levels with the largest order lots. By highlighting the heaviest concentration of buy or sell or
FREE

MT4版本 | FAQ | EA Universal Breakout Universal Box 在圖表上繪製價格範圍,稍後可用於在價格範圍突破時進行交易。 您可以使用多種策略來應用此指標。 該指標默認設置為在圖表上標記 亞洲、歐洲和美國交易時段 範圍。 範圍繪製為矩形,其邊界是交易時段的開始和結束時間,以及該時段的最高價和最低價水平。 Telegram 聊天: @it_trader_chat 新的 Expert Advisor Prop Master - 在您的交易终端中进行测试 https://www.mql5.com/zh/market/product/115375
指標設置非常簡單。
Time Open - 交易時段開始的時間 Time Close - 交易時段結束的時間 Box color - 矩形的顏色 可以在指標中設置 4 個價格範圍。 您可以使用 On Box 參數啟用或禁用每個價格範圍的顯示。 如何在EA設置中正確設置GMT參數? 此參數定義終端時間與 GMT 時間之間的差異。 要確定終端的時間,請在您的終端中打開
FREE

** NOTE: This indicator uses realtime data. Thus DO NOT download Demo version. If you still need demo version, please refer to free version .
Symbol Chart Changer is an indicator/utility that offers you the option to switch between symbols and timeframes.
You can choose any symbol and timeframe on the same chart with just a few clicks. In addition, this indicator also shows the profit of the symbol through the color of the buttons.
Features: Click buttons on the chart to monitor all your

Setup Tabajara 是由一位被称为“华尔街的 OGRO”的巴西交易员创建的。
这种设置的想法是向交易者表明当前的价格趋势和应该在图表中寻找的操作类型。
手术 它通过将蜡烛的收盘价和 VWAP 定位到上午 10:40 和之后的 20 个周期的算术平均值来实现这一点,以 4 种可能的颜色绘制蜡烛: 绿色 -> 价格呈上升趋势(搜索购买入口点) 黑色 -> 看涨趋势中的价格修正(搜索购买切入点) 红色 -> 价格在下降趋势中下降(搜索销售切入点) 白色 -> 在下降趋势中修正价格(搜索销售切入点) 另外,我还在脚本中放入了以下指标: 8 个时期的指数平均值:识别短期价格变动 50 个周期的算术平均值:确定中期价格变动 80 个时期的指数平均值:确定中期价格变动 200 个周期的算术平均值:确定长期价格变动
如果您仍有疑问,请通过直接消息与我联系: https://www.mql5.com/zh/users/robsjunqueira/
FREE

介绍 Koala FVG for MT5 – 您的专业 Fair Value Gap (FVG) 模式指标 Koala FVG:您在 MT5 上精确交易的道路 解锁 Fair Value Gap (FVG) 模式的威力,使用 Koala FVG – 这是专为 MetaTrader 5 设计的先进指标。在有限的时间内,可以在其成为付费指标之前免费访问这个专业工具。 主要特点: FVG 模式检测: Koala FVG 智能识别基于可定制的最小和最大尺寸标准的 Qualified FVG 模式。 视觉呈现: 通过图形显示清晰度,其中包括动态矩形,用于说明 FVG 区域。三条线突出显示 FVG 水平,进行精确分析。 箭头入场信号: 永远不要错过交易机会。Koala FVG 提供清晰的箭头信号,指示入场点,让您能够做出明智的决策。 Koala FVG Scalper EA: 自动交易的卓越之选 通过下载 此处 可轻松将您的交易提升到新的水平。这款专家顾问与 Koala FVG 指标无缝集成,提供: 低回撤: 经验低于 7% 的回撤百分比,增强风险管理。 可靠的利润: 在整年内获得一贯和可靠的利润
FREE

This is MT5 version, MT4 on this link: Alert Line Pro MT4 Alert line pro allows to make alert when price cross these objects: Horizontal lines Trendline Price Zone (Rectangle) Alert when close current bar (have new bar) When the price crosses the alert lines, the software will sound an alarm and send a notification to the MetaTrader 5 mobile application. You need to settings your MetaQuotes ID of MT5 apps to MetaTrader5 software to get notification to the mobile phone. Sound files must be pl

This indicator obeys the popular maxim that: "THE TREND IS YOUR FRIEND" It paints a GREEN line for BUY and also paints a RED line for SELL. (you can change the colors). It gives alarms and alerts of all kinds. IT DOES NOT REPAINT and can be used for all currency pairs and timeframes. Yes, as easy and simple as that. Even a newbie can use it to make great and reliable trades. NB: For best results, get my other premium indicators for more powerful and reliable signals. Get them here: https://www.m
FREE

A top-quality implementation of the famous Super Trend indicator, which needs no introduction. It is completely loyal to the original algorithm, and implements many other useful features such as a multi-timeframe dashboard. [ Installation Guide | Update Guide | Troubleshooting | FAQ | All Products ] Easy to trade It implements alerts of all kinds It implements a multi-timeframe dashboard It is non-repainting and non-backpainting Input Parameters
ATR Period - This is the average true range per
FREE

This indicator plots the volume profile by Price on the chart
There are 5 ways to view it:
By Total Volume Traded; Volume Ticks(Forex) Separated by Buyers and Sellers; Buyers Only; Sellers Only and; Business balance (Buyers - Sellers).
It is possible to select how many days the profiles will be calculated.
On the current day it recalculates the histogram data for each new candlestick.
Another feature is to select the highest trading range by entering the desired percentage.
Th
FREE

BeST_Keltner Channels Strategies MT5 is an MT5 Indicator based on the original Keltner Channels Indicator and it can display in the Chart all the known Variations of Keltner Channels and also the corresponding 10 totally Strategies. Every such generally consists of a Central Moving Average Line and two Boundary Bands at a distance above and below it and can be traded mainly in a Trending Mode but also in a Ranging ReEntry Mode.
BeST_Keltner Channels Strategies Indicator Draws definite Bu

这是一个简单的VWAP指标,但我们在其中设置了提醒,以便您知道当价格触及简单VWAP或价格穿过VWAP时。 这是MetaTrader 5(MT5)的传统VWAP指标。 默认参数与常规VWAP相同,但您可以选择使用新的计算方法: 当价格触及或穿过VWAP时,您将通过提醒、手机通知、电子邮件或声音事件得知。 免费的MetaTrader 5锚定VWAP指标 。 参数: VWAP周期 VWAP基于时间周期进行计算。常规VWAP每天都以新的计算开始。然而,我留下了这个参数,让您选择一个喜欢的时间周期来计算VWAP。也就是说,您可以在M1时间框架内,查看H1的VWAP计算,该计算始终在每个新的H1条上重新启动。计算每个选择的时间周期都会重新启动。 然而,您现在不需要担心这一点,因为默认参数与常规VWAP的参数相同。只需将此VWAP指标下载并插入到您的MetaTrader 5(MT5)图表中即可。 价格类型 计算VWAP的默认价格是收盘价(Close),这是简单VWAP的标准价格。但是,您还可以选择其他价格类型进行VWAP计算,如下所示: 收盘价 开盘价 最高价 最低价 中值 典型价 加权价 Up,
FREE

check out Megaclasic Spikes Robot here: https://www.mql5.com/en/market/product/109140 https://www.mql5.com/en/market/product/109140
MEGASPIKES BOOM AND CRASH v1.32 NB: source codes of this indicator are available: PM me: https://t.me/Machofx PLEASE JOIN THE CHANNEL BELOW TO HAVE ACCESS TO ALL PREVIOUS VERSIONS check out Spikes robot
BoomCrash Cheatcode EA : https://www.mql5.com/en/market/product/103365 https://t.me/machofxprotradin g Note: PLEASE THE NEW VERSION 1.32 OF THE SPIKES
FREE

当涉及到金融市场时,"SuperTrend"这一备受欢迎的指标是一款技术分析工具,有助于识别趋势的方向以及市场可能的入场或离场点。该指标基于平均真实波幅(ATR),它根据价格范围来衡量市场的波动性。在其他平台上,它是免费提供的,这里也不例外! 该指标通常以三种方式使用: 识别当前趋势:当价格位于该线的上方时,被视为上升趋势,当价格位于下方时,被视为下降趋势。 用作止损水平。 作为动态支撑/阻力:在上升趋势中,该线位于价格下方,充当动态支撑水平。在下降趋势中,该线位于价格上方,充当动态阻力水平。 此指标的独特之处在于,它不仅可以帮助交易者确定趋势,还可以提供有效的风险管理策略。它是一个多功能工具,适用于各种市场和交易风格,从而为交易者提供了更大的灵活性和可操作性。无论是趋势追踪还是反转交易,"SuperTrend"都为交易者提供了关键的视觉指引,使他们能够更好地做出决策并取得成功。
FREE

Introducing the Order Block Indicator , the pinnacle of trading technology. Order blocks, the large cluster of buy or sell orders placed by institutional traders, significantly influence market direction. They form at critical price levels and can act as robust support and resistance zones. Our cutting-edge indicator allows you to harness the full potential of these influential market dynamics, providing a never-before-seen level of precision and customization. Here's why this tool stands apart:

Fair Value Gap (FVG) Indicator: Master the ICT Method in Forex Trading
What Traders Are Saying: " Transformed my trading approach with its precise gap spotting ..." – J. Doe " The alert feature is a lifesaver, never miss a trading opportunity.. ." – Alex P. " A crucial tool for anyone following the ICT methodologies in Forex. .." – Samantha R. Unlock the secrets of price movement in the Forex market with the revolutionary Fair Value Gap (FVG) Indicator. Designed for precision and ease of use,

This is a simple order block locator. Searched for the existence of order blocks only at extremums. If you want multi criteria order block location check my other indicator which is more powerful here These order blocks are ICT order blocks without any buttering.
The indicator can be a useful tool for detecting reversals, continuations. You can also use the indicator as confluence with your other tools
FREE

市場量概況指標。 它適用於幾乎所有工具——貨幣對、股票、期貨、實際交易量和報價。 可以設置為自動確定建立檔案的範圍,例如一周或一個月等。 並通過移動邊框(紅色和藍色兩條垂直線)手動設置範圍。 顯示為條形圖。 直方圖在給定水平上的寬度通常意味著在其上進行的交易數量。 使用“模式水平線顏色”參數,您可以設置自動顯示最重要的交易量水平,價格最有可能從中反彈,最大顏色參數單獨顯示整個指定的最大交易量水平範圍。 該指標非常簡單易用, 同時盡可能提供信息。 使用此指標,做市商將無法向您隱藏他們的買賣。 成千上萬的用戶已經下載了這個產品,沒有一個差評。 其他有用的免費和付費產品可以在這裡查看: https ://www.mql5.com/en/users/raprofit/seller
選項: 範圍 描述 範圍模式 指定範圍限制的方法:
行間——兩行之間 最後分鐘 - 最後 RangeMinutes 分鐘 Minitues to line - RangeMinutes 到右線 範圍分鐘 RangeMode 1 和 2 的分鐘數。 直方圖位置 直方圖位置:
Window left - 窗口

枢轴点斐波那契 RSJ 是一个指标,它使用斐波那契汇率追踪当天的支撑线和阻力线。
这个壮观的指标使用斐波那契汇率通过枢轴点创建多达 7 个支撑位和阻力位。 价格如何尊重该支撑和阻力的每个水平真是太棒了,在那里可以感知操作的可能进入/退出点。
特征 多达 7 个支撑位和 7 个阻力位 单独设置级别的颜色
输入 枢轴类型 Pivot Fibo RSJ1 = Fibo ratio 1 计算 Pivot Fibo RSJ2 = Fibo ratio 2 计算 Pivot Fibo RSJ3 = Fibo ratio 3 计算 Pivot Fibo Classic = 经典枢轴计算 最低枢轴级别 旋转 3 个级别 旋转 4 个级别 旋转 5 个级别 枢轴 6 个级别 旋转 7 个级别
如果您仍有疑问,请通过直接消息与我联系: https://www.mql5.com/zh/users/robsjunqueira/
FREE

The balance of supply and demand is a simple and effective market analysis method. The supply and demand diagram can show you in advance, even before the trend reversal, where the supply ends and the demand is already emerging, where the demand ends and the supply is emerging, while substantially increasing the probability of making a deal in the right direction and with a high profit factor.
Indicator signals The indicator uses the price/volume values to generate signals: ED – excess demand.
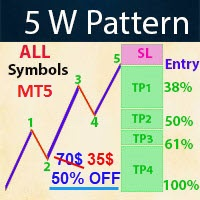
- Real price is 70$ - 50% Discount ( It is 35$ now )
Contact me for instruction, any questions! Introduction The Elliott Wave in technical analysis describes price movements in the financial market that are related to changes in trader sentiment and psychology. The 5 W Pattern (Known as 3 Drives) is an Elliott Wave pattern that is formed by 5 consecutive symmetrical moves up or down. In its bullish form, the market is making 5 drives to a bottom before an uptrend forms. In a bearish 5-d

MetaCOT 2 is a set of indicators and specialized utilities for the analysis of the U.S. Commodity Futures Trading Commission reports. Thanks to the reports issued by the Commission, it is possible to analyze the size and direction of the positions of the major market participants, which brings the long-term price prediction accuracy to a new higher-quality level, inaccessible to most traders. These indicators, related to the fundamental analysis, can also be used as an effective long-term filter
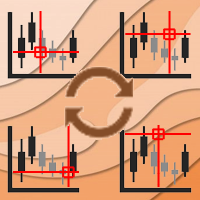
Async Charts is an indicator to synchronize charts and display a customized crosshair (cursor) on all selected charts. This is a useful utility for traders using multiple timeframes of analyzing multiple symbols for trade entry or exit.
Main Features : Real time Crosshair Synchronization on All Selected Charts
Supports Multiple Timeframes and Multiple Symbols at the same time
Auto Scroll Option
Graphical Adjustment of Color, Font, Size, ...
Locking All or Locking Specific Charts
More and
MetaTrader市场提供了一个方便,安全的购买MetaTrader平台应用程序的场所。直接从您的程序端免费下载EA交易和指标的试用版在测试策略中进行测试。
在不同模式下测试应用程序来监视性能和为您想要使用MQL5.community支付系统的产品进行付款。
您错过了交易机会:
- 免费交易应用程序
- 8,000+信号可供复制
- 探索金融市场的经济新闻
注册
登录