适用于MetaTrader 5的技术指标 - 2

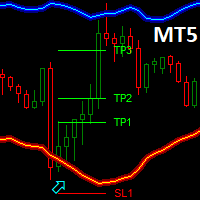
Dark Bands is an Indicator for intraday trading. This Indicator is based on Counter Trend strategy but use also Volatility. We can enter in good price with this Indicator, in order to follow the inversions on the current instrument.
Key benefits
Easily visible take profit/stop loss lines Reliable bands lines with futuristic colors, and Intuitive directional arrows Useful statistics , which indicate the win rate of the signals Plus Package available, leave a feedback to receive it for
FREE

Fractal Advanced - displays Fractal and Alligator indicators on the price chart. Has wide options for settings and customization. It is also equipped with alerts and a hotkey system. Manual (Be sure to read before purchasing) | Version for MT4 Advantages
1. The indicator does not fill the entire chart with fractals, but allows you to display only relevant signals. 2. The number of fractals is adjusted by scrolling the mouse while holding down the Shift key. 3. Instantly show/hide the Alligator

3 Indicators in 1 indicator
Strategy based on price action
Made specifically for the best forex currency pairs
Can be used in the best time frame of the market
at a very reasonable price This indicator is basically 3 different indicatos . But we have combined these 3 indicators in 1 indicator so that you can use 3 indicators at the lowest price.
All three strategies are based on price action. But based on different trends. Long term, medium term and short term
Attributes : No repaintin
YouTube Channel: https://www.youtube.com/@trenddaytrader
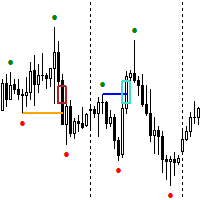
FREE EA for GOLD , ICT Kill Zone Trader can be found here: https://www.mql5.com/en/market/product/118262 The Expert Advisor for this Indicator can be found here: https://www.mql5.com/en/market/product/115476 The Break of Structure (BoS) and Change of Character indicator with Fair Value Gap (FVG) filter is a specialized tool designed to enhance trading strategies by pinpointing high-probability trading opportunities on price charts.
FREE

ADR 反轉指標一目了然地顯示當前價格相對於其正常平均每日範圍的交易位置。當價格超過您選擇的平均範圍和高於它的水平時,您將通過彈出窗口、電子郵件或推送獲得即時警報,以便您可以快速跳入回調和反轉。該指標在圖表上在平均每日範圍極值處繪製水平線,並在這些水平之上延伸,這些水平附加了價格超過它們的數學概率。下面的更多細節...... ADR 警報儀表板補充指標並監控所有配對也可在此處獲得: https://www.mql5.com/en/market/product/66316
MT4 版本也可在此處獲得: https://www.mql5.com/en/market/product/62757
大約 60% 的時間價格在其正常的平均每日範圍 (ADR) 內交易並推高這些水平通常是價格急劇波動的指標,通常會出現回調(獲利了結)走勢。您可以通過交易從每日範圍的頂部或底部回落到最近的支撐位或阻力位來利用這些急劇波動。
收集了超過 20 年的歷史數據,以找出主要外匯對和一系列交叉盤的價格超出特定 ADR 水平的平均百分比。該數據表明價格僅在 3% 的時間內超過其 ADR 的 200%,
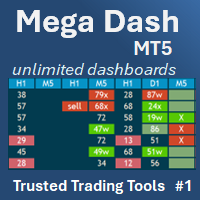
Create Unlimited Dashboards Each dashboard can be upto 28 Symbols x 24 Indicators. Mix and match from 31 leading indicators and all timeframes, to create unlimited unique dashboards. Create Group Alerts to be alerted when your chosen indicators are all aligned. 33 customizable trading strategy alerts (Trend, Breakout, Overbought, Oversold, Thresholds, Saucers etc). Scalper, Day or Long Term Trader? Mega Dash has you covered, design your unique dashboard to suit your trading style. Mega Dash is

note: this indicator is for METATRADER4, if you want the version for METATRADER5 this is the link: https://www.mql5.com/it/market/product/108106 TRENDMAESTRO ver 2.4 TRENDMAESTRO recognizes a new TREND in the bud, he never makes mistakes. The certainty of identifying a new TREND is priceless. DESCRIPTION TRENDMAESTRO identifies a new TREND in the bud, this indicator examines the volatility, volumes and momentum to identify the moment in which there is an explosion of one or more of these data a

该算法预测价格的短期变化,准确率为86%*. 当有一个大的移动由ATR确定,在超买或超卖条件,指标将提醒您。 预测价格是否会高于或低于信号蜡烛。 完美的平均回归交易,二元期权或期货合约在更大的时间框架。 该指标在5年的数据上进行了回溯测试,预测价格随时间变化的准确率为90%。
特征:
简单的设置 拖放到任何图表上 根据您的喜好调整参数(可选) 启用警报(可选) 你就完了! 视觉和音频警报 警报直接发送到您的手机 发送到终端的弹出警报 高胜率 赢得高达90%的交易 回溯测试5年和多种货币。 (请参阅网站的回测细节和分析)。 大量信号 预计每个符号每天1到2个信号*。 *这是如果你有30分钟蜡烛的指示灯。 灵活 适用于外汇,指数,商品和股票。 适用于任何时间范围 从5分钟到每天的酒吧都能很好地工作。 但是,它在更高的时间范围内更准确 很容易在图表上看到。 您可以更改信号条和信号箭头的颜色 关于我:
这个算法是由一个博士工程师,定量和活跃的交易者. 我开发了这些算法来交易我的个人资本,他们正在成功地做到这一点。 但是,我无法在一个组合中使用所有这些算法。 所以我为您提供了一个选
FREE
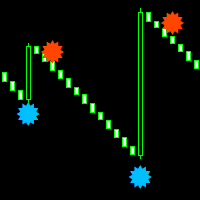
Boom and crash smasher free indicator that works on all timeframe from the one minute to the monthly timeframe. the indicator is 100% non-repaint. the indicator come with sound alerts and email push notification the indicator appears on the current candle stick for faster entries can be used on all charts and renko charts orange dot is your sell signal blue dot is your buy signal
FREE

该指标最多绘制 6 个级别,可以根据交易者的要求启用/禁用以使图表更清晰
这 6 个级别分为 2 组:高和低
对于每组,可以选择不同的时间范围
它基于先前高低反转的策略,因为它认为当价格达到每日、每周或每月高低时,价格通常会在更小的时间范围内(如 5 分钟)显示拒绝
特征 :
- 在单个图表中跟踪多达 6 个时间帧高低点
- 在这些级别设置警报,邮件、推送或终端警报,当价格触及这些级别时,您将立即收到警报
- 自定义关卡样式,包括线条样式、宽度、颜色等
- 班次:想要跟踪或研究第 2 天或第 3 天的高低?您可以将 shift 设置为 2 用于 2nd Bar 的 High Low 或 3 设置为 3rd Bar 的 High Low 等等。
该指标最多绘制 6 个级别,可以根据交易者的要求启用/禁用以使图表更清晰
这 6 个级别分为 2 组:高和低
对于每组,可以选择不同的时间范围
它基于先前高低反转的策略,因为它认为当价格达到每日、每周或每月高低时,价格通常会在更小的时间范围内(如 5 分钟)显示拒绝
特征 :
- 在单个图

Breakthrough Solution For Trend Trading And Filtering With All Important Features Built Inside One Tool! Trend PRO's smart algorithm detects the trend, filters out market noise and gives entry signals with exit levels. The new features with enhanced rules for statistical calculation improved the overall performance of this indicator.
Important Information Revealed Maximize the potential of Trend Pro, please visit www.mql5.com/en/blogs/post/713938
The Powerful Expert Advisor Version
Automa

Market Structure Patterns is an indicator based on smart money concepts that displays SMC/ICT elements that can take your trading decisions to the next level. Take advantage of the alerts , push notifications and email messages to keep informed from when an element is formed on the chart, the price crosses a level and/or enters in a box/zone. Developers can access the values of the elements of the indicator using the global variables what allows the automation of trading
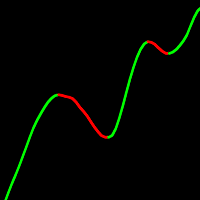
具有巨大定制选项的移动平均线。 10种平滑。 12价格选项来构建。 产生的移动离散化的可能性。 快速编码。 在专家中不受限制地使用的能力。 UniversalMA指标结合了现代交易中使用的最流行的构造方法。 因此,不再需要有许多不同的指标。 基於指標的 EA 交易 移动平均线是基于价格的滞后指标,显示工具在一段时间内的平均价格。 从本质上讲,移动平均线在试图解释图表时平滑了"噪音"。 移动平均线是评估动量以及确认趋势并确定支撑和阻力区域的好方法。 使用移动平均线的方法有很多种。 以下是最常见的使用方法的例子:移动平均线的方向(使用该方法的主要规则是跟踪移动平均线的大方向:它表示市场的主导趋势。 只有在这一运动的方向上进行交易是值得的。 这样一个简单的规则使移动平均线方法成为短期预测的方便工具),用价格图表跨越移动平均线,跟踪移动平均线的速度,几个移动平均线的组合,使用移 期设置的特征。 指标的参数可以根据用户的要求进行配置。 他可以设置一个方便的时间间隔。 它越小,移动平均线在给出信号时越敏感和准确。 尽管观点不同,但没有"正确"的时间间隔。 要设置最佳时间框架,用户必须试验一段时间。
FREE
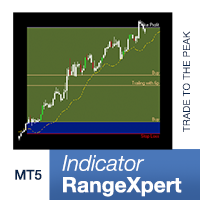
免费指标 - 无限帐户 - 单击此处查看我的所有免费产品
到那个时刻 发现市场上的完美机会 并遵循 强劲趋势 通过突破,这 RangeXpert 指标 提供宝贵的支持。该指标是我专门为 初学者和半专业人士 并提供出色的分析功能,让您准确识别市场机会并优化您的交易策略。RangeXpert 利用多个头寸优势 复杂的利润分配 即使在充满挑战的市场条件下也能表现出更高的适应性和弹性。这 算法 让您找到进入交易的理想时机,提高每个交易者的成功率 范围专家 。
高精度 AUTOTRADING 交易系统(EA)现已推出:
RangeXpert MT5 » https://www.mql5.com/de/market/product/103454
主要优点 完美的进入区 高度可见的止盈/止损线 直观的颜色、图表和方向指示器 提供所有类型的通知:弹出通知、电子邮件、推送通知和声音警报 兼容所有时间范围和所有资产 为交易者提供的一体化解决方案
建议 时间范围:M1、M5、M15 和 H1 资产:外汇、期
FREE

Auto Fibo 是一个为加强你的手动交易而开发的指标。它将自动画出黄金比例,节省你的时间,促进你的交易。 将指标附在图表上,它就会自动画出准确的黄金比例,省去你寻找临界点的麻烦。 界面会根据你的电脑调整到波段的近似高点和低点。 这个指标会纠正大多数起点和终点的选择错误。 对于每个波段,都会显示准确的价格。 警告 我只在MQL5.com上出售我的EA。如果有人与您联系,向您出售我的EA,那么他们是骗子,只想要您的钱。
另外,如果您从外部网站购买我的EA,我向您保证,它们将是假的版本,不会和原来的一样工作。 .....................................................
FREE

Contact me for instruction, any questions!
Introduction The breakout and retest strategy is traded support and resistance levels. it involves price breaking through a previous level. The break and retest strategy is designed to help traders do two main things, the first is to avoid false breakouts. Many false breakouts start with a candlestick that breaks out of a level but ends with an immediate candlestick that brings the price back into the level. The second thing that the breakout and re
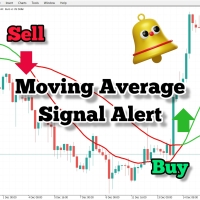
Ultimate Moving Average Crossover Alert Indicator Unlock the power of moving averages with our sophisticated crossover alert indicator, designed to enhance your trading strategy and ensure you never miss a crucial signal. Key Features Our Moving Average Crossover Alert Indicator is essential for traders who rely on moving averages. It not only identifies crossovers but also provides multiple forms of alerts to keep you informed, wherever you are. 1. Real-Time Alerts: Crossover Notifications: Re
FREE

移动平均收敛发散(MACD)交易策略是一种流行的技术分析工具,用于识别动量和趋势方向的变化。MACD的计算方法是将26期指数移动平均线(EMA)减去12期EMA。然后在MACD上方绘制一个9期EMA,称为“信号线”,以充当买入和卖出信号的触发器。 当MACD线在信号线上方时,MACD被认为处于看涨区域,在下方时处于看跌区域。交易者经常使用这些信息来确定潜在的买入和卖出机会。 MACD是一种多功能指标,可以用多种方式使用,其中一些常见的用法包括: 交叉:当MACD线穿过信号线时,出现看涨交叉;当MACD线穿过信号线下方时,出现看跌交叉。 发散:当MACD正在创造新高时,而基础证券没有创造新高时,出现看涨发散;当MACD正在创造新低时,而基础证券没有创造新低时,出现看跌发散。 趋势跟踪:当MACD在零线上方时,出现看涨趋势;当MACD在零线下方时,出现看跌趋势。 需要注意的是,MACD是一种滞后指标,应与其他技术指标和分析结合使用才能做出交易决策。
FREE

Purpose DG Trend+Signs is an indicator that paints candles with trend colors and clearly shows consolidations, using both DoGMA Trend and DoGMA Channel indicators. It was created to help users in their trades, showing trends, consolidations and marking entry and exit points. The indicator also takes consolidations in consideration to identify breakouts.
Key features Designed to be simple to use, with a few parameters Does NOT repaint Does NOT recalculate Signals on entries Works in ALL pairs W

Was: $99 Now: $34 Blahtech Daily Range indicator displays the average daily range alongside the individual session ranges. Using the daily open price as a reference the indicator shows fixed range and dynamic range targets as lines on the charts. These lines clearly show when the average range has been exhausted. Daily and session ranges can be useful for confirming entries or setting targets and is an excellent odds enhancer for many trading systems. Links [ Documentation | Install |

Golden Spikes Detector This indicator is based on an advanced strategy primarily for trading spikes on Boom and Crash Indices. Complex algorithms were implemented to detect high probability entries only. It alerts on potential Buy and Sell entries. To trade spikes on the Deriv or Binary broker, only take Buy Boom and Sell Cash alerts. It was optimised to be loaded on 5-minute timeframe although multiple timeframe analysis is done in the background. Features · Desktop pop up and sound

"Piranha" - an autonomous trading system that determines overbought and oversold levels on the chart. Red and blue zones represent overbought and oversold levels respectively. Entry points are marked with arrows: a downward arrow in the red zone for "sell" and an upward arrow in the blue zone for "buy". The Take profit level is indicated by the green moving average. Key features: Adjusting the Take profit level as the green moving average changes position. Averaging ability when a new market e

The Smart Liquidity Profile is color-coded based on the importance of the traded activity at specific price levels, allowing traders to identify significant price levels such as support and resistance levels, supply and demand zones, liquidity gaps, consolidation zones, Buy-Side/Sell-Side Liquidity and so on. Smart Liquidity Profile allows users to choose from a number of different time periods including 'Auto,' 'Fixed Range,' 'Swing High,' 'Swing Low,' 'Session,' 'Day,' 'Week,' 'Month,' 'Quart

# 33% off - limited time only # ChartSync Pro MT5 is an indicator, designed for the MetaTrader 5 trading terminals. It enables the trader to perform better multi-timeframe technical analysis, by synchronizing symbols and objects into virtually unlimited charts. Built by traders for traders! Telegram Premium Support - Dd you purchase the Chart Sync indicator and need a bit of help? Send us a screenshot with your purchase and your Telegram ID so we can add you to our premium support Telegram g

MT4 版本 | Trend Monitor VZ指標 | Owl Smart Levels 指標 | Owl Smart Levels策略 | FAQ 艾略特波浪理论是对金融市场过程的解释,它依赖于价格图表上波浪的视觉模型。 Valable ZigZag指标显示市场的波浪结构,可用于做出交易决策。 Valable ZigZag指标更稳定,不像经典的ZigZag指标那样经常改变方向,误导交易者。 这是通过在指标波的构造中使用分形来实现的. Telegram 聊天: @it_trader_chat 新的 Expert Advisor Prop Master - 在您的交易终端中进行测试 https://www.mql5.com/zh/market/product/115375
Valable ZigZag主要是一个趋势指标。 它设定了交易者应该交易的主要方向,但它也可以作为进入市场的指标。 例如。
在H4时间帧图表上安装指标,最后一波的方向将显示趋势的方向。 选择趋势交易方向后,切换到H1时间框架,并在针对所选趋势的最后一个峰值的细分处进入市场(见图2)。
FREE

40% 圣诞优惠!价格将于1月1日涨至$250!
推出GoldenGate Entries:前沿交易解决方案!
发现与GoldenGate Entries(GGE)一同进行交易的革命性方法,这是一款设计用于提升您交易体验的先进指标。GGE提供了一套全面的功能,以赋予用户在交易决策中的精准和信心。
交易对:任意(外汇 - 商品 - 股票 - 股票 - 加密货币)
时间框架:15分钟至H1
主要特点:
买入和卖出箭头指示:接收伴随弹出警报的买入和卖出箭头指示,确保您随时保持了解。
GoldenGate_Algo:通过GoldenGate_Algo深入了解市场状况,这是一款强大的工具,用于评估市场是否处于“超卖”或“超买”状态。
当前趋势分析:通过访问您正在查看的时间框架上的当前趋势,保持领先地位,使您能够将交易与市场当前方向对齐。
内置枢轴点:使用内置的枢轴点轻松识别关键市场点,提供有价值的支撑和阻力水平。
蜡烛扫描器:分析蜡烛形态和图案,找到最佳的入场点并过滤掉低概率的入场。
完全定制:通过完整的定制选项,完全掌控您的交易体验,允许您个性化从
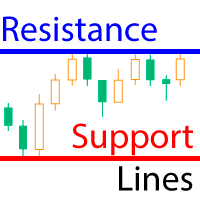
The indicator calculates fractal lines, which are technically psychological support/resistance lines. In fact, these are the highs and lows of the price over a period of time. The indicator works on all charts and timeframes. This free version of the Resistance Support Lines Pro indicator comes as is! Settings: These settings cannot be changed in this version Fractal Candels = 5 - number of candles from which a fractal is built. Calculates the maximum/minimum at which a psychological price can b
FREE

这个多时间框架和多品种指标识别双重或三重顶部/底部形态或随后的颈线突破(确认顶部/底部)。它提供 RSI、pin bar、吞没、镊子、早/晚星过滤器以及发散过滤器选项,可以仅过滤掉最强的设置。 该指标也可用于单一图表模式。请在产品的 博客 。 结合您自己的规则和技术,该指标将允许您创建(或增强)您自己的强大系统。 特征
可以同时监控您的市场报价窗口中可见的所有交易品种。将该指标仅应用于一张图表,并立即监控整个市场。 可以监控从 M1 到 MN 的每个时间范围,并在识别出第二个或第三个顶部/底部或颈线突破时向您发送实时警报。支持所有 Metatrader 原生警报类型。 可以使用 RSI,从不同的蜡烛形态和背离中进行选择,以正确识别潜在的逆转。 该指示器包括一个交互式面板。当单击一个项目时,将打开一个带有相关代码和时间范围的新图表。 该指标将信号写入文本文件,EA 交易系统 (EA) 也可以使用该文件进行自动交易。比如 这个产品 。
输入参数
输入参数的描述和解释可以在 这里 找到。 重要的 请注意,由于具有多功能性,既不会在安装指标的图表上绘制买卖建议,也不会绘制

Volume Break Oscillator is an indicator that matches price movement with volume trends in the form of an oscillator. I wanted to integrate volume analysis into my strategies but I have always been disappointed by most volume indicators, such as OBV, Money Flow Index, A/D but also as Volume Weighted Macd and many others. I therefore wrote this indicator for myself, I am satisfied with how useful it is, and therefore I decided to publish it on the market. Main features: It highlights the phases i
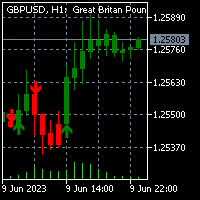
To get access to MT4 version please click here . This is the exact conversion from TradingView: "UT Bot Alerts" by "QuantNomad". This is a light-load processing and non-repaint indicator. Buffers are available for processing in EAs. You can message in private chat for further changes you need. Here is the source code of a simple Expert Advisor operating based on signals from UT Bot Alerts . #include <Trade\Trade.mqh> CTrade trade; int handle_utbot= 0 ; input group "EA Setting" input int magic_
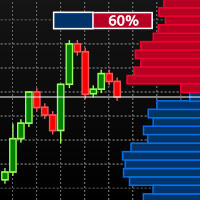
Visual Book on Chart is an indicator designed specially for stocks and futures market. To check if you can use the tool with your Broker open the MT5 Depth Of Market on your terminal and check if there are price and volume data available. Learn more about the MT5 Depth Of Market in the oficial page. The indicator shows the depth of market data on the chart window and use gradient based on the market data to colorize the histogram bars. The indicator is formed by two components: The panel, whic
FREE

Welcome to the world of SMC (Smart Money Concepts) Trading, where we empower traders with the tools and knowledge to make smarter trading decisions. Our latest addition to our suite of trading tools is the SMC Trading Pro indicator, version 1.0. Key Features: Major Market Structure Identification with BODY break. Order Block must be in Major Swing ( not Small Swing ). Order Block with Fair Value Gap Detection. Order Block in Discount | Premium zone. Filter for only Bullish, Bearish or All Order

如你在寻找一款能契合ICT交易理念的可靠指标工具,ICT Market Structure将会为您提供了一份更直观体现ICT理念的市场结构报告,帮助你成为快人一步的领先投资者 这款一体化指标专注于ICT概念(SMC概念),ICT Market Structure能帮您更容易找出机构交易的时间点并跟随其交易脚步。通过理解和利用这种策略,交易者可以获得有关市场走势的宝贵见解,并能根据价格找到更实际的进场出场时机。 以下是一些功能的简要介绍: 不重绘、不重画、不滞后的指标 显示带有成交量指标的订单块(看涨和看跌) 并提供形成警报
实时市场结构和摆动结构高低点(HH, HL, LL, LH) 并提供形成警报
结构突破(BOS), 市场结构转变 (CHoCH)/ 动量转变(MS)
破位订单块标签并提供形成警报
公允价值缺口(看涨和看跌FVG)检测 并提供形成警报
显示银弹时间
显示以下地区交易时间段:伦敦(London)、纽约(New York)、亚洲(Asia)
可以自定义所有文本和区块的颜色
相关话题标签: ICT交易,SMC交易,聪明钱,智能洞察,机构视角,流动

This is the best Support and Resistance Indicator on the market, and it shows both confirmed Support and Resistance as well as Retests. Support & Resistance: Support marks where buying demand halts price declines, acting as a safety net. Resistance caps price surges, driven by selling pressure. Traders leverage these levels to predict reversals, plan entries, exits, and manage risks, making them trading's fundamental guideposts. You can also find Premium and Discount Levels, Strong High/Low,
FREE

** All Symbols x All Timeframes scan just by pressing scanner button ** *** Contact me after the purchase to send you instructions and add you in "ABCD scanner group" for sharing or seeing experiences with other users. Introduction This indicator scans AB=CD retracement patterns in all charts. The ABCD is the basic foundation for all harmonic patterns and highly repetitive with a high success rate . The ABCD Scanner indicator is a scanner reversal ABCD pattern that helps you identify when the pr

趋势线PRO指标是一个独立的交易策略。 它显示趋势变化,交易的入口点,以及自动计算三个级别的止盈和止损保护 Trend Line PRO非常适合所有元交易者符号:货币,金属,加密货币,股票和指数 趋势线专业的优点 永远不要重绘它的信号; 将其作为独立策略的可能性; 它有三个自动水平止盈和止损水平 该指标具有iCustom信号缓冲区,允许您基于它创建交易机器人 具有通知功能 该指标已证明其在真实账户交易中的有效性
如何设置和优化趋势线PRO指标: 我有振幅参数和TP和SL水平专注于指标面板上的利润 详细说明(ENG): 这里
趋势线PRO指标如何工作: 在指示信号以向上或向下箭头的形式出现后,等待信号形成的当前蜡烛的结束 在同一方向开仓(最多可以同时开3个订单,不同级别的止盈保护) 设置指标建议的止损和止盈水平 在价格达到第一个保护级别TP1后,关闭第一个订单,并在进入价格(盈亏平衡)的水平移动止损, 将利润部分或全部固定在TP2或TP3上 使用趋势线专业的专家顾问. 金鹰,趋势线革命,趋势线EA你可以在这里找到: https://www.mql5.com/zh/users/n
FREE

Dark Oscillator is an Indicator for intraday trading. This Indicator is based on Counter Trend strategy, trying to intercept changes in direction, in advance compared trend following indicators. We can enter in good price with this Indicator, in order to follow the inversion of the trend on the current instrument. It is advised to use low spread ECN brokers. This Indicator does Not repaint and N ot lag . Recommended timeframes are M5, M15 and H1. Recommended working pairs: All. I nst

本指标的主要目的是根据 "混沌交易, 第二版" 策略,在图表里检测并标记交易信号。 带有角度的多头和空头背离柱线 (包括下蹲)。 柱线位于红色或绿色区域,是根据动量振荡器的直方条颜色。 图表上的下蹲柱线颜色独立于动量振荡器直方条。 "important" 级别的分形与鳄鱼指标的 "Teeth line" 相关。 绘制角度射线,是从平衡线至反转柱线。 第二智者和蓝光信号。 动量振荡器指标的 "区域里随后的第五根柱线" 信号。 本指标包括 新交易维度图表 指标的基本功能, 即以下: 检测并指示当直方条线穿越零轴时在图表上生成信号,以及相同方向上形成的蓝光特殊信号。 彩色柱线有三个区域 (红, 绿, 灰), 检测下蹲柱线。 为了切换 新交易维度图表 的功能, 将输入参数 Use new trading dimensions colors 设为 TRUE 值。 本指标根据 B. Williams 描述的策略专为 MetaTrader 5 开发。 图例: 蓝色柱线 - 下蹲柱线。 柱线之上的红星或绿星 - 柱线含有 "反向" 背离信号 (BDB)。 红色菱形或绿色菱形 - "第二智者" 信号。

基本 Renko 指标是交易者寻求清晰简明的市场观点的有力工具。我们的指标不仅简化了趋势可视化,还能提供准确的反转警报,为您的交易提供战略优势/ 免费 MT4 版本
功能 完全可定制: 利用高级定制选项,根据您的业务偏好定制指标。从颜色到方框大小设置,您都可以完全控制图表上的信息显示方式。 反转提醒: 利用我们的反转警报,第一时间了解市场方向的潜在变化。这样,您就可以及时做出明智的决定,最大限度地提高利润,减少损失。
输入 Size of the boxes: 方框大小(基于点数) Bullish box colour: 看涨方框颜色 Bearish box colour: 看跌方框颜色 Box opacity: 不透明度(0 到 100 之间)。透明度越低,透明度越高 Text colour: 计算每个方框中柱状图数量的数字颜色 Font size: 数字文本的大小 Max Bars: 指标进行计算的最大条数(0 表示所有可用条数) Pop-up Alert: 出现反转时提醒 MT5 终端 Email alert: 出现反转时
FREE
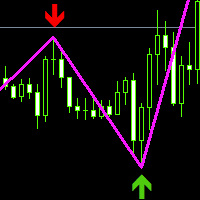
本指标是基于zigzag的二次开发,增加高点和低点箭头指示,线加粗,改颜色。可以很好的展示当前的入场买卖信号,当前做多还是做空。在实盘手工做单过程中发现比较准确,可以和其它指标组合使用,确定买卖点,有很大的参考价值。本指标自身默认自带未来函数,相对于一般的趋势指标或振荡批标,从历史数据的研判上看,准确定要高一些。 这个指标可以消除价格点的改变,分析的价值少于给出的价值.因此,之字形指标只反映明显的变化.多数情况下,我们使用之字形很容易感知到价格点的具体位置,最重要的是它能够显示其转换和改变,同时重要的是要懂得指标的最后一季可能取决于你分析数据的改变.它是特殊指标之一,当对一些交易价格改变时.前一个价值就会改变. 对于分析已经突然价格的改变,Zigzag工具的这种能力可以根据价格的改变纠正自身.
FREE

MT4 Version Available Here: https://www.mql5.com/en/market/product/43555
Telegram Channel & Group : https://t.me/bluedigitsfx
V.I.P Group Access: Send Payment Proof to our Inbox
Recommended Broker: https://eb4.app/BDFXOsprey *All In One System Indicator, Breakthrough solution for any Newbie or Expert Trader! The BlueDigitsFx Easy 123 System makes it easy to identify important areas of market structure. It alerts you to changes in market structure which typically occur when a revers

Introducing our exciting new Price Retest indicator! Get instant alerts when the price retests, giving you a powerful edge in your trading strategy. Remember to do your own analysis before making any moves in the market. MT4 Version - https://www.mql5.com/en/market/product/118031 Here’s a detailed explanation of how the Price Retest indicator works, its components, and how you can incorporate it into your trading strategy: The Price Retest indicator is designed to notify traders when the price
FREE

多货币和多时间框架 Heikin Ashi 指标。 显示了当前的市场状况。 在扫描仪面板上,您可以看到当前趋势的方向、强度和条形数量。 盘整/反转蜡烛也用颜色显示。 您可以在参数中指定任何所需的货币和期间。 此外,当趋势发生变化或出现反转和盘整蜡烛(十字星)时,指标可以发送通知。 通过单击单元格,将打开该符号和句点。 这是 MTF 扫描仪。 Heikin-Ashi 是日本的交易指标和金融图表,意思是“平均速度”。 Heikin-Ashi 图表类似于烛台图,但具有更平滑的外观,因为它们跟踪一系列价格变动,而不是像烛台那样跟踪每个价格变动。 Heikin-Ashi 由 Munehisa Homma 在 1700 年代创建,他还创建了烛台图。 交易者和投资者使用这些图表来帮助确定和预测价格变动。
参数 Averaging Method for Smoothing — 选择平滑蜡烛价格的方法。 — Simple MA — 简单 MA
— Exponential MA — 指数 MA
— Smoothed MA — 平滑 MA
— Linear weighted MA — 线性加权

这是货币权力的线性指标,具有通过平滑值进行过滤的能力。它显示所选货币的当前力量(最大数量为 8),以及历史价值。计算取决于指标启动时所选的图表时间范围。 该指标将数据显示为所有货币的线条或当前货币对的直方图。当前货币对的货币强度指数的交集在图表上额外显示为箭头。当前趋势方向由条形图的颜色突出显示。 主要设置: iPeriod - 用于分析货币力量的柱数。 HistoryBars - 历史上计算的柱数。该参数影响第一次启动期间的执行时间。如果经纪人对历史长度有限制,还需要减少必要的历史数据。 SmoothingPeriod - 数据平滑周期(要启用平滑,设置为 1)。 SmoothingMethod - 数据平滑方法。 ShowPairLabels - 在指标窗口的左侧启用/禁用带有货币名称的显示标签。 LabelsFontSize - 货币标签字体大小。 ShowRatio1-8 - 要显示的货币名称。 UsePairs - 货币权力计算的符号列表。 PairPrefix - 货币对的附加前缀。例如,在 EURUSD.e 符号中,“.e”是一个前缀。 ShowWarningCommen

ICT Silver Bullet
If you are searching for a reliable indicator to trade the ICT Silver Bullet concept, or ICT concepts, Smart Money Concepts, or SMC, this indicator will respond to your need! Before version 2.2, this indicator was focused only on ICT Silver Bullet, but moving forward, we will include the different elements for smart money concept trading. This indicator will help you identify the following: FVG - fair value gaps Market structure: BOS and CHOCH. It is based on ZIGZAG as it is
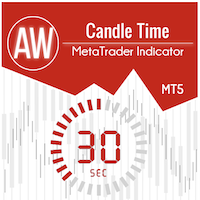
蜡烛结束前的时间指标。显示蜡烛结束前的时间,以及服务器时间。文本可以显示蜡烛的趋势或方向,内置声音通知 特点:
显示到当前蜡烛结束的时间以及其他可以根据需要调整或禁用的时间范围 AW Candle Time 可以用 AW Super Trend 指标选择当前蜡烛或趋势的方向 趋势策略以所选颜色突出显示 更换蜡烛前的内置声音通知和额外的时间着色 显示可配置在当前价格旁边或图表任意一角,在输入设置中灵活调整 Instruction -> 这里 / 更多产品 -> 这里 输入变量:
主要的 Candle_Time_Location - 蜡烛时间戳的位置。可以位于图表的角落或当前价格旁边 Trend_Strategy - 使用彩色蜡烛时间戳。可以使用 AW SuperTrend 指标在趋势方向上着色。可以根据当前蜡烛的方向着色。或者不考虑趋势策略 Show_Server_Time - 显示或隐藏服务器时间 Current_Time_Location - 选择一个位置来显示服务器时间。可以显示在图表的角落 蜡烛时间 Show_used_trend_mode_in_this_lab
FREE

多时间框架移动平均线 OSW
(元交易者 5)
该指标将允许您添加所有类型配置的移动平均线,不同之处在于,如果您处于时间范围内,则可以在更高级别添加移动平均线,举个例子,如果您处于 5 分钟时间范围内 并且想要查看 15 分钟、1 小时和 4 小时的时间性的 20 的移动平均指数,只有在指标菜单中配置正确的参数,您才能看到它们,如指标图像中所示。 多时间框架移动平均线 OSW
(元交易者 5)
该指标将允许您添加所有类型配置的移动平均线,不同之处在于,如果您处于时间范围内,则可以在更高级别添加移动平均线,举个例子,如果您处于 5 分钟时间范围内 并且想要查看 15 分钟、1 小时和 4 小时的时间性的 20 的移动平均指数,只有在指标菜单中配置正确的参数,您才能看到它们,如指标图像中所示。
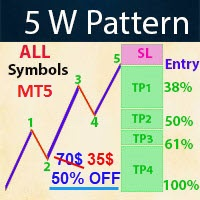
- Real price is 70$ - 50% Discount ( It is 35$ now )
Contact me for instruction, any questions! Introduction The Elliott Wave in technical analysis describes price movements in the financial market that are related to changes in trader sentiment and psychology. The 5 W Pattern (Known as 3 Drives) is an Elliott Wave pattern that is formed by 5 consecutive symmetrical moves up or down. In its bullish form, the market is making 5 drives to a bottom before an uptrend forms. In a bearish 5-d

我们创新的基本烛台形态仪表盘专为自动识别图表上的盈利烛台形态而设计。该仪表盘使用先进的算法实时扫描价格图表,并检测从经典到复杂的各种烛台形态。此外,它还有一个易于使用的界面,允许您在不同的时间框架上对检测到的形态进行可视化,从而轻松做出明智的决策/ MT4 版本
免费指标: Basic Candlestick Patterns
包括谐波形态 看涨形态 Hammer Inverse hammer Bullish engulfing Morning star 3 White soldiers 看跌形态 Hanging man Shooting star Bearish engulfing Evening star 3 Black crows
指标列 Symbol: 将显示所选符号 Pattern: 形态类型(锤子型、反向锤子型、看涨吞没型......) Bar: 自检测到该形态以来所经过的柱状图数量 Age (in minutes): 自检测到该形态以来的年龄
主要输入 Symbols : 从 "28 种主要货币对 "或 "选定符号
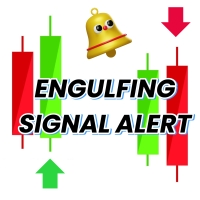
Engulfing Candle Signal Alert: Elevate Your Trading Strategy Unlock the full potential of your trading with the Engulfing Candle Signal Alert, the ultimate tool for identifying market reversals and enhancing your trading precision. Designed specifically for traders who value accuracy and timely alerts, this powerful indicator detects engulfing candle patterns, a key signal in technical analysis that often indicates a potential shift in market direction. What is an Engulfing Candle? An engu
FREE

分形指标的多货币和多时间框架修改。 显示最后两个分形 - 它们的序列(以及哪一个被破坏),或它们之间的距离。 您可以在参数中指定任何所需的货币和时间范围。 此外,该面板还可以发送有关分形突破的通知。 通过单击带有句点的单元格,将打开该符号和句点。 这是 MTF 扫描仪。
默认情况下,从图表中隐藏仪表板的键是“D”。
参数 Calculation of fractals based on — 分形搜索模式; — standart indicator — 按标准指标; — user bars — 按自定义栏的数量(可调整分形); Bars before (user calc) — 分形之前的柱数; Bars after (user calc) — 分形后的条数; Indicator mode — 显示模式 — Arrows — 分形的最后两个箭头; — Distance — 最后两个分形之间的距离; Show fractals on the chart — 在图表上显示当前分形; Clear the chart at startup — 启动时清除图表。 Set of Pa

该指标在图表上绘制趋势线。该指标有六个输入。用户可以为这两行指定替代标签。如果使用了指标的多个实例,则标签必须不同。用户可以设置线条的宽度和颜色以及深度,以指定应使用哪些显着的峰。例如,“深度= 10”使用当前的峰和谷设置趋势线,这些峰和谷在右侧和左侧至少有10条,并且高/低比峰值的高/低小/大。指标还绘制以前的高峰和低谷。指示器还具有警报功能,当价格与支撑线/阻力线相距预设距离时,可用于通知用户。警报距离以点为单位设置。.............................................................................................
FREE

这是一种基于MACD的趋势跟踪指标,当处于200 MA之上时提供买入信号,当低于200 MA时提供卖出信号。当MACD穿过零线时,将生成信号。此指标还展示了可用作止损的支撑和阻力水平。
可调整的参数包括MA周期、MACD快速EMA、慢速EMA以及支撑-阻力间隔。它绘制在最近蜡烛的最低点和最高点。
默认设置如下: SR间隔:10, MA周期:200, 快速EMA:24, 慢速EMA:26。
调整这些值可能导致信号更频繁或更少,建议进行测试以确定最有效的配置。
推荐使用1小时或4小时的时间框架,但在任何时间框架上都可能有效。该指标适用于所有交易工具,包括外汇、股票和商品等。
欢迎进一步了解其详细应用和优势。此外,它还包含报警功能。
请查看我的其他产品: https://www.mql5.com/en/users/8587359/seller
FREE

該指標的主要目的是確定交易進入和退出的時刻,因此 ExactArrow 除了顯示進入和退出市場的位置的箭頭之外不會繪製任何其他內容。
儘管該指標表面上很簡單,但其內部卻具有復雜的分析算法,系統藉助這些算法確定進入和退出的時刻。
該指標給出了當前蠟燭上出現的準確、及時的進入和退出交易信號。 該指標平均比同類指標早 1-2 個蠟燭發出信號。
使用該指標非常簡單。 當出現向上箭頭時,打開買入交易。 當出現向下箭頭時,打開賣出交易。
指標的輸入參數:
SoundAlert-啟用/禁用警報 period - 指標週期 EmailAlert - 發生警報時發送電子郵件 MobileAlert - 當信號出現時向移動終端發送消息
該指標不會重繪其值:如果箭頭出現在某個位置,則它會停留在那裡。

RSI divergence indicator finds divergences between price chart and RSI indicator and informs you with alerts (popup, mobile notification or email). Its main use is to find trend reversals in the chart. Always use the divergence indicators with other technical assets like support resistance zones, candlestick patterns and price action to have a higher possibility to find trend reversals. Three confirmation type for RSI divergences: RSI line cross 50 level Price returns to previous H/L C
FREE

A simple indicator that automatically highlights all FVGs (Fair Value Gaps) formed on the chart, as well as FVGs on history. It is possible to select colors for FVGs of different directions (long or short), select the time interval, select the color of middle point and you can also choose whether to delete filled FVGs or leave them on the chart (the option is beneficial for backtesting). The indicator can be very useful for those, who trade according to the concept of smart money, ICT, or simply
FREE

The Forex Master Pattern is an alternative form of technical analysis that provides a framework which will help you to find and follow the hidden price pattern that reveals the true intentions of financial markets. This algorithm here does a good job detecting the Phase 1 of the Forex Master Pattern cycle, which is the contraction point (or Value).
On Phase 2 we get higher timeframe activation (also called Expansion), which is where price oscillates above and below the average price defined

你想成为一个持续盈利的五星级外汇交易商吗? 1. 阅读我们简单的 交易系统 的基本描述 和 以及它在2020年的主要策略更新 2. 发送您的购买截图,以获得我们独家交易聊天的个人邀请
FX趋势 实时显示所有时间框架的趋势方向、持续时间、强度和由此产生的趋势评级。
您将一目了然地看到趋势在哪个方向运行,它们持续多长时间以及它们有多强大。
所有这些使它成为初学者、高级和专业交易者的易于使用的趋势交易系统 。
分析功能 所有时间框架的实时趋势分析 所有时间框架的计算结果完全相同 配置您个人的时间框架集 可定制的趋势计算参数 图形功能 在紧凑模式、细节模式和仪表板模式之间一键切换 紧凑模式在一个缩小的面板中提供基本的趋势信息 细节模式提供相关符号的深入趋势分析 仪表板模式涵盖了所有主要的或你最喜欢的交易符号 只需在面板内点击一下,就可以访问所有的时间框架和符号 可移动的外汇趋势显示(通过拖放)。 适用于高分辨率的QHD、UHD和4K显示器 不需要重新画图 一般特征 自动的终端配置 针对平板电脑和触摸屏的使用进行了优化 通过电子邮件、信息和手机通知发出警报 为EA请求提供可访问的缓

To get access to MT4 version please click here . This is the exact conversion from TradingView: "Supertrend" by " KivancOzbilgic ". This is a light-load processing and non-repaint indicator. You can message in private chat for further changes you need. Here is the source code of a simple Expert Advisor operating based on signals from Supertrend . #include <Trade\Trade.mqh> CTrade trade; int handle_supertrend= 0 ; input group "EA Setting" input int magic_number= 123456 ; //magic number input dou

Good day!
I present to you a trading technical indicator for Deriv broker synthetic indices. This indicator ONLY works with the following indices: Boom 300 Index Boom 500 Index Boom 1000 Index Crash 300 Index Crash 500 Index Crash 1000 Index The indicator was created to give signals to open medium-term trades in the direction of Spikes. But you can open trades in the opposite direction to Spikes, at your own risk. Trade only on M1. Other TFs do not guarantee the correct operation of the indic

首先值得强调的是,这个交易系统是一个不重绘、不重画和不滞后的指标,这使它非常适合专业交易。
在线课程,用户手册和演示。 “智能支撑和阻力交易系统”是专为新手和经验丰富的交易者量身定制的先进指标。它赋予交易者在外汇市场上精确和自信的能力。这个综合系统结合了7+种策略、10个指标和各种交易方法,包括日内交易策略、波段交易策略、支撑和阻力策略、蜡烛图模式策略、VWAP策略、多时间段趋势策略等。它提供箭头信号、入场和出场点、交易警报、更高时间框架的趋势分析、实时交易监控以及见解深刻的趋势和成交量蜡烛染色。通过自动支撑和阻力检测,这是一个多面手的指标,帮助交易者在不同的市场条件下做出明智的决策。
“智能支撑和阻力交易系统”是一个强大的技术分析方法,融合了一套高端和强大的指标和工具。在其核心,这个系统识别关键的支撑和阻力水平,这些水平作为潜在市场反转或延续的关键区域。该系统无缝集成了多时间框架趋势面板,增强了交易者在不同时间框架下评估当前趋势方向的能力。此外,蜡烛图模式检测器扫描价格图表以获取重要的蜡烛图模式,为潜在的市场走势提供宝贵的见解。此外,VWAP(成交量加权平均价格)的加入

ADR 警报仪表板一目了然地向您显示当前价格相对于其正常平均每日范围的交易位置。当价格超过您选择的平均范围和高于它的水平时,您将通过弹出窗口、电子邮件或推送获得即时警报,以便您可以快速跳入回调和反转。破折号旨在放置在空白图表上,只需坐在背景中并在达到水平时提醒您,因此您无需坐下来观看甚至看!
此处提供 MT4 版本: https://www.mql5.com/en/market/product/62756
新:现在还向您显示平均每周和每月范围,并提醒他们!
获取在您的图表上绘制水平的 ADR 反转指标: https://www.mql5.com/en/market/product/64477
大约 60% 的时间价格在其正常的平均每日范围 (ADR) 内交易并推高这些水平通常是价格急剧波动的指标,通常会出现回调(获利了结)走势。您可以通过交易从每日范围的顶部或底部回落到最近的支撑位或阻力位来利用这些急剧波动。
收集了超过 20 年的历史数据,以找出主要外汇对和一系列交叉盘的价格超出特定 ADR 水平的平均百分比。该数据表明价格仅在 3% 的时间内超过其 ADR 的
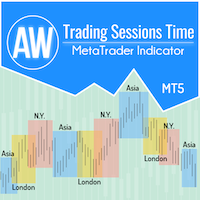
为了方便交易者获取市场表现数据并更好地制定交易策略,我们开发了交易时段指标。各个交易所的开盘时间会影响交易,因为它会影响市场活动和交易量。这些因素决定了不同工具的波动性和交易机会。 AW 交易时段指标显示亚洲、伦敦和纽约市场的交易时间。交易者可以显示或隐藏不同的时区以获得更好的体验。在图表上,您可以看到距离交易时段结束的时间,以及交易时段的大小。图表上数据的显示具有灵活的图形调整,适合不同风格的交易图表。
更多产品 -> 这里
优点:
显示亚洲、伦敦和纽约交易时段, 如果有必要,以数字显示会话大小, 开启后,显示交易时段结束的时间, 可以单独禁用交易时段, 图表上可自定义的会话边框样式 如果需要,可以在图表上显示垂直线 可以用纯色显示会话 自定义会话文本(颜色、偏移量、名称)
输入变量:
主要设置 Number_of_Days-显示指标的天数。
Show_Session_Size_in_Points - 启用后,指标将显示每个交易时段规模的数字值(以点为单位)。
Show_Time_Until_end_of_Session - 在图表的右上角显示或隐藏会话结束的时
FREE

MA3 Trend MT5 - is the good trend indicator on three MAs . Benefits of the indicator: The indicator produces signals with high accuracy.
The confirmed signal of the indicator does not disappear and is not redrawn.
You can trade on the MetaTrader 5 trading platform of any broker.
You can trade any assets (currencies, metals, cryptocurrencies, stocks, indices etc.).
You can trade on any timeframes (M5-M15 scalping and day trading / M30-H1 medium-term trading / H4-D1 long-term trading).
FREE

MT4 version | Owl Smart Levels Indicator | Owl Smart Levels策略 | FAQ
Fractals Indicator 是作者 Bill Williams 交易策略的要素之一。 它用於在價格圖表上搜索價格反轉點,從而搜索支撐位和阻力位。 Full Fractals Indicator 是改進的 Fractals,幾乎所有交易終端的工具包中都有。 唯一的區別是,為了構建分形,我們在主蠟燭的左側使用了 5 根蠟燭,在主蠟燭的右側使用了 2 根蠟燭(參見圖 1)。 除了基本構造之外,Full Fractals 還尋找價格已停止一段時間的水平。 Telegram 聊天: @it_trader_chat 新的 Expert Advisor Prop Master - 在您的交易终端中进行测试 https://www.mql5.com/zh/market/product/115375 Full Fractals Indicator 表示什麼。 分形在價格圖表上顯示為關鍵蠟燭上的向上和向下箭頭。 基於
FREE

下一代自动化供需区。适用于任何图表的创新算法。所有区域都是根据市场的价格行为动态创建的。
两种类型的警报 --> 1) 当价格触及区域时 2) 当新区域形成时
你不会再得到一个无用的指标。您将获得一个完整的交易策略和经过验证的结果。
新的功能:
价格触及供需区时发出警报
创建新的供应/需求区时发出警报
推送通知警报
以点为单位的区域宽度标签
关于 MTF 的又一个时间表。因此,现在您将能够看到高于当前 3 个时间帧,而不是高于当前 2 个时间帧
启用/禁用警报/区域/MTF 功能的按钮
您获得的优势:
消除交易中的情绪。
客观化您的交易条目。
通过高概率设置提高您的利润。
节省绘图区域的时间。
像专业人士一样交易金融市场。
任何市场的即时多时间框架分析。
你在图表上看到了什么?
蓝色和红色矩形是当前时间范围的供需区。
虚线

金融指标 SolarTrade Suite:水星市场指标 - 您在金融市场世界中的可靠指南!
这是一种移动平均线,使用特殊的创新和高级算法来计算其值,并且具有令人赏心悦目的设计。
您想自信地驾驭投资和金融市场的世界吗? SolarTrade Suite 金融指标:水星市场指标是一款创新软件,旨在帮助您做出明智的投资决策并增加您的利润。
SolarTrade Suite 金融指标:水星市场指标的优势:
准确预测:我们的指标使用先进的算法和分析技术来准确预测市场走势。获取有关买卖资产最佳时机的信号。
方便的界面:直观的界面将使您能够轻松掌握该程序并在安装后立即开始享受其好处。 您可以从设置中更改线条的颜色、粗细和样式,所有其他设置都是自动进行的。
专家支持:我们的专业团队随时准备为您解答任何问题并提供有关使用该程序的建议。
为何选择 SolarTrade Suite 财务指标:水星市场指标?
可靠性和准确性:该程序已被证明是分析金融市场的可靠且准确的工具。 增加您的资本:使用 SolarTrade Suite 财务指标:水星市场指标,您将能够做出更准确的决

我们的指标将提供一个价差筛选器来同时监控多对的价差,并且蜡烛计时器倒计时显示当前柱关闭和新柱形成之前的剩余时间。
限时优惠:我们所有的溢价指标仅售 50 美元,通过访问我们的 MQL5 博客,您将找到我们溢价指标的所有详细信息。 点击这里。
主要特征 我们的指标将提供一个价差筛选器来同时监控多对的价差,并且蜡烛计时器倒计时显示当前柱关闭和新柱形成之前的剩余时间。
监控多对同时传播。 跟踪服务器时间,而不是本地时间。 可配置的文本颜色和字体大小 优化以减少 CPU 使用率 个性化的配对列表。
接触 如果您有任何问题或需要帮助,请通过私信联系我。
警告 警告 我们所有的指标和工具只能通过官方 Metatrader 商店 (MQL5 市场) 获得。
作者 SAYADI ACHREF,金融科技软件工程师和 Finansya 创始人
FREE

The indicator draws the time scale on the chart. You can specify the time offset, adjust the size and font to display on the chart ( it is displaying your local time on your chart instead of MT time ). You can also select the desired format for displaying the date and time. You may be interested in my other product , which contains a more advanced version of the Time Scale .
Parameters Hours (time shift) — time shift (hours); Minutes (time shift) — time shift (minutes); Show time on mouse — sh
FREE
MetaTrader市场是一个简单方便的网站,在这里开发者可以出售自己的交易应用程序。
我们将帮助您发布您的产品,并向您解释如何为市场准备您的产品描述。市场上所有的应用程序都是加密保护并且只能在买家的电脑上运行。非法拷贝是不可能的。
您错过了交易机会:
- 免费交易应用程序
- 8,000+信号可供复制
- 探索金融市场的经济新闻
注册
登录