适用于MetaTrader 5的免费EA交易和指标 - 5

This indicator shows the TLH and TLL and some trendlines that allow us to estimate the trend of market. It also shows the values of the angles of the lines in percentage in points (pip) , the standard deviation, and the trend of each line, and when it breaks the lines of support and resistance (TLH and TLL). And finally, it also shows the points identified as supports and resistances through the fractal algorithm in the graph. The high and low trend lines are supported by the highs and lows, th
FREE

BeST_Oscillators Collection is a Composite MT5 Indicato r including the Chaikin , Chande and TRIX Oscillators from which by default Chaikin and TRIX Oscillators but not Chande Momentum Oscillator are contained in MT5 platform. It also provides for each Oscillator the option of displaying or not a Mov. Average as a Signal Line and the resulting Signals as Arrows in a Normal (all arrows) or in a Reverse Mode (without showing up any resulting successive and of same type arrows).
Analytically f
FREE

凯尔特纳通道突破策略: 为Metatrader 5平台开发的交易机器人旨在使用凯尔特纳通道突破策略进行自动操作。该策略涉及根据凯尔特纳通道定义的市场波动性识别入场和退出点。 主要功能: 凯尔特纳通道突破 : 该机器人识别价格突破凯尔特纳通道的时机,指示购买或销售的机会。 交易时间参数 : 可以配置机器人授权操作的特定交易时间。这允许将策略调整为不同的市场交易时段,并避免在流动性低或波动性高的时段进行交易。 每日盈利或亏损目标 : 该机器人允许设定每日盈利或亏损目标。一旦达到目标,机器人可以关闭其操作,以避免进一步暴露于市场。 平均价格系统 : 在市场逆向移动的情况下,机器人可以使用平均价格系统来改善交易的进场价格,从而减少潜在损失的影响。 移动止损 : 该机器人使用移动止损机制保护交易的利润。随着价格有利于头寸的移动,此止损将动态调整。 保本 : 达到一定利润水平后,该机器人可以将止损调整为进场价格,确保交易不会产生亏损,即使它改变了方向。 资本管理系统(索罗斯) : 该机器人可以实施基于索罗斯技术的资本管理系统,其中头寸大小根据交易账户的最近表现进行调整。 这些组合功能为机器人提供了
FREE

Lorentzian A.I Indicator System Revolutionize your trading strategy with the Lorentzian A.I Indicator System, an advanced tool designed for traders who demand precision and adaptability. Whether you're trading Crypto, Indices, Forex, or Stocks, this state-of-the-art indicator uses cutting-edge technology to keep you ahead of the market. Key Features: Advanced Lorentzian Classification (LC): Utilize sophisticated LC algorithms to generate precise buy and sell signals, ensuring you make informed
FREE

This indicator displays pivot points in the chart, including historical vales, and supports many calculation modes for Pivot Points and S/R levels. [ Installation Guide | Update Guide | Troubleshooting | FAQ | All Products ] It plots historical levels for backtesting purposes
It allows you to select the reference timeframe It implements different Pivot Point calculation modes It implements different SR calculation modes
It implements customizable colors and sizes
Calculation Modes The indi
FREE

What is MACD?
MACD is an acronym for Moving Average Convergence Divergence .
This technical indicator is a tool that’s used to identify moving averages that are indicating a new trend, whether it’s bullish or bearish.
There is a common misconception when it comes to the lines of the MACD.
There are two lines:
The " MACD Line " The " Signal Line "
The two lines that are drawn are NOT moving averages of the price.
The MACD Line is the difference (or distance) between two moving
FREE

此 Expert Advisor 可识别价格与振荡器/指标之间何时出现背离。它识别常规/经典(趋势逆转)和隐藏(趋势延续)背离。它具有 RSI、布林线、随机指标、移动平均线和 ADX 过滤器选项,可以仅过滤掉最强的设置。 特征
可以检测以下振荡器/指标的背离:MACD、OsMA(振荡器的移动平均线)、随机指标、CCI 和 RSI。可以选择所有振荡器/指标用于并发背离(同时发生)或其中任何一个用于多背离交易。也可以使用特定的振荡器/指标来交易单一背离。 可以从不同的策略中选择关闭一半的头寸。 可以启用 2 条不同周期的移动平均线作为趋势过滤器。例如,通过使用慢速 MA 200 和快速 MA 12 来隐藏背离。 传播和时间过滤器。 可以使用 ADR(平均每日范围)的百分比进行止损、止盈、追踪止损和关闭一半头寸。 输入参数 请在此处 找到输入参数的说明和解释。 重要的
请确保您首先在策略测试器中进行回溯测试。当您找到有利可图的设置后,请在模拟账户上测试 EA,并在决定是否上线之前至少进行 10 次交易。 我 很高兴提供免费产品,但鉴于我的时间有限, 我将无法提供交易建议、最佳设置、信号
FREE

Fractals Dynamic Fractals Dynamic – 是 Bill Williams 改進的免費分形指標,您可以在其中手動設定左側和右側的柱形數量,從而在圖表上建立獨特的模式。 现在所有基于或基于分形动态指标的交易策略都将有一个额外的信号。
此外,分形可以充当支撑位和阻力位。 在一些交易策略中,显示流动性水平。 为此,在这个版本的多分形和多帧指标 MultiFractal Levels 中引入了水平。 您会发现这个指标在任何价格图表上作为您交易的助手更具信息性,视觉性和实用性。 使用分形動態指標作為您交易系統的補充 也試試我在市面上的其他產品 https://www.mql5.com/ru/users/capitalplus/seller
祝您在交易中獲得豐厚的利潤!
FREE

O indicador criado por Didi Aguiar, o mestre das Agulhadas!
O padrão do indicador é o cruzamento de três médias móveis simples. Média rápida, período 3. Média normalizada, período 8. Média lenta, período 20.
Quando as três médias se cruzam próximas o suficiente, acontece a agulhada! Pela posição das médias é possível identificar: Agulhada de compra, agulhada de venda, ponto falso e beijo da mulher aranha.
Quer saber mais? Procure pelo site dos robôs oficiais da Dojistar: tradesystembots.co
FREE

ARCA bot - a full-featured, non-syndicated, automated system that uses a time-tested grid strategy adapted to modern conditions. This methodology has appeared since the inception of the financial markets and is still used by many professional traders and hedge funds, as it has shown good results for decades. The expert is fully automated and must be on 24 hours a day to work, so we recommend to use VPS-server, which will provide uninterrupted work of the expert.
Characteristics: Platform: MT
FREE

With this easy to set up indicator you can display and set alerts for the following candlestick formations: Bull Breakout, Bear Breakout, Hammer, Pin, Bullish Engulfing, Bearish Engulfing. Input parameters: ShortArrowColor: The color of the Arrows, displaying a Bearish candle formation LongArrowColor: The color of the Arrows displaying a Bullish candle formation BullishEngulfing: Disabled/Enabled/EnabledwithAlert BearishEngulfing: Disabled/Enabled/EnabledwithAlert Pin: Disabled/Enabled/Enabledw
FREE
This EA is a flexible and powerful metatrader expert advisor that trades using the MACD indicator and implements many useful features. It can trade using the MACD indicator alone, or donchian breakouts confirmed by the MACD indicator from any timeframe. Additionally, it offers a martingale feature and forex session filters. [ Installation Guide | Update Guide | Troubleshooting | FAQ | All Products ] Easy to use and supervise Fully configurable settings Customizable break-even, SL, TP and traili
FREE


Introduce: This Expert Advisor Is Hedging Style Buy or Sell Market Then Pending Buy with Hedge Distance Your Setup at begin if Sell site, Sell Pending if Buy Site. I recommend you if you want to use hedge robot please ask your broker first if they allow to use hedge trading so then you can use this robot. My default setup for XAUUSD,M15,1000usd Balance if you guys need to run with forex currency pairs just backtest seeking a best setup for each pairs because pips point are not the same each ot
FREE
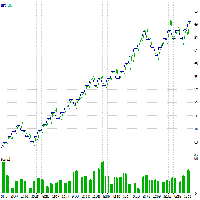
Strategy description The idea is to go with trend resumption. Instruments Backtest on XAUUSD shows profitability over a long period even without any specific optimization efforts. However applying optimization makes it even better.Backtest details: Simulation Type=Every tick(Most accurate) Expert: GoldScalper Symbol: XAUUSD Period: H1 (2020.01.01 - 2023.02.28) Inputs: magic_number=1234 ob=90.0 os=24.0 risk_percent=2.64 time_frame=16385 Company: FIBO Group, Ltd. Currency: USD Initial Deposit: 100
FREE

这种用于从无穷远衡量货币强弱的创新指标是长期交易的黄牛和交易者不可或缺的助手。 分析货币强弱的系统早已被世界领先的交易者所熟知并在市场上使用。 没有这种分析,任何套利交易都是不完整的。 我们的指标很容易确定基础货币相对于彼此的强弱。 它显示所有或当前货币对的折线图,允许即时分析和搜索最强的入口点。 该指标直观,允许您快速找到并切换到任何一对,具有可放置在地下室和主图表上的移动面板。 通知货币强度变化的计时器模式使交易者有机会在手机上收到通知。
使用货币功率计无穷大指示器的几种策略:
1. 使用货币强度的线性显示图表搜索交叉点作为新兴趋势的信号 2. 在趋势反转信号出现后,向强势货币方向反弹 3. 使用货币强度发散分析扭转当前趋势 4. 使用其他无限指标向强势货币方向交易
FREE

Custom Spread Indicator *Please write a review, thanks!
Also MT4 version is available
Spread Indicator show the current spread in pips with color codes. Handle 3 levels, Low, Medium, High. You can set levels and colors for each level (eg. Low: Green, Medium: Orange, High: Red), and can choose display position on the chart.
There is two spread calculation mode: -> Server spread value -> Ask - Bid value
Can set opacity, for better customization. When spread jump bigger, then display do
FREE

AW Super Trend - 这是最流行的经典趋势指标之一。它有一个简单的设置,让您不仅可以处理趋势,还可以显示由该指标计算的止损水平。 好处:
仪器: 货币对 、股票、商品、指数、加密货币。 时限:М15 及更高。 交易时间:全天候。 显示当前趋势的方向。 计算止损。 它可以在交易时使用。 三种类型的通知:推送、电子邮件、警报。 MT4 版本 -> 这里 / 新闻 - 这里 能力:
该指标以相应的颜色显示当前趋势方向。
- 蓝色表示当前时间范围内使用的交易品种的上升趋势。
- 该线的红色表示所选交易品种所用时间范围的下降趋势。
该指标可用于设置止损。
指标线不显示在条柱上方,而是相对于条柱有一些偏移。这个显示趋势线的地方可以被交易者用来设置止损。 当趋势发生变化时,指标线会在趋势变化的时刻重新绘制并显示为垂直线。该显示是由于该指标可用于标记止损。 可能会在较小的时间范围内过滤信号,并在较高的时间范围内显示方向。 怎么运行的:
1. 也就是说,如果您在 M15 或 M30 时间范围内工作
2. 在更高的时间框架上运行指标。 H4 或 D1。
FREE

Probability emerges to record higher prices when RVi breaks out oscillator historical resistance level. It's strongly encouraged to confirm price breakout with oscillator breakout since they have comparable effects to price breaking support and resistance levels; surely, short trades will have the same perception. As advantage, a lot of times oscillator breakout precedes price breakout as early alert to upcoming event as illustrated by last screenshot. Furthermore, divergence is confirmed in
FREE

Pin Bar Detector 是一种在图表上发现 Pin Bar 价格行为模式的指标。 Pin Bars 是“Pinocchio Bars”的快捷方式,它是一种经典的条形图案,可替代具有高上或下影线以及非常小的实体(如 Dragon Fly Doji、Grave Stone Doji、Hammer、Inverted-Hammer、Hanging Man 和 Shooting Star)的日本烛台.
限时优惠:该指标仅适用于 50 美元和终身。 (原价 125 美元)
主要特征 看涨 Pin Bar 检测器。 看跌 Pin Bar 检测器。 100% 免费指标。 使用所有时间范围。 与所有对一起工作。
接触 如果您有任何问题或需要帮助,请通过私信与我联系。
警告 我们所有的指标和工具都只能通过官方 Metatrader 商店 (MQL5 市场) 获得。
溢价指标 通过访问我们的 MQL5 配置文件,您可以找到我们所有的免费和高级指标。要访问我们的个人资料, 请单击此处。
作者 SAYADI ACHREF,金融科技软件工程师,Finansya Lab
FREE

Buy Sell Signal Low TF gives buy/sell signals and alerts with up and down arrow at potential reversal of a pullback or a trend continuation pattern in low timeframe. This is an indicator which gives signals based on trend => It works best in trend market with the principle is to ride on the trend not trade against the trend.
The components of Buy Sell Signal Low TF: - The trend is determined by SMMA 13 , SMMA 21 and SMMA 35 ( can be changed manually to suit your preference). - The signal is
FREE

介绍强大的NRTR(Nick Rypock Trailing Reverse)指标 - 这是一个必备的技术工具,用于帮助交易员识别趋势反转并设置有效的跟踪止损水平。由Nick Rypock开发,该指标采用独特的算法,可以适应不断变化的市场条件,成为任何交易者工具箱中不可或缺的一部分。
以下是交易员使用该指标的两种常见方式:
1. 趋势反转:NRTR指标在趋势即将反转时生成清晰的信号。留意指标线穿过价格图表,这是潜在趋势方向转变的信号。
2. 跟踪止损:NRTR还可作为可靠的跟踪止损工具,可在趋势市场中保护利润。当价格朝着预期方向移动时,NRTR线会动态地跟随价格,提供灵活的止损水平。
可自定义参数:通过调整指标的参数,将NRTR指标调整为适合您的交易偏好和时间框架。尝试不同的设置,找到最适合您独特交易风格的配置。为了提升交易策略,考虑将NRTR指标与其他技术指标结合使用。使用多个指标可以验证信号,并提高整体交易准确性。
总之,NRTR指标对于希望识别趋势反转并实施有效的跟踪止损的交易员来说是一个宝贵的资产。其适应性和用户友好的设计使其成为交易者中受欢迎的选择,有助
FREE

Fair Value Gap Sweep is a unique and powerful indicator that draws fair value gaps on your chart and alerts you when a gap has been swept by the price. A fair value gap is a price gap that occurs when the market opens at a different level than the previous close, creating an imbalance between buyers and sellers. A gap sweep is when the price moves back to fill the gap, indicating a change in market sentiment and a potential trading opportunity.
Fair Value Gap Sweep indicator has the following
FREE

The Expert Advisor is only designed for manual trading. The EA sets stop loss and take profit for positions and pending orders on the current symbol. It also has trailing stop and breakeven functions.
Input Parameters Stop loss - stop loss value; Take profit - take profit value; Close all if profit reached the x percent of balance or - close all positions once the total profit reaches x percent of balance; close all if profit reached the x profit amount in currency - close all position
FREE

一个专业的交易工具是RSI和价格之间的背离指标,它允许您及时收到关于趋势反转的信号或捕捉价格回调走势(取决于设置)。 指标设置允许您根据RSI峰值的角度和价格的百分比变化来调整发散的强度,这使得微调信号强度成为可能。 指标代码经过优化,并作为Ea交易的一部分进行了非常快速的测试。
指标不重绘,交易方向的箭头正好位于信号出现的位置--在柱的开口处。 Fractal True . PeriodRSI_P = 14 ; //Period IndentFrom50_P = 10.0 ; //Indent +- from 50 [0...50] LeftBars_P = 1 ; //LeftBars RightBars_P = 1 ; //RightBars IndDivForce_P = 15.0 ; //Divergences force of indicator (not for the Lite version) PriceDivForce_P = 0.01
FREE

The Expert Advisor for this Indicator can be found here: https://www.mql5.com/en/market/product/115567 The Contraction/Expansion Breakout Lines with Fair Value Gaps (FVGs) Indicator for MetaTrader 5 (MT5) is a powerful technical analysis tool designed to help traders identify and visualize breakouts at critical levels of contraction and expansion in financial markets. By incorporating Fair Value Gaps (FVGs), this indicator enhances traders' ability to gauge market sentiment and anticipate poten
FREE

this is a highly profitable semi-auto grid strategy.
MT4 Version
======== Usage======== :
Symbol: Any Main pairs Timeframe: H1 or higher Recommend Lots: 0.01 per 1000 USD
Note: Grid strategy is alwasy with some risk due to the increasely accumulated risk lots. but the high profit makes such strategy still being popular no matter how forex industry developed.
semi-auto trading should be the best way to equilibrate profit and risk. this EA has integrated many useful options for user t
FREE

欢迎使用 RSI Colored Candles,这是一个创新的指标,旨在通过将相对强弱指数(RSI)直接集成到您的价格图表中,来提升您的交易体验。与传统的 RSI 指标不同,RSI Colored Candles 使用四种颜色方案来表示 RSI 水平,直接显示在您的蜡烛图上,为您提供一目了然的有价值见解。 特点和优势: 节省空间设计: 告别杂乱的指标窗口!RSI Colored Candles 通过消除独立的 RSI 窗口的需求,节省宝贵的图表空间,为您提供更清晰和更简洁的交易体验。 超买和超卖区域的可视化表示: 在您的价格图表上轻松识别超买(由红色蜡烛表示)和超卖(由蓝色蜡烛表示)状态。这种视觉表示赋予您做出更好的交易决策并利用潜在的反转机会的能力。 增强的入场信号: 将颜色编码的蜡烛用作交易信号,蓝色蜡烛表示买入机会,红色蜡烛表示卖出机会。这种简单直接的方法简化了您的交易过程,并根据 RSI 条件提供清晰的入场点。 与供需区域的集成: 将 RSI Colored Candles 与供需分析相结合,进一步增强您的交易策略。通过在关键的供需区域识别 RSI 极端值,您可以最大程度地提
FREE

该指标显示当前交易品种的盈利(亏损)。 您可以自由拖放线条来显示当前的盈利或亏损。
参数 Calculation in money or in points — 以点数或货币计算利润/损失。 Add pending orders to calculate — 在计算中考虑挂单。 Magic Number (0 - all orders on symbol) — 幻数,如果需要评估特定订单。 Offset for first drawing (points from the average price) — 线距第一次开始时的平均价格的偏移量。 Decimal places for calculating the Sum — 显示总和的小数点后的位数。 Decimal places for calculating the Percentage — 显示百分比的小数点后的位数。
Tuning 调音 Color of the profit line — 利润线的颜色。 Color of the loss line — 损失线的颜色。 Line style — 线条样式。 L
FREE

This is an indicator for Quasimodo or Over and Under pattern. It automatically finds the swing points and can even place virtual trades with stop loss and take profit. Press the "Optimize" button to automatically find the most effective settings. The pattern consists of four legs A,B,C,D as shown in the pictures. Open and close prices of the virtual trades are Bid price but the statistics in Display Panel take current spread into account. Its parameters are explained below. Buffer - Pips dista
FREE

中央枢轴范围级别围绕中央枢轴点形成。
这些与中心枢轴相关的水平可用于确定大量的市场行为和可能的结果。
与中心枢轴的距离,以及与前一天水平相关的新水平形成的价格,可用于确定接下来几天的趋势方向和强度。
中心枢轴范围可以作为支撑和阻力,提供止损位置的指南,并提供价格持续变动/突破的信号。 群聊: https://www.mql5.com/en/users/conorstephenson 请在购买后与我联系以获取设置建议和免费的专家顾问! 主要特点 中心枢轴范围重点指标,带有额外的枢轴点和斐波那契水平。 绘制枢轴点 - R1、R2、R3、S1、S2、S3。 绘制斐波那契水平 - 0、0.23、0.38、0.50、0.61、0.78、1。 警报功能。 - 能够使用 MT4 移动应用程序在达到水平时发出通知。 可定制的线条类型、颜色和尺寸。 强烈暗示可能的市场情绪。 多功能指标。 非重绘线 - 使用前几天的固定值在每天结束时形成线。 设置从多少天开始绘制级别。 基于每日时间范围的所有级别。 建议 当中央枢轴范围连续高于之前的范围时,整体市场情绪被认为是看涨的。 当中央枢轴范围连续低
FREE

The XU_30_913073101_S_HH_CF_SQX is an algorithmic trading strategy for MetaTrader, tested on XAUUSD (Gold) using the M30 timeframe from April 1, 2004, to April 24, 2024. There is no need to set up parameters, all settings are already optimized and fine-tuned.
Recommended broker RoboForex because of EET timezone.
You can find the strategy source code for StrategyQuant at the link: http://quantmonitor.net/listing/gold-emperor/
Key details are:
Parameters
MagicNumber: 913073101
Main
FREE

INTRODUCTION : The breakout strength meter is a trading tool that is used to identify which currencies are the strongest to breakout, and which currencies are the weakest to breakout. The settings for the indicator are easy, and if you cannot find the settings, please leave a comment The tools are completely free to use Please, if you like the indicator, please leave a comment and rate the indicator in order to develop it
FREE
Rectangle position changer tool is used for precise/accurate rectangle positioning by time or price only. You can move each side of rectangle separately with lines created around selected rectangle. This tool will replace classical grid because it is like dynamical chart grid for rectangle grid. This tool allows you to adjust your rectangles, from all 4 sides, with ease and makes your technical analysis that much faster. This tool is handy when corner points for changing rectangle position a
FREE

When prices breakout resistance levels are combined with momentum oscillator breaks out its historical resistance levels then probability emerges to record farther higher prices. It's strongly encouraged to confirm price breakout with oscillator breakout since they have comparable effects to price breaking support and resistance levels; surely, short trades will have the same perception. Concept is based on find swing levels which based on number of bars by each side to confirm peak or trough
FREE

the AK CAP toolbox free to use;
it includes the same indicators we use for our daily trading and we think the simpler the better. Lightweight indicator for use on all timeframes. that includes VWAP with vwap value indicator on top right. 3 EMA: FAST, MEDIUM, SLOW the candle timer to show how much time left in a candle.
colors and positions are fully customizable.
enjoy
FREE

The RenkoChart tool presents an innovative and highly flexible approach to visualizing market data in MetaTrader 5. This expert creates a custom symbol with Renko bricks directly on the chart, displaying accurate prices at the respective opening date/time for each brick. This feature makes it possible to apply any indicator to the Renko chart. Furthermore, this tool also allows access to historical brick data through native methods in the MQL5 programming language, such as iOpen, iHigh, iLow and
FREE

Watermark Centralized
Adds a watermark centered with the asset name and chosen period.
It is possible to override the font type, font size, font color and separator character.
The watermark is positioned behind the candles, not disturbing the visualization.
It has automatic re-centering if the window is resized.
Hope this indicator helps you, good trading ;)
FREE

Descrição do Produto O produto é um Expert Advisor (EA) para MetaTrader 5, projetado para operar no par de moedas XAUUSD (Ouro) no timeframe M15. Ele utiliza uma combinação de 15 indicadores para tomar decisões de entrada e saída de trades. As principais características incluem: Lotes de entrada : 0.01 Número mágico base : 100 Máximo de posições abertas : 100 Spread máximo permitido : 0 pontos Equity mínima : 0 (sem limite) Perda máxima diária : 0 (sem limite) Parâmetros de Reentradas (Contrária
FREE

Phantom Force EA for XAUUSD M30 Chart Introducing the Phantom Force EA, a powerful and efficient trading system with a minimum RR of 1:2 with every opened position designed specifically for the XAUUSD on the M30 chart. This expert advisor employs 100 unique strategies simultaneously to identify and exploit trading opportunities, ensuring you never miss a chance to profit from the dynamic gold market. With a 1:2 RR you only need to win 33% of trades to come out breakeven giving you peace of mind
FREE

SUPERTREND; It is a trend following indicator based on the SuperTrend ATR created by Olivier Seban. It can be used to detect changes in trend direction and locate stops. When the price falls below the indicator curve, it turns red and indicates a downtrend. Conversely, when the price moves above the curve, the indicator turns green, indicating an uptrend. Like other indicators, it works well on SuperTrend when used in conjunction with other indicators such as MACD, parabolik SAR, Bollinger Band
FREE

This indicator draw a line on high and low levels of X number of days. It is possible to have an alert (in the software and mobile app) for when the price breaks the high or low of the current day. Configurações: Days - past days to calculate (1 = actual day only).
Alert when reach levels - activate the alert for specific levels or both.
Push notification - enable the alert to the mobile MT5 app.
Appearance
High - high level color.
Low - low level color.
Size actual day - thi
FREE

Supply and Demand indicator does not repaint as it counts the number of tests/retests occurred in the past x number of times. As a trader you need a path to be able to place your buy and sell trades such as: Supply and Demand, Falling & raising channels . Experienced trades will draw the key levels and channels around the timeframes. But, they will not be able to draw them on the small time frames as the price changes too frequent. This indicator is based on Shved supply and demand indicator, b
FREE

交易实用必备工具指标 波浪自动计算指标,通道趋势交易 完美的趋势-波浪自动计算通道计算 , MT4版本 完美的趋势-波浪自动计算通道计算 , MT5版本 本地跟单复制交易 Easy And Fast Copy , MT4版本 Easy And Fast Copy , MT5版本 本地跟单复制交易 模拟试用 Easy And Fast Copy , MT4 模拟账号运行 Easy And Fast Copy , MT5 模拟账号运行 MACD称为异同移动平均线,是从双指数移动平均线发展而来的 ,由快的指数移动平均线(EMA12)减去慢的指数移动平均线(EMA26)得到快线DIF,再用2×(快线DIF-DIF的9日加权移动均线DEA)得到MACD柱。MACD的意义和双移动平均线基本相同,即由快、慢均线的离散、聚合表征当前的多空状态和股价可能的发展变化趋势,但阅读起来更方便。MACD的变化代表着市场趋势的变化,不同K线级别的MACD代表当前级别周期中的 买卖趋势。
1.本指标增加MACD的双线显示, 2.并且对能量柱进行4色不同的渐变! 强烈推荐趋势指标, 波浪的标准自动计算 和
FREE

KPL Swing 指标是一个简单的趋势跟随机械交易系统,它自动化入场和出场。该系统使用硬止损和跟踪止损以退出盈利交易。没有目标,因为没有人知道价格可以移动多远(或低)。跟踪止损锁定收益并从交易中去除情绪。 由 Amibroker 指标转换,并进行了修改。 KPL Swing 指标是一个简单的趋势跟随机械交易系统,它自动化入场和出场。该系统使用硬止损和跟踪止损以退出盈利交易。没有目标,因为没有人知道价格可以移动多远(或低)。跟踪止损锁定收益并从交易中去除情绪。 由 Amibroker 指标转换,并进行了修改。 KPL Swing 指标是一个简单的趋势跟随机械交易系统,它自动化入场和出场。该系统使用硬止损和跟踪止损以退出盈利交易。没有目标,因为没有人知道价格可以移动多远(或低)。跟踪止损锁定收益并从交易中去除情绪。 由 Amibroker 指标转换,并进行了修改。 完美结合 KPL Chart Uptrend & Downtrend
FREE

"BIG FIGURE INDICATOR" automatically identifies and draws horizontal lines on price charts at specific levels, such as whole numbers or half-numbers (e.g., 1.0000 or 1.5000 in currency trading). These levels are considered psychologically significant because they represent round numbers that big traders and investors may focus on, leading to potential support or resistance levels. The big figure indicator can help traders identify important price levels and make trading decisions based on these
FREE

MT4 Version MA Ribbon MT5 MA Ribbon is an enhanced indicator with 8 moving averages of increasing periods. MA Ribbon is useful to recognize trend direction, reversals and continuation points in the market as well as potential entry, partial take profit and exit points. Entry points for long and shorts position can be found when the price entries or leaves the Ribbon, at retest or a defined number of MA crossovers. It offers a good combination with mostly any volume or momentun indicators to
FREE

BEHOLD!!!
One of the best Breakout Indicator of all time is here. Multi Breakout Pattern looks at the preceding candles and timeframes to help you recognize the breakouts in real time.
The In-built function of supply and demand can help you evaluate your take profits and Stop losses
SEE THE SCREENSHOTS TO WITNESS SOME OF THE BEST BREAKOUTS
INPUTS
MaxBarsback: The max bars to look back
Slow length 1: Period lookback
Slow length 2: Period lookback
Slow length 3: Period lo
FREE

Divergence RSI Trader is based on divergences in the chart and indicator (RSI Level 14). Divergence RSI Trader's strategy to find lows and highs on the chart and RSI indicator, analyze them and then open positions. EA was tested in the EURUSD H1 in the strategy tester and adjusted to this currency by default. EA has also been tested with other settings at GBPUSD M5 for 10 years and completed with good results. Because this is a free version, there will be no more tests and only updates. Please
FREE

Introducing Scalpie, your ultimate scalping companion in the world of trading. Designed to harness the power of Relative Strength Index (RSI), Scalpie is more than just an expert advisor; it's your strategic ally for navigating the markets with precision and confidence.
Tailored for hedged accounts, Scalpie incorporates sophisticated stop loss and take profit mechanisms to safeguard your investments while maximizing potential gains. Whether you're trading major forex pairs, minor currencies,
FREE

Indicator determines the direction of price movement, calculates the possibility of entering the market using an internal formula and displays a breakout entry signal. Indicator signals appear both at the beginning of trend movements and in the opposite direction, which allows you to open and close orders as efficiently as possible in any of the market conditions. Version for МТ4: https://www.mql5.com/en/market/product/58349
Benefits: a unique signal calculation formula; high signal accuracy;
FREE

The TrendFusion trading robot is designed to operate on the GBP/JPY currency pair. Optimized for an H4 (4-hour) trading timeframe, it offers a strategic approach for traders aiming to combine precision with adaptability in their trading. TrendFusion has demonstrated a high accuracy rate in past performance, making it a reliable choice for traders. Technical Indicators Used Bull and Bear Trend Analysis : TrendFusion analyzes both bullish and bearish trends to identify potential trading opportunit
FREE

The Hull Moving Average is not very well know in novice and maybe in intermediate trading circles, but it is a very nice solution created by the trader Alan Hull - please visit www.AlanHull.com for full details of his creation. The purpose of this moving average is to solve both problems that all famouse and common moving averages have: Lag and Choppiness . The implementation we did has, apart of the Period configuration and Price type to use in the calculations, a "velocity" factor, which could
FREE

Trading Keys is an advanced and easy to use risk calclator. Features: Drag and drop visual lines to take profit/stop loss/ entry levels. Risk calculation based on account balance / quity percentage per trade. Profit protection and trailing toggle button Auto break even toggle button Risk calculation for prop firms based on drawdown level How to setup your Trading Keys? Add trading keys to your chart Setup the parameters Save the chart as default template "Default.tpl" How to use Trading keys? Cl
FREE

Are you tired of drawing Support & Resistance levels for your Quotes? Are you learning how to spot Support & Resistances? No matter what is your case, Auto Support & Resistances will draw those levels for you! AND, it can draw them from other timeframes, right into you current chart, no matter what timeframe you are using... You can also Agglutinate regions/zones that are too much closer to each other and turning them into one single Support & Resistance Level. All configurable.
SETTINGS
Time
FREE

The " YK Find Support And Resistance " indicator is a technical analysis tool used to identify key support and resistance levels on a price chart. Its features and functions are as follows:
1. Displays support and resistance levels using arrow lines and colored bands, with resistance in red and support in green.
2. Can be adjusted to calculate and display results from a specified timeframe using the forced_tf variable. If set to 0, it will use the current timeframe of the chart.
3. Uses
FREE

CAP Moving Average EA MT5 trades using the Moving Averages Indicator. It offers many customizable Moving Averages trading scenarios and flexible position management settings, plus many useful features like customizable trading sessions, a martingale and inverse martingale mode. [ Installation Guide | Update Guide | Submit Your Problem | FAQ | All Products ]
Functions Easy to use and customizable Moving Average setting. Customizable indicator settings Built-in money management Grid
FREE

Trading has never been easier! Let's check this out! MT4 version: https://www.mql5.com/en/market/product/72153 Strategy There are some news within a day that can make the price jumps up or down very quickly and that is a good opportunity for traders to get some profits. Looking to scalp a news release? Here's how you can do it: Open two stop orders (a buy stop and a sell stop) 3 to 5 minutes before the news release. Place them about 15 to 20 pips away from the current market price. When the ne
FREE

交易实用必备工具指标 波浪自动计算指标,通道趋势交易 完美的趋势-波浪自动计算通道计算 , MT4版本 完美的趋势-波浪自动计算通道计算 , MT5版本 本地跟单复制交易 Easy And Fast Copy , MT4版本 Easy And Fast Copy , MT5版本 本地跟单复制交易 模拟试用 Easy And Fast Copy , MT4 模拟账号运行 Easy And Fast Copy , MT5 模拟账号运行 高级布林带: 1.布林中轨会随着方向变色 " 2.布林外轨扩张和收缩都会在外轨进行变色标识" 3.布林中轨计算方式可以选择任意均线,例如EMA" 4.同样可以选择任意价格应用模式进行计算" 强烈推荐趋势指标 , 波浪的标准自动计算 和 波浪的标准自动计算MT5版本 "合作QQ:556024" "合作wechat:556024" "合作email:556024@qq.com"
布林线(Bollinger Band) 是根据统计学中的标准差原理设计出来的一种非常实用的技术指标。它由 三条 轨道线组成,其中上下两条线分别可以看
FREE

For a more refined algorithm capable of detecting highs and lows everyday, opt for : Ice Scalper Pro!!! : https://www.mql5.com/en/market/product/93215 MT4 Version : https://www.mql5.com/en/market/product/94060
Check my other products here : Pivot Points Master : https://www.mql5.com/en/market/product/95744 Pivot Points Master MT4 Version : https://www.mql5.com/en/market/product/95981
Check my other products here :
Ice Scalper is a fully automated scalping robot that uses a highly ef
FREE
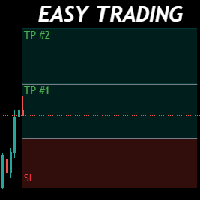
Money Management will help you to Easy Trade with One Click , instance and pending, set SL, and manage the number of your TP . You can use this expert for different currency pairs, CFDs, cryptocurrency, and stocks .
The basic formula for calculating pip value and position size , which has been used in this expert, are:
Pipette Value = Position Size * (Exchange Rate (Base Currency) / Entry Price) * Contract Size * Digits Exp. Account Currency: USD Currency Pair: GBPJPY Position
FREE

Free automatic Fibonacci is an indicator that automatically plots a Fibonacci retracement based on the number of bars you select on the BarsToScan setting in the indicator. The Fibonacci is automatically updated in real time as new highest and lowest values appears amongst the selected bars. You can select which level values to be displayed in the indicator settings. You can also select the color of the levels thus enabling the trader to be able to attach the indicator several times with differe
FREE

当趋势爆发时获得警报。 该指标在价格向主导趋势方向大幅移动时发出信号。 这些信号可以作为入口点,或添加到趋势中现有位置的点。
注意:趋势跟踪的赢率很低(低于50%),但平均赢的交易回报通常比平均输的交易大3到5倍。
简单的设置 拖放到任何图表,在任何时间框架. 启用警报(可选) 你就完了! 视觉和音频警报 警报直接发送到您的手机 弹出警报发送到您的终端 多用途 股票、外汇、期权、期货 灵活 适用于任何时间范围 注意:趋势跟踪的赢率很低(低于50%),但平均赢的交易回报通常比平均输的交易大3到5倍。 注意:趋势跟踪的赢率很低(低于50%),但平均赢的交易回报通常比平均输的交易大3到5倍。 注意:趋势跟踪的赢率很低(低于50%),但平均赢的交易回报通常比平均输的交易大3到5倍。
FREE

FREE

This is a derivative of John Carter's "TTM Squeeze" volatility indicator, as discussed in his book "Mastering the Trade" (chapter 11).
Gray dot on the midline show that the market just entered a squeeze (Bollinger Bands are with in Keltner Channel). This signifies low volatility, market preparing itself for an explosive move (up or down). Blue dot signify "Squeeze release".
Mr.Carter suggests waiting till the first blue after a gray dot, and taking a position in the direction of the mo
FREE

指标描述:MACD EMA Crossover MACD EMA Crossover 是一款功能强大的MetaTrader 5(MT5)指标,旨在根据移动平均线收敛差异(MACD)和指数移动平均线(EMA)之间的交叉生成交易信号。该指标帮助交易员识别适时的买入和卖出信号,特别关注趋势反转。 特点: MACD穿越零线(买入信号): 当MACD线穿越信号线并位于零线以下,同时价格交易在EMA(指数移动平均线)之上时,将生成强烈的买入信号。这表明可能开始上升趋势。 MACD穿越零线之上(卖出信号): 在卖出情景中,当MACD线穿越信号线并位于零线之上,而价格低于EMA水平时,该指标发出卖出信号。这表明可能发生向下的趋势反转。 使用和应用: MACD EMA Crossover 指标旨在帮助交易员识别潜在的趋势反转,使他们能够抓住市场关键点。这有助于交易员在决定开仓或平仓时做出明智的决策。 设置: MACD周期: 设置MACD计算的周期。 EMA周期: 定义指数移动平均线的周期。 信号线: 指定MACD信号线的周期。 警报: 该指标可以定制警报,及时通知交易员根据定义的标准可能存在交易机会。
FREE

The indicator displays the orders book, as well as increases its depth, remembering the location of orders that have gone beyond the current "window" view.
Indicator capability Display the levels of open positions. Simulation of placing/cancelling/editing pending orders directly in the displayed orders book.
Indicator features The orders book display works only on those trading symbols for which it is broadcast by the broker. To reset the information about the rows that were recorded in the
FREE

This is the Cumulative Volume Delta (CVD) , it's an indicator that calculates the long and short volumes plotting it then as a line on the chart, the most efficient way to use this indicator is by comparing the CVD line to the current chart and looking at the Divergence beetween the two of them, so that you can identify fake-outs and liquidty sweeps. for example in the picture that i put below you can see that the price has made a lower low but the CVD didn't, that means the volumes didn't suppo
FREE

Synthetic indeces are one of a kind of forex markets. Specially, on boom and crash indices on M1 timeframe is really interesting. I always thought that it was impossible to catch spikes safely until today. Everything has it's limits. This EA is based on martingale strategy with low drawdown. Max grid level is 3. When each trades goes on drawdown, the next trade will be multiplied by 2. The EA does not use take-profit or stoploss . So the backtesting will show the same results as real-time tradi
FREE
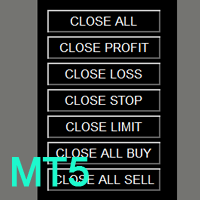
如果产品有任何问题或者您需要在此产品上添加功能,请联系我 Contact/message me if you encounter any issue using the product or need extra feature to add on the base version.
You can get the free Close Button MT4 version at LINK . Close Button provides you an intuitive, effective, and handy way to close your orders and/or positions based on their type and their profit status. The tool provides seven close options: Close All: close all pending orders and positions. Close Profit: close all positions which are in profit. Close
FREE
学习如何在MetaTrader AppStore上购买EA交易,MetaTrader平台的应用程序商店。
MQL5.community支付系统支持通过PayPay、银行卡和热门付款系统进行交易。为更好的客户体验我们强烈建议您在购买前测试EA交易。
您错过了交易机会:
- 免费交易应用程序
- 8,000+信号可供复制
- 探索金融市场的经济新闻
注册
登录