Robots comerciales e indicadores gratis para MetaTrader 5 - 5

A professional tool for trading - the divergence indicator between the RSI and the price, which allows you to receive a signal about a trend reversal in a timely manner or catch price pullback movements (depending on the settings). The indicator settings allow you to adjust the strength of the divergence due to the angle of the RSI peaks and the percentage change in price, which makes it possible to fine-tune the signal strength. The indicator code is optimized and is tested very quickly as par
FREE

This indicator displays pivot points in the chart, including historical vales, and supports many calculation modes for Pivot Points and S/R levels. [ Installation Guide | Update Guide | Troubleshooting | FAQ | All Products ] It plots historical levels for backtesting purposes
It allows you to select the reference timeframe It implements different Pivot Point calculation modes It implements different SR calculation modes
It implements customizable colors and sizes
Calculation Modes The indi
FREE

El indicador VR Donchian es una versión mejorada del canal Donchian. Las mejoras afectaron a casi todas las funciones del canal, pero se conservaron el algoritmo operativo principal y la construcción del canal. Se ha agregado un cambio en el color de los niveles al indicador de bola dependiendo de la tendencia actual; esto muestra claramente al operador un cambio en la tendencia o un nivel plano. Se ha añadido la posibilidad de informar al operador sobre la ruptura de uno de los dos niveles de c
FREE

Fractals Dynamic Fractals Dynamic – es un indicador fractal gratuito modificado por Bill Williams, en el que puede establecer manualmente el número de barras a la izquierda y a la derecha, creando así patrones únicos en el gráfico. Ahora, todas las estrategias comerciales basadas o basadas en el indicador Fractals Dynamic tendrán una señal adicional.
Además, los fractales pueden actuar como niveles de soporte y resistencia. Y en algunas estrategias comerciales para Mostrar los niveles de l
FREE

GOLD ESCAVATOR TRADING BOT A trading bot for XAUUSD. Lot size is calculated by multiplying the lot factor by each 100 USD on account. NB: These are risky strategies which give good returns over time but also pose a risk of blowing up your account. Use on your own accord. LINKS Automatic Pattern and Trendline Analyst : https://www.mql5.com/en/market/product/88794 Automatic Price Action Level Plotter: https://www.mql5.com/en/market/product/94338 MQL5 SIMPLIFIED SUMMARY; learn how to code your
FREE

Versión MT4 MA Ribbon MT5 MA Ribbon es un indicador mejorado con 8 medias móviles de períodos crecientes. MA Ribbon es útil para reconocer la dirección de la tendencia, posibles reversiones y puntos de continuación en el mercado. También indica potenciales puntos de entrada, toma de ganancias parciales y puntos de salida. El precio entrando, saliendo o retesteando el Ribbon y un número definido de cruces de MA pueden indicar posibles puntos de entrada para posiciones largas y cortas. Ofrece
FREE

Engulfing Candle Detector
Detectable pattern Double Candlestick Patterns Bullish Engulfing
The first candle is black candle. The second candle opens with a gap below the real body of the black candle but rallies upwards to close above the real body of the black candle. In other words, the second candle's real body completely engulfs the first candle's real body Bearish Engulfing
The first candle is white candle. The second candle opens with a gap above the real body of the white candle but
FREE

El indicador muestra ganancias (pérdidas) en el símbolo actual. Puede arrastrar y soltar libremente la línea para mostrar la ganancia o pérdida actual.
Parámetros Calculation in money or in points — calcula la ganancia/pérdida en puntos o en dinero. Add pending orders to calculate — tenga en cuenta las órdenes pendientes en los cálculos. Magic Number (0 - all orders on symbol) — número mágico, si es necesario evaluar órdenes específicas. Offset for first drawing (points from the average p
FREE
Overview:
Recommend Broker exness. TBH, As it is a free script, Please register using this url. So I can get some referral benefit, it motivates me and will keep continue supporting this and any future Expert Advisor.
https://one.exnesstrack.net/a/7lex5q7rkt Introducing the VWAMP Buster Expert Advisor, a sophisticated trading algorithm designed for MetaTrader 5. Harnessing the power of the Volume Weighted Average Price (VWAP), Bollinger Bands, and ATR (Average True Range), VWAMP Bus
FREE
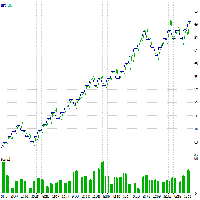
Strategy description The idea is to go with trend resumption. Instruments Backtest on XAUUSD shows profitability over a long period even without any specific optimization efforts. However applying optimization makes it even better.Backtest details: Simulation Type=Every tick(Most accurate) Expert: GoldScalper Symbol: XAUUSD Period: H1 (2020.01.01 - 2023.02.28) Inputs: magic_number=1234 ob=90.0 os=24.0 risk_percent=2.64 time_frame=16385 Company: FIBO Group, Ltd. Currency: USD Initial Deposit: 100
FREE
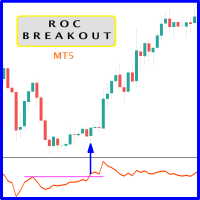
When prices breakout resistance levels are combined with Rate of Change oscillator "ROC" oscillator breaks out its historical resistance levels then probability emerges to record farther prices. It's strongly encouraged to confirm price breakout with oscillator breakout since they have comparable effects to price breaking support and resistance levels; surely, short trades will have the same perception. Concept is based on find swing levels which based on number of bars by each side to confirm
FREE

This indicator shows the TLH and TLL and some trendlines that allow us to estimate the trend of market. It also shows the values of the angles of the lines in percentage in points (pip) , the standard deviation, and the trend of each line, and when it breaks the lines of support and resistance (TLH and TLL). And finally, it also shows the points identified as supports and resistances through the fractal algorithm in the graph. The high and low trend lines are supported by the highs and lows, th
FREE
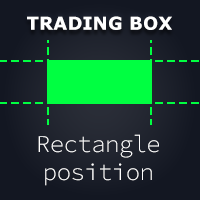
Rectangle position changer tool is used for precise/accurate rectangle positioning by time or price only. You can move each side of rectangle separately with lines created around selected rectangle. This tool will replace classical grid because it is like dynamical chart grid for rectangle grid. This tool allows you to adjust your rectangles, from all 4 sides, with ease and makes your technical analysis that much faster. This tool is handy when corner points for changing rectangle position a
FREE

This is Heiken Ashi smoothed version, where you can choose on what type smoothness you want to make your strategy base. You can choose between EMA or MA, on the period you want. And you can choose colors.
Definition:
The Heikin-Ashi technique averages price data to create a Japanese candlestick chart that filters out market noise. Heikin-Ashi charts, developed by Munehisa Homma in the 1700s, share some characteristics with standard candlestick charts but differ based on the values used to
FREE

Presentamos el poderoso indicador NRTR (Nick Rypock Trailing Reverse) - una herramienta técnica imprescindible para los traders que buscan identificar las inversiones de tendencia y establecer niveles efectivos de stop trailing. Desarrollado por Nick Rypock, este indicador cuenta con un algoritmo único que se adapta a las cambiantes condiciones del mercado, convirtiéndose en una adición invaluable para el arsenal de cualquier trader.
Aquí están las dos formas populares en las que los traders
FREE
This EA is a flexible and powerful metatrader expert advisor that trades using the MACD indicator and implements many useful features. It can trade using the MACD indicator alone, or donchian breakouts confirmed by the MACD indicator from any timeframe. Additionally, it offers a martingale feature and forex session filters. [ Installation Guide | Update Guide | Troubleshooting | FAQ | All Products ] Easy to use and supervise Fully configurable settings Customizable break-even, SL, TP and traili
FREE

Moving Average Trend Alert is a triple MA indicator that helps traders to identify potential market trends based on 3 MAs alignment and crossover.
Moving Average Trend Alert features: Customizable short-term, medium-term, and long-term MAs. Option to filter signals based on a minimum distance between moving averages to avoid premature MAs alignment. Optional Filter of signals with RSI indicator overbought/oversold levels. Optional Filter of signals with ADX indicator. Popup, email, and phone n
FREE

Lorentzian A.I Indicator System Revolutionize your trading strategy with the Lorentzian A.I Indicator System, an advanced tool designed for traders who demand precision and adaptability. Whether you're trading Crypto, Indices, Forex, or Stocks, this state-of-the-art indicator uses cutting-edge technology to keep you ahead of the market. Key Features: Advanced Lorentzian Classification (LC): Utilize sophisticated LC algorithms to generate precise buy and sell signals, ensuring you make informed
FREE

With this easy to set up indicator you can display and set alerts for the following candlestick formations: Bull Breakout, Bear Breakout, Hammer, Pin, Bullish Engulfing, Bearish Engulfing. Input parameters: ShortArrowColor: The color of the Arrows, displaying a Bearish candle formation LongArrowColor: The color of the Arrows displaying a Bullish candle formation BullishEngulfing: Disabled/Enabled/EnabledwithAlert BearishEngulfing: Disabled/Enabled/EnabledwithAlert Pin: Disabled/Enabled/Enabledw
FREE

Peak Trough Analysis is the great tool to detect peaks and troughs in your chart. Peak Trough Analysis tool can use three different peaks and troughs detection algorithm. The three algorithm include the orignal Fractals Indicator by Bill Williams, the Modified Fractals indicator and ZigZag indicator. You can use this peak and trough analysis tool to detect the price pattern made up from Equilibrium Fractal-Wave process. For further usage, there are good guide line on how to use this peak trough
FREE

Fair Value Gap Sweep is a unique and powerful indicator that draws fair value gaps on your chart and alerts you when a gap has been swept by the price. A fair value gap is a price gap that occurs when the market opens at a different level than the previous close, creating an imbalance between buyers and sellers. A gap sweep is when the price moves back to fill the gap, indicating a change in market sentiment and a potential trading opportunity.
Fair Value Gap Sweep indicator has the following
FREE

Introduce: This Expert Advisor Is Hedging Style Buy or Sell Market Then Pending Buy with Hedge Distance Your Setup at begin if Sell site, Sell Pending if Buy Site. I recommend you if you want to use hedge robot please ask your broker first if they allow to use hedge trading so then you can use this robot. My default setup for XAUUSD,M15,1000usd Balance if you guys need to run with forex currency pairs just backtest seeking a best setup for each pairs because pips point are not the same each ot
FREE

The Expert Advisor for this Indicator can be found here: https://www.mql5.com/en/market/product/115567 The Contraction/Expansion Breakout Lines with Fair Value Gaps (FVGs) Indicator for MetaTrader 5 (MT5) is a powerful technical analysis tool designed to help traders identify and visualize breakouts at critical levels of contraction and expansion in financial markets. By incorporating Fair Value Gaps (FVGs), this indicator enhances traders' ability to gauge market sentiment and anticipate poten
FREE

ARCA bot - a full-featured, non-syndicated, automated system that uses a time-tested grid strategy adapted to modern conditions. This methodology has appeared since the inception of the financial markets and is still used by many professional traders and hedge funds, as it has shown good results for decades. The expert is fully automated and must be on 24 hours a day to work, so we recommend to use VPS-server, which will provide uninterrupted work of the expert.
Characteristics: Platform: MT
FREE

Buy Sell Signal Low TF gives buy/sell signals and alerts with up and down arrow at potential reversal of a pullback or a trend continuation pattern in low timeframe. This is an indicator which gives signals based on trend => It works best in trend market with the principle is to ride on the trend not trade against the trend.
The components of Buy Sell Signal Low TF: - The trend is determined by SMMA 13 , SMMA 21 and SMMA 35 ( can be changed manually to suit your preference). - The signal is
FREE

Pin Bar Detector es un indicador que encuentra el patrón de acción del precio de Pin Bars en el gráfico. Pin Bars es un atajo para "Pinocchio Bars", que es un patrón de barra clásico alternativo a las velas japonesas con sombras superiores o inferiores altas y cuerpos muy pequeños como Dragon Fly Doji, Grave Stone Doji, Hammer, Inverted-Hammer, Hanging Man y Shooting Star. .
OFERTA POR TIEMPO LIMITADO: El indicador está disponible por solo 50 $ y de por vida. (Precio original 125$)
Caracter
FREE

Este Asesor Experto (EA) está diseñado solamente para el trading manual. El EA establece el Stop Loss y Take Profit para las posiciones y órdenes pendientes del el símbolo actual. Además, tiene las funciones del punto muerto (breakeven) y trailing stop.
Parámetros de entrada Stop Loss - Stop Loss; Take Profit - Take Profit; Close all if profit reached the x percent of balance or - cerrar todo si el beneficio total alcanza "x" por cientos del balance; close all if profit reached the x pr
FREE

El programa ChartWall sirve para mostrar y cambiar automáticamente las imágenes del fondo en el gráfico. Se soportan los formatos gráficos JPG y BMP. Hay dos modos para seleccionar el archivo de la imagen y el estilo de visualización: sea al iniciar ChartWall a través del panel estándar de los parámetros, sea a través del panel incorporado. El panel incorporado se abre si hace clic en el icono del programa que aparece en la esquina inferior izquierda del gráfico al situar el cursor sobre este á
FREE

The XU_30_913073101_S_HH_CF_SQX is an algorithmic trading strategy for MetaTrader, tested on XAUUSD (Gold) using the M30 timeframe from April 1, 2004, to April 24, 2024. There is no need to set up parameters, all settings are already optimized and fine-tuned.
Recommended broker RoboForex because of EET timezone.
You can find the strategy source code for StrategyQuant at the link: http://quantmonitor.net/listing/gold-emperor/
Key details are:
Parameters
MagicNumber: 913073101
Main
FREE

Probability emerges to record higher prices when RVi breaks out oscillator historical resistance level. It's strongly encouraged to confirm price breakout with oscillator breakout since they have comparable effects to price breaking support and resistance levels; surely, short trades will have the same perception. As advantage, a lot of times oscillator breakout precedes price breakout as early alert to upcoming event as illustrated by last screenshot. Furthermore, divergence is confirmed in
FREE

Los niveles del rango de pivote central se forman alrededor de un punto de pivote central.
Estos niveles en relación con el pivote central se pueden utilizar para determinar numerosos comportamientos del mercado y posibles resultados.
La distancia desde el pivote central, y el precio que forman los nuevos niveles en relación con los niveles del día anterior, se pueden usar para determinar la dirección y fuerza de la tendencia de los días siguientes.
Los rangos centrales de pivote pueden a
FREE

Este innovador indicador de medición de la fuerza de la moneda de INFINITY es un ayudante indispensable para los revendedores y comerciantes que negocian en el largo plazo. El sistema de Análisis de fortaleza / debilidad de las monedas ha sido conocido y utilizado en el mercado por los principales operadores del mundo. Cualquier comercio de arbitraje no está completo sin este análisis. Nuestro indicador determina fácilmente la fuerza de las monedas subyacentes entre sí. Muestra gráficos de líne
FREE

Descrição do Produto O produto é um Expert Advisor (EA) para MetaTrader 5, projetado para operar no par de moedas XAUUSD (Ouro) no timeframe M15. Ele utiliza uma combinação de 15 indicadores para tomar decisões de entrada e saída de trades. As principais características incluem: Lotes de entrada : 0.01 Número mágico base : 100 Máximo de posições abertas : 100 Spread máximo permitido : 0 pontos Equity mínima : 0 (sem limite) Perda máxima diária : 0 (sem limite) Parâmetros de Reentradas (Contrária
FREE

This is an indicator for Quasimodo or Over and Under pattern. It automatically finds the swing points and can even place virtual trades with stop loss and take profit. Press the "Optimize" button to automatically find the most effective settings. The pattern consists of four legs A,B,C,D as shown in the pictures. Open and close prices of the virtual trades are Bid price but the statistics in Display Panel take current spread into account. Its parameters are explained below. Buffer - Pips dista
FREE

this is a highly profitable semi-auto grid strategy.
MT4 Version
======== Usage======== :
Symbol: Any Main pairs Timeframe: H1 or higher Recommend Lots: 0.01 per 1000 USD
Note: Grid strategy is alwasy with some risk due to the increasely accumulated risk lots. but the high profit makes such strategy still being popular no matter how forex industry developed.
semi-auto trading should be the best way to equilibrate profit and risk. this EA has integrated many useful options for user t
FREE

When prices breakout resistance levels are combined with momentum oscillator breaks out its historical resistance levels then probability emerges to record farther higher prices. It's strongly encouraged to confirm price breakout with oscillator breakout since they have comparable effects to price breaking support and resistance levels; surely, short trades will have the same perception. Concept is based on find swing levels which based on number of bars by each side to confirm peak or trough
FREE
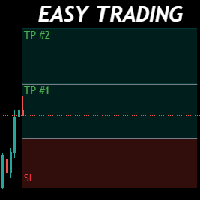
Money Management will help you to Easy Trade with One Click , instance and pending, set SL, and manage the number of your TP . You can use this expert for different currency pairs, CFDs, cryptocurrency, and stocks .
The basic formula for calculating pip value and position size , which has been used in this expert, are:
Pipette Value = Position Size * (Exchange Rate (Base Currency) / Entry Price) * Contract Size * Digits Exp. Account Currency: USD Currency Pair: GBPJPY Position
FREE

Necessary for traders: tools and indicators Waves automatically calculate indicators, channel trend trading Perfect trend-wave automatic calculation channel calculation , MT4 Perfect trend-wave automatic calculation channel calculation , MT5 Local Trading copying Easy And Fast Copy , MT4 Easy And Fast Copy , MT5 Local Trading copying For DEMO Easy And Fast Copy , MT4 DEMO Easy And Fast Copy , MT5 DEMO MACD se denomina media móvil de similitud y diferencia, que se desarrolla a partir de la media
FREE

INTRODUCTION : The breakout strength meter is a trading tool that is used to identify which currencies are the strongest to breakout, and which currencies are the weakest to breakout. The settings for the indicator are easy, and if you cannot find the settings, please leave a comment The tools are completely free to use Please, if you like the indicator, please leave a comment and rate the indicator in order to develop it
FREE

The indicator displays the orders book, as well as increases its depth, remembering the location of orders that have gone beyond the current "window" view.
Indicator capability Display the levels of open positions. Simulation of placing/cancelling/editing pending orders directly in the displayed orders book.
Indicator features The orders book display works only on those trading symbols for which it is broadcast by the broker. To reset the information about the rows that were recorded in the
FREE

Introducing Scalpie, your ultimate scalping companion in the world of trading. Designed to harness the power of Relative Strength Index (RSI), Scalpie is more than just an expert advisor; it's your strategic ally for navigating the markets with precision and confidence.
Tailored for hedged accounts, Scalpie incorporates sophisticated stop loss and take profit mechanisms to safeguard your investments while maximizing potential gains. Whether you're trading major forex pairs, minor currencies,
FREE

Necessary for traders: tools and indicators Waves automatically calculate indicators, channel trend trading Perfect trend-wave automatic calculation channel calculation , MT4 Perfect trend-wave automatic calculation channel calculation , MT5 Local Trading copying Easy And Fast Copy , MT4 Easy And Fast Copy , MT5 Local Trading copying For DEMO Easy And Fast Copy , MT4 DEMO Easy And Fast Copy , MT5 DEMO Bandas de Bollinger avanzadas:
1. El riel de Bollinger cambiará de color con la dirección "
FREE

El indicador KPL Swing es un sistema de comercio mecánico siguiendo la tendencia simple que automatiza la entrada y salida. El sistema funciona con una pérdida de parada dura y una pérdida de parada con seguimiento para salir con operaciones rentables. No se dan objetivos ya que nadie sabe hasta qué punto (o bajo) puede moverse el precio. Una pérdida de parada con seguimiento asegura las ganancias y elimina las emociones de la negociación. Convertido desde el indicador Amibroker con modificacion
FREE

TradeInfo is a utility indicator which displays the most important information of the current account and position.
Displayed information: Information about the current account (Balance, Equity, Free Margin). Current spread, current drawdown (DD), planned profit, expected losses, etc. Number of open position(s), volume (LOT), profit. Today’s and yesterday’s range. Remaining time to the next candle. Last day profit information. MagicNumber filter. Comment filter.
Indicator parameters: Show
FREE

CAP Moving Average EA MT5 trades using the Moving Averages Indicator. It offers many customizable Moving Averages trading scenarios and flexible position management settings, plus many useful features like customizable trading sessions, a martingale and inverse martingale mode. [ Installation Guide | Update Guide | Submit Your Problem | FAQ | All Products ]
Functions Easy to use and customizable Moving Average setting. Customizable indicator settings Built-in money management Grid
FREE

the AK CAP toolbox free to use;
it includes the same indicators we use for our daily trading and we think the simpler the better. Lightweight indicator for use on all timeframes. that includes VWAP with vwap value indicator on top right. 3 EMA: FAST, MEDIUM, SLOW the candle timer to show how much time left in a candle.
colors and positions are fully customizable.
enjoy
FREE

For a more refined algorithm capable of detecting highs and lows everyday, opt for : Ice Scalper Pro!!! : https://www.mql5.com/en/market/product/93215 MT4 Version : https://www.mql5.com/en/market/product/94060
Check my other products here : Pivot Points Master : https://www.mql5.com/en/market/product/95744 Pivot Points Master MT4 Version : https://www.mql5.com/en/market/product/95981
Check my other products here :
Ice Scalper is a fully automated scalping robot that uses a highly ef
FREE

Line Profit Indicador de la línea visual de beneficio en la moneda de depósito. Funciona solo si hay posiciones abiertas en el mercado para el símbolo en el que está instalado el indicador. Puede mover la línea con el mouse o habilitar el seguimiento automático del precio de oferta. Descripción de la configuración del indicador: colotLine - color de línea WidthLine - ancho de línea colotText - color del texto FontSize: la altura del texto Anchor: un método de anclaje para texto FollowBid: sigu
FREE

This indicator draw a line on high and low levels of X number of days. It is possible to have an alert (in the software and mobile app) for when the price breaks the high or low of the current day. Configurações: Days - past days to calculate (1 = actual day only).
Alert when reach levels - activate the alert for specific levels or both.
Push notification - enable the alert to the mobile MT5 app.
Appearance
High - high level color.
Low - low level color.
Size actual day - thi
FREE

Phantom Force EA for XAUUSD M30 Chart Introducing the Phantom Force EA, a powerful and efficient trading system with a minimum RR of 1:2 with every opened position designed specifically for the XAUUSD on the M30 chart. This expert advisor employs 100 unique strategies simultaneously to identify and exploit trading opportunities, ensuring you never miss a chance to profit from the dynamic gold market. With a 1:2 RR you only need to win 33% of trades to come out breakeven giving you peace of mind
FREE

Are you tired of drawing Support & Resistance levels for your Quotes? Are you learning how to spot Support & Resistances? No matter what is your case, Auto Support & Resistances will draw those levels for you! AND, it can draw them from other timeframes, right into you current chart, no matter what timeframe you are using... You can also Agglutinate regions/zones that are too much closer to each other and turning them into one single Support & Resistance Level. All configurable.
SETTINGS
Time
FREE
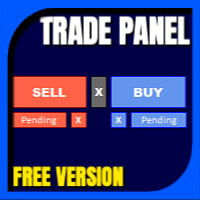
Have you missed any tools or shortcuts in Meta Trader? Simple things that would make your daily trading much easier ?
We have the solution for you: our Trade Panel!
This is an EA tool (Expert Advisor) that, if configured to controll all symbols, needs to be loaded only once.
This is the Lite version (free) of our tool. Professional version: https://www.mql5.com/en/market/product/42658 If you have some problemas with the shortcut buttons on chart on unpinned mode try change the tickets d
FREE

¡Bienvenido a RSI Colored Candles, un innovador indicador diseñado para mejorar tu experiencia de trading integrando el Índice de Fuerza Relativa (RSI) directamente en tu gráfico de precios! A diferencia de los indicadores RSI tradicionales, RSI Colored Candles utiliza un esquema de cuatro colores para representar los niveles de RSI directamente en tus velas, ¡proporcionándote valiosos insights de un vistazo! Características y Beneficios: Diseño que Ahorra Espacio: ¡Adiós a las ventanas de indic
FREE

Trading has never been easier! Let's check this out! MT4 version: https://www.mql5.com/en/market/product/72153 Strategy There are some news within a day that can make the price jumps up or down very quickly and that is a good opportunity for traders to get some profits. Looking to scalp a news release? Here's how you can do it: Open two stop orders (a buy stop and a sell stop) 3 to 5 minutes before the news release. Place them about 15 to 20 pips away from the current market price. When the ne
FREE
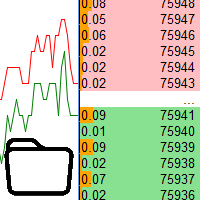
Using data from the order book in the strategy tester Key features: Simultaneous use of several symbols, up to 7 pieces DOM visualization With the visualization of order books, real-time simulation is available, as well as acceleration or deceleration Working with the library: This product also requires a utility to save data: https://www.mql5.com/en/market/product/71642 Speed control utility: https://www.mql5.com/en/market/product/81409 Include file: https://c.mql5.com/31/735/Market_book_s
FREE

A combined indicator of two famous indicators: RSI , Bollinger Bands Can be used in all currency pairs Can be used in all time frames with many signals Very simple and fast to use
Description:
This indicator is made from the combination of RSI and Bollinger Bands indicators
As you can see, it shows good signals and is worth using and testing
We hope you are satisfied with this indicator
Settings: show past show candle: Displays the number of candles that the indicator calculates.
For
FREE

El indicador "BIG FIGURE INDICATOR" identifica y dibuja automáticamente líneas horizontales en los gráficos de precios en niveles específicos, como números enteros o medios números (por ejemplo, 1.0000 o 1.5000 en el comercio de divisas). Estos niveles se consideran psicológicamente significativos porque representan números redondos en los que los grandes traders e inversores pueden centrarse, lo que lleva a posibles niveles de soporte o resistencia. El indicador de gran número puede ayudar a l
FREE

Trading Keys is an advanced and easy to use risk calclator. Features: Drag and drop visual lines to take profit/stop loss/ entry levels. Risk calculation based on account balance / quity percentage per trade. Profit protection and trailing toggle button Auto break even toggle button Risk calculation for prop firms based on drawdown level How to setup your Trading Keys? Add trading keys to your chart Setup the parameters Save the chart as default template "Default.tpl" How to use Trading keys? Cl
FREE

Marca de agua centralizada
Agrega una marca de agua centrada con el nombre del activo y el período elegido.
Es posible anular el tipo de fuente, el tamaño de fuente, el color de fuente y el carácter separador.
La marca de agua se coloca detrás de las velas, sin perturbar la visualización.
Tiene centrado automático si se cambia el tamaño de la ventana.
Espero que este indicador te ayude, buen trading ;)
FREE

Original supertrend indicator in Tradingview platform. Indicator type: Price Action indicator Introduction: The Supertrend Indicator - Enhancing Your Trend Analysis. If you haven't yet found a Supertrend indicator with good graphics on the MQL5 platform, this is the indicator for you. Overview: The Supertrend Indicator is a powerful tool designed to provide traders with valuable insights into the current and historical trends of financial markets. It serves as a valuable addition to any t
FREE

The famous brazilian trader and analyst Didi Aguiar created years ago a study with the crossing of 3 Simple Moving Averages called "Agulhada do Didi", then later was also named Didi Index, as a separate indicator. The period of those SMAs are 3, 8 and 20. As simple as that, this approach and vision bring an easy analysis of market momentum and trend reversal to those traders looking for objective (and visual) information on their charts. Of course, as always, no indicator alone could be used wit
FREE

Supply and Demand indicator does not repaint as it counts the number of tests/retests occurred in the past x number of times. As a trader you need a path to be able to place your buy and sell trades such as: Supply and Demand, Falling & raising channels . Experienced trades will draw the key levels and channels around the timeframes. But, they will not be able to draw them on the small time frames as the price changes too frequent. This indicator is based on Shved supply and demand indicator, b
FREE

BEHOLD!!!
One of the best Breakout Indicator of all time is here. Multi Breakout Pattern looks at the preceding candles and timeframes to help you recognize the breakouts in real time.
The In-built function of supply and demand can help you evaluate your take profits and Stop losses
SEE THE SCREENSHOTS TO WITNESS SOME OF THE BEST BREAKOUTS
INPUTS
MaxBarsback: The max bars to look back
Slow length 1: Period lookback
Slow length 2: Period lookback
Slow length 3: Period lo
FREE

The Hull Moving Average is not very well know in novice and maybe in intermediate trading circles, but it is a very nice solution created by the trader Alan Hull - please visit www.AlanHull.com for full details of his creation. The purpose of this moving average is to solve both problems that all famouse and common moving averages have: Lag and Choppiness . The implementation we did has, apart of the Period configuration and Price type to use in the calculations, a "velocity" factor, which could
FREE

Indicator determines the direction of price movement, calculates the possibility of entering the market using an internal formula and displays a breakout entry signal. Indicator signals appear both at the beginning of trend movements and in the opposite direction, which allows you to open and close orders as efficiently as possible in any of the market conditions. Version for МТ4: https://www.mql5.com/en/market/product/58349
Benefits: a unique signal calculation formula; high signal accuracy;
FREE

Cruce de MACD y EMA
El Cruce de MACD y EMA es un poderoso indicador de MetaTrader 5 (MT5) diseñado para generar señales de trading basadas en las intersecciones entre la Convergencia y Divergencia del Promedio Móvil (MACD) y el Promedio Móvil Exponencial (EMA). Este indicador ayuda a los traders a identificar oportunidades de compra y venta, con un enfoque específico en las inversiones de tendencia.
**Características:
1. **Cruce de MACD por debajo de la línea 0 (Señal de Compra):**
-
FREE

The TrendFusion trading robot is designed to operate on the GBP/JPY currency pair. Optimized for an H4 (4-hour) trading timeframe, it offers a strategic approach for traders aiming to combine precision with adaptability in their trading. TrendFusion has demonstrated a high accuracy rate in past performance, making it a reliable choice for traders. Technical Indicators Used Bull and Bear Trend Analysis : TrendFusion analyzes both bullish and bearish trends to identify potential trading opportunit
FREE

Recibe alertas cuando estalle una tendencia. Este indicador señala cuando el precio hace un gran movimiento en la dirección de la tendencia dominante. Estas señales pueden servir como puntos de entrada o puntos para agregar a una posición existente en una tendencia.
Nota: El seguimiento de tendencias tiene una tasa de ganancias baja (menos del 50 por ciento), pero el rendimiento de la operación ganadora promedio suele ser de 3 a 5 veces mayor que la operación perdedora promedio.
Configurac
FREE
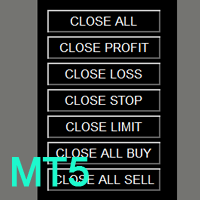
如果产品有任何问题或者您需要在此产品上添加功能,请联系我 Contact/message me if you encounter any issue using the product or need extra feature to add on the base version.
You can get the free Close Button MT4 version at LINK . Close Button provides you an intuitive, effective, and handy way to close your orders and/or positions based on their type and their profit status. The tool provides seven close options: Close All: close all pending orders and positions. Close Profit: close all positions which are in profit. Close
FREE

This is the Cumulative Volume Delta (CVD) , it's an indicator that calculates the long and short volumes plotting it then as a line on the chart, the most efficient way to use this indicator is by comparing the CVD line to the current chart and looking at the Divergence beetween the two of them, so that you can identify fake-outs and liquidty sweeps. for example in the picture that i put below you can see that the price has made a lower low but the CVD didn't, that means the volumes didn't suppo
FREE
MetaTrader Market - robots comerciales e indicadores técnicos para los trádres, disponibles directamente en el terminal.
El sistema de pago MQL5.community ha sido desarrollado para los Servicios de la plataforma MetaTrader y está disponible automáticamente para todos los usuarios registrados en el sitio web MQL5.com. Puede depositar y retirar el dinero a través de WebMoney, PayPal y tarjetas bancarias.
Está perdiendo oportunidades comerciales:
- Aplicaciones de trading gratuitas
- 8 000+ señales para copiar
- Noticias económicas para analizar los mercados financieros
Registro
Entrada
Si no tiene cuenta de usuario, regístrese
Para iniciar sesión y usar el sitio web MQL5.com es necesario permitir el uso de Сookies.
Por favor, active este ajuste en su navegador, de lo contrario, no podrá iniciar sesión.