适用于MetaTrader 4的EA交易和指标 - 301
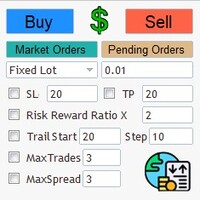
Simple and Easy MT4 Trade Panel by Winidecorw I created this EA to make your life easier by making it easier and faster to open your trades. The price will increase progressively, take advantage now! Simplify Your Trading with the Simple and Easy MT4 Trade Panel Are you tired of wasting time setting up each trade in MetaTrader 4? With the simple and easy MT4 trading dashboard, taking your trading to the next level has never been so quick and easy!
This Trade Assistant dashboard is the Simple an
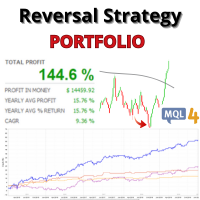
Low-Risk Portfolio – Expert Advisor Reversal Strategy This fully automated strategy is specifically designed to identify buying opportunities in AUDJPY , AUDUSD , and AUDCAD pairs. It focuses on capturing significant price movements away from the moving average, optimizing entries through advanced technical analysis and strict risk management. Key Features Mean Reversion Approach: Detects significant price deviations from the moving average, using Bollinger Bands to pinpoint extreme movements an

Main Features Trades at Every Bar Open This EA identifies precise opportunities in the market with every new bar, ensuring you're always one step ahead of price movements. Trend Anticipation Thanks to advanced pattern analysis, this EA strategically positions itself to capture early directional moves, allowing you to benefit from trends right from the start. Integrated Daily Target Set a daily profit target and let the EA do the heavy lifting. Once the target is reached, trading stops, securin

The Market Strength Indicator (MSI) is yet another in our stable of volume-based indicators, and as such, is a must-have tool for trading virtually any type of market and across a myriad of applications from trend trading to swing trading, scalping, and much more. While its sister indicator, the Currency Strength Indicator (CSI), helps you analyze which currencies are oversold, overbought, correlating, and trending, the MSI or Market Strength Indicator does this also, but in this case, for all m

The VRSI indicator is another in the suite of volume indicators we have developed and one that complements our volume price analysis methodology perfectly. and was developed out of a desire to build further on our cornerstone of VPA by peeling back the layers of volume and considering the relative aspect of volume. Hence, the acronym of Volume Relative Strength Index indicator encapsulates what the indicator is all about. By analyzing relative volume, we are able to see a visual representation o

The VWAP indicator is another of our suite of volume indicators and one which was first referred to in 1988 when it appeared in an article entitled “The Total Cost Of Transactions On The NYSE” in the March edition of the Journal Of Finance from that year, which went on to explain its importance, particularly from an institutional perspective, which underpins its significance in appreciating the power and importance of this indicator. In many ways, it is akin to the volume price analysis methodol

FusionBot : FusionBot is an advanced Forex trading algorithm designed for the EUR/USD 15-minute chart, combining the power of Fair Value Gaps (FVG), MACD, and Moving Averages. It identifies key market trends, momentum shifts, and price imbalances to execute high-probability trades. By leveraging these tools, FusionBot adapts dynamically to market conditions, ensuring precise entry and exit points while maintaining a focus on consistent, reliable performance. Perfect for traders seeking an autom

GFX Gold Scalper MT4 is a sophisticated Expert Advisor (EA) expertly crafted for trading gold, particularly the XAUUSD pair, renowned for its volatility. This automated system is designed to seize profitable scalping opportunities using an advanced trading methodology. By employing cross-market analysis, it pinpoint optimal entry points while prioritizing safety. The EA utilizes a single-order strategy with a strict stop-loss on every trade, avoiding high-risk tactics to ensure a secure and cont

自信交易者是一种先进的自动化交易系统,精心设计用于多货币动态,并完全适应您的需求。利用先进的技术分析,机器人评估历史和实时数据,以识别潜在趋势、关键支撑和阻力位以及其他相关的市场信号。 该机器人每天从周一到周五开仓,所有仓位都通过止盈、止损和各种其他配置进行保护,以适应您的偏好,无论是更激进还是更保守。还包括一个恢复系统。 为了简化启动机器人的过程,所有功能都设置为默认值;我们提供经过测试的设置,如果您发送私信给我们,我们会与您分享。 特点 兼容所有经纪商 热门资产:多货币/股票/指数/金属 机器人每日开仓 由熟练程序员开发的经过测试的产品 快速安装:只需点击几下,EA即可独立运行 所有仓位都由自动止盈、止损保护 根据客户和团队的建议持续开发项目,所有更新均免费提供 信息面板显示每日点数、当前市场会话等 参数: 手数:手数大小 止盈:默认设置,无需调整 止损:默认设置,无需调整 如何开始: 购买EA后,请发送私人消息,附上您的购买确认截图(来自“购买”标签)。确认后,您将获得由开发人员配置的独家设置。 在您的平台上启用自动交易,将EA添加到您首选资产的M15图表,加载我们的设置,设置手

The Fibonacci Confluence Toolkit is a technical analysis tool designed to help traders identify potential price reversal zones by combining key market signals and patterns. It highlights areas of interest where significant price action or reactions are anticipated, automatically applies Fibonacci retracement levels to outline potential pullback zones, and detects engulfing candle patterns. Its unique strength lies in its reliance solely on price patterns, eliminating the need for user-define
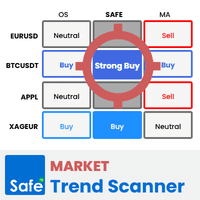
Market Trend Scanner is a trend analyzer or trend screener indicator that helps you know the trend in selected timeframe of all symbols you're watching .
This indicator provides clear & detailed analysis results on a beautiful dashboard, let you able to use this result right away without need to do any additional analysis. How it works
Step 1: Calculate values of 23 selected & trusted technical indicators (Oscillator & Moving Average indicators)
Step 2: Analyze all indicators using best pr

Chart Refresher EA is a simple yet powerful tool for many traders struggling with repainting EAs and indicators. These tools often recalculate and change their visualized graphics upon chart refresh or timeframe switching, leading to misleading trading signals. The Chart Refresher EA is designed to periodically switch between chart timeframes in the blink of an eye, ensuring that all attached indicators and EA graphics remain currently fresh and recalculated. This allows the trading tools to fu

Unlock Precision with ATR Bands Expansion Indicator The ATR Bands Expansion Indicator is your gateway to identifying dynamic price movements and breakout opportunities in the financial markets. Designed to enhance your trading strategy, this tool uses Average True Range (ATR) principles to create adaptive bands that expand and contract based on market volatility. Key Highlights: Not Optimized: This indicator is designed for you to optimize according to your trading preferences and market condit

Unlock the Power of Trend Dynamics with ATR Bands Midline Trend Indicator! The ATR Bands Midline Trend Indicator is a meticulously crafted tool designed to help traders identify trends with precision using the Average True Range (ATR) as a foundation. This indicator focuses on calculating a midline derived from ATR bands, providing a unique perspective for traders to detect trend direction and strength effectively. Important: This indicator is not optimized, leaving the door open for you to tai

Unlock Your Trading Potential with the ATR Bands Touch Indicator! The ATR Bands Touch Indicator is a dynamic tool designed to identify key price interactions with the Average True Range (ATR) Bands. Built to assist traders in spotting significant touchpoints where price momentum aligns with volatility boundaries, this indicator provides a strategic edge in identifying potential trend shifts or breakout zones. Key Features and Logic Behind the Indicator: Core Strategy: The ATR Bands are calculat

Unoptimized and Designed for You to Customize The Mercury Track Indicator is a powerful trading tool created with flexibility in mind, allowing you to tailor it to your trading strategies and market conditions. Out of the box, it provides insightful signals, but it’s meant for traders to optimize and enhance according to their unique preferences and trading styles. Logic Behind the Strategy
At its core, the Mercury Track Indicator employs a combination of signal generation and dynamic band plot

This universal Expert Advisor is based on its own Algorithm, which is an incredibly effective tool due to the simultaneous operation of a trading strategy based on our RoyalFractals Indicator, which you will find on the market for free download. The advisor's algorithm is based on a deep understanding of technical analysis and personal experience in exchange trading, has passed the test of time, therefore it guarantees accurate signals and well-thought-out decisions. Traders are also given th

Take control of your trading decisions with the 'Visual Venus Guard Indicator'! This advanced indicator offers a versatile framework designed to assist you in identifying potential market turning points. Created with a focus on customization, it empowers YOU to optimize it according to your unique trading strategy. The Strategy Behind the 'Visual Venus Guard Indicator'
The 'Visual Venus Guard Indicator' uses a comprehensive algorithm to identify critical price zones and reversal patterns, provi

Visual Envelope Indicator is designed for traders who want a clear visual representation of market trends, potential reversals, and price dynamics within defined envelope boundaries. This indicator simplifies market analysis, offering a unique perspective for crafting your trading strategy. Please note that this indicator is not optimized—it's intentionally built for you to optimize it according to your trading style and goals. Strategy and logic behind the indicator
The Visual Envelope Indicat

Visual Envelope Price Cross Indicator Unlock the power of price envelope dynamics with the Envelope Price Cross Indicator. This tool is designed to identify potential trade opportunities by analyzing price movements relative to the envelope bands. It is a valuable addition to your trading arsenal, providing insights into trend continuations, reversals, and market momentum. Important: This indicator is not optimized. It is created for you to optimize and fine-tune to match your trading strategy.

Optimize Your Strategy with the Envelope Support Bounce Indicator! The Visual Envelope Support Bounce Indicator is designed as a tool for traders who want to unlock the potential of envelope-based strategies in their trading. This indicator is not pre-optimized, allowing you to fully customize and optimize it to suit your trading style and preferences. Whether you're a scalper, day trader, or swing trader, the flexibility of this tool makes it an invaluable addition to your arsenal. What does i

Welcome to the Visual Envelope Trend Flow Indicator! This tool is not optimized and has been crafted specifically for you to explore, test, and fine-tune according to your unique trading strategy. It offers flexibility and a powerful starting point for traders aiming to master trend identification and price flow dynamics. The Visual Envelope Trend Flow Indicator leverages the concept of envelope channels, which are dynamic boundaries drawn around price action. These boundaries are calculated ba

The Range Directional Force Indicator is designed to help traders analyze market trends, reversals, and directional strength. It focuses on price movements within defined ranges, identifying key moments when the market is gaining momentum or preparing for a shift. By dividing the chart into dynamic price ranges, the indicator detects critical support and resistance levels. It calculates the directional force of price movements, highlighting potential entry and exit points based on market sentim

The Visual Dragon Cloud Indicator is designed to help traders analyze market behavior through trend identification, support and resistance levels, and potential reversals. It adapts to changing market conditions by using cloud formations to highlight momentum shifts and price direction. This tool provides traders with key price zones for entries and exits based on how price interacts with the cloud. When price moves into or out of specific cloud layers, it signals possible bullish or bearish tr

This indicator is designed to help you forecast the potential high and low prices for the current trading day, based on the high and low of the previous day. It does this by applying a customizable percentage increase or decrease to those levels. How It Works: The idea is simple: It looks at the previous day's high and low prices and then adjusts them by a percentage you choose. Here's what that means: Predicted High : This is calculated by taking the high price of the previous day and adding a
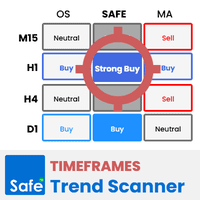
Timeframes Trend Scanner is a trend analyzer or trend screener indicator that helps you know the trend in all timeframes of selected symbol you are watching .
This indicator provides clear & detailed analysis results on a beautiful dashboard, let you able to use this result right away without need to do any additional analysis. How it works
Step 1: Calculate values of 23 selected & trusted technical indicators (Oscillator & Moving Average indicators)
Step 2: Analyze all indicators using best pra

Visual Eagle Dive Indicator The Eagle Dive Indicator is your ultimate tool for analyzing and interpreting market movements with precision. This powerful indicator is designed to help you visualize key market trends and patterns, but it is not optimized. It has been intentionally created for you to customize and optimize according to your trading style and preferences. Key Features and Entry Logic Market Diving Signals: The Eagle Dive Indicator identifies critical market movements, resembling th

Unleash the Power of Market Dynamics with the Vortex Indicator! The Visual Vortex Indicator is your advanced tool for decoding market trends, reversals, and momentum shifts. Priced at $65, this indicator provides a comprehensive view of market behavior, but it’s designed for you to fine-tune and optimize it according to your unique trading strategy. What Makes It Unique?
The Vortex Indicator is based on a strategy that identifies directional movements and trend strength by analyzing key price d

Visual Vortex Momentum Shift Indicator Unlock the potential of momentum shifts in the market with the Visual Vortex Momentum Shift Indicator! This advanced tool is designed to help traders identify crucial turning points and momentum reversals with clarity and precision. However, this indicator is not optimized and is created for you to optimize based on your trading preferences and strategies. What is the Visual Vortex Momentum Shift Indicator? The indicator focuses on detecting momentum shift

Explore the Power of Precision with the Range Indicator! This cutting-edge indicator is designed to provide traders with a detailed analysis of market range movements. However, it is essential to note that the Visual Range Indicator is not optimized—it has been crafted for you to tailor it to your trading needs and optimize it for your unique strategy. Your mastery and customization will unlock its true potential! The Strategy Behind the Range Indicator
The Visual Range Indicator focuses on id

在瞬息万变的金融市场中,找到可靠的交易信号是成功的关键!!
在交易中,入场时机决定了一切!
无论您是短线交易者还是长线投资者,本指标都能为您提供最精准的入场信号,帮助您抢占市场先机!成为您最强大的交易助手!
MT5: https://www.mql5.com/zh/market/product/129934
特点:
精准入场信号:基于先进的算法和实时市场数据,提供高准确率的入场提示,让您不再错过最佳开仓时机。
多市场覆盖:适用于股票、外汇、加密货币、期货等多种市场,满足您的多样化交易需求。
简单直观:清晰的图表显示和明确的信号提示,无需复杂分析,轻松找到入场点。
实时提醒:24/7 实时监控市场动态,第一时间推送入场信号,确保您随时掌握机会。
适合所有交易者:无论您是新手还是资深交易者,都能快速上手并从中受益。

Купите AI Engine Crypto MT4 + Бонус AI Engine Crypto MT5 или Price Gold! Если в вашем инвестиционном портфеле уже есть хотя бы пара топовых советников, то лучшим дополнением для них станет AI Engine Crypto MT4 — эффективный с открытыми параметрами для оптимизации советник (EA) предназначенный для торговли криптовалютой на платформе Meta Trader 4.
С применением нейронных сетей и торговых уровней, этот советник предназначен для скальпинга на биржах - Tickmill, IC Markets (BTCUSD, ETHUSD и др).

Summary: This indicator calculates histograms representing bullish and bearish impulses relative to a moving average. The impulses are determined by the difference between the high/low prices and the MA, normalized by the point value. Higher values in the Bulls array indicate stronger bullish pressure, while higher values in the Bears array indicate stronger bearish pressure.
Key features:
Colors: Uptrend chart is displayed in green and downtrend chart is displayed in red.
Automatic identi

Automate your Trendsurfer trailing stop management - day and night With this Expert Advisor for Metatrader 4 you save time, avoid mistakes and trade more relaxed - specially developed for the Trendsurfer trading system.
Always the right stop loss Fully automatic Simple to use Saves you time How it works
1. download the Expert Advisor and install it in Metatrader 4 (I will give you instructions on how to do this)
2. define your stop-loss rule
3. run your computer or VPS - the Expert Advisor

Dashboard.mq4 - 简单交易管理器 为那些喜欢手动交易并希望简化交易管理的交易者设计,这个强大的MQL4工具通过提供实时仪表盘来管理交易,提升了交易效率。它无缝集成到MetaTrader中,轻松计算仓位大小,并跟踪风险指标。 主要特点: 风险和保证金显示 :实时计算仓位大小、保证金要求和胜率,以便做出精确的交易决策。 交易管理按钮 :一键按钮用于下达买入/卖出订单、平仓(所有、盈利或亏损的交易)以及通过取消止盈或止损来修改订单。 可定制的胜率跟踪 :分析不同时间段的交易表现,包括当前月份、最近的交易或所有历史交易。 互动和直观的UI :清晰、易于导航的仪表盘,具有可定制按钮,方便快速操作。 准确的计算 :基于账户余额和风险百分比的内置仓位大小计算器。 这个工具非常适合那些希望在MetaTrader 4平台上直接管理交易并优化风险回报策略的交易者。

This is a multi trading strategy ea.
Parameters are set directly on the chart.
Watch the installation on YouTube: https://www.youtube.com/watch?v=qdAuI3_RH0o&list=PLIqpRSR2NeKjtCVQfeeb_rOLF7YCJX0Co
Fill in the ea parameters:
Magic: specified number ea
Order: limit the number of orders
TP: test Takeprofit
SL: test Stoploss
-Trading grid
Type: transaction type denoted b=order Buy, s=order Sell.
Vol: trading volume.
Distance: distance of trading orders.
-Select the Start button to begin tra

[ MT5 Version ]
Discover DoIt GBP Master , a cutting-edge Expert Advisor engineered for GBPUSD. Designed to deliver consistent results, it combines simplicity with advanced trading algorithms for traders at any experience level. Live Signal: Click Here
LAUNCH PROMO: Only a few copies left at current price! Final price: 999$ Bonus Offer: Purchase DoIt GBP Master One and choose 1 Gold Guardian or Index Vanguard for free!! Key Features: Customizable Risk Levels
Choose from conservative, ba

Live Signal V1:
Recommendations: Currency pair: GBPUSD EURUSD Timeframe: M1 Minimum deposit : $200 Account type: ECN, Raw or Razor with very low spreads.
Experience the precision and potential of our automated trading solution tailored for GBPUSD EURUSD on the M1 timeframe. Designed for accounts starting from $200, our system dynamically adjusts lot sizes between 0.01 and 0.02 based on your balance, ensuring optimal risk management. Whether you're a seasoned trader or new to the market, ou
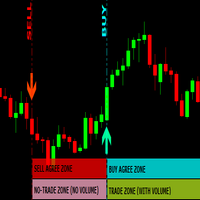
non-repaint free MT4 technical indicator works on all timeframes 1 minute to the monthly timeframe the trade vision buy and sell arrow is a multi currency and synthetic indicator Trade vision buy and sell arrow comes with Push Alerts purple arrow look for selling opportunities white arrow look for buying opportunities. wait for candle to close and arrow to appear before taking any trades
An expert of the indicator type.
To determine the entry point into the market, the expert can use the indicators of four indicators.
Two indicators are standard, they are available in any MT4 terminal and two custom indicators that can be downloaded from the link . These indicators just need to be placed in the \MQL4\Indicators folder. All four indicators can be used to determine the entry point, as well as each indicator individually. The settings of all indicators are included in the Expert'
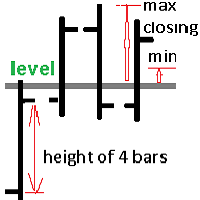
The bot searches for 16 patterns of 4 bars at a strong support or resistance level. The levels are being searched on a higher timeframe.Moreover, patterns can be on M1, and levels are taken from M5 or M15. As testing has shown, levels from different timeframes are rarely duplicated, i.e. different returns are obtained. Therefore, the set files are separate and the Expert Advisor distinguishes between open transactions on Magik. The testing was conducted over the period of 15 years 2010-2024(12)
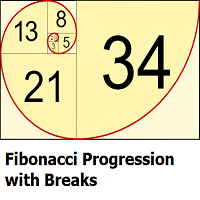
This indicator highlights points where price significantly deviates from a central level. This deviation distance is determined by a user-set value or using a multiple of a period 200 Atr and is multiplied by successive values of the Fibonacci sequence. Settings
Method: Distance method, options include "Manual" or "Atr"
Size: Distance in points if the selected method is "Manual" or Atr multiplier if the selected method is "Atr"
Sequence Length: Determines the maximum number of significant devia
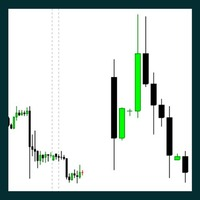
The Indicator is useful for professional trader, such as ICT , Smart Money Concept trader; who do the top-down analysis and want to display the candles of the Higher Timeframe on the Lower Timeframe. It allows you to stay in your entry timeframe while following the narrative of the Higher timeframe. Here are some easy input: Number Of Bars: The total of HTF's candle you want to display. Auto Timeframe: If true, the indicator will recommend the Higher timeframe that suit the current timeframe you

This is an expert advisor for BTCUSD pair operations in 15 minutes, with one operation at a time with SL and TP.
If you're looking for a simple and effective solution to maximize your profits in the cryptocurrency market , CapitalBtc is the perfect choice! This expert advisor stands out for: Simplified Configuration: With minimal settings, CapitalBtc is easy to use, even for beginners. Exclusive Operation: It was designed to work exclusively on the BTCUSD pair, in the 15-min

DYJ BoS MT4 指标:智能识别市场结构变动 DYJ BoS MT4 指标 旨在自动检测并标记市场结构的重要变化,包括: 结构突破(BoS): 当价格发生重大波动,突破之前的结构点时,即检测到 BoS 事件。 趋势线突破确认: 指标会标记 可能的上升趋势线(UP)和下降趋势线(DN) ,表示持续创新高或创新低的走势。 当价格突破这些趋势线时,触发 红色(BEAR)和绿色(BULL)箭头 ,提示可能的趋势变化。 BoS 如何运作? BoS 事件 发生在价格 决定性突破之前的波动高点或低点 时,从而打破原有的市场结构:
突破前高 ,意味着市场可能进入 看涨趋势 。
跌破前低 ,可能暗示市场进入 看跌趋势 。 这一现象通常意味着 趋势的延续或新趋势的形成 ,帮助交易者更好地把握市场情绪变化。 交易管理策略 为了 提升准确性 ,建议:
初始交易时不设止损(SL)和止盈(TP) ,而是在 相同方向的下一个突破点 进行平仓。
或者, 当反方向出现 BoS 信号 时,及时止盈或止损。 对于有
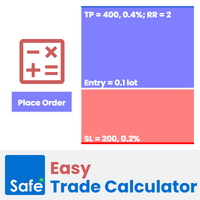
Easy Trade Calculator helps to calculate entry/stop loss/take profit levels and volume with some additional information to let your trades under risk management. Quick, accurate & in the visual way! Make trade calculation easier than ever! There are some constraints between risk, stop loss and volume for a safe trade. You need to know and let risk under management before you making a trade.
Easy Trade Calculator helps to simplify calculation, make it more accurate and much quicker than do it m

An expert advisor for semi-automated trading. Set 1 or 2 levels to break past, stop distances, minimal reversal distances or specific price targets. Works on a 1-minute time frame. Ideal for working a range either short term or long term. It allows for multiple re-entries in fast markets after nearby stops are hit. Can be a set-and-forget ea or adjusted multiple times throughout the day depending on your trading style. It's based on the principles described in the article - https://www.mql5.com/
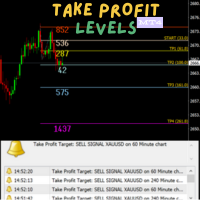
This indicator outlines take profit (TP) stations derived from the Dinapoli ABC price projections. The key levels identified include COP (the critical operation point) designated as TP1, OP (the optimal point) marked as TP3, and SXOP (the secondary operation point) noted as TP4.
This indicator proves to be especially beneficial for traders entering positions without clearly defined exit points. The Dinapoli levels provide precise price projections that highlight where the market is most likely

My Birthday Special Promo!
All Expert Advisors Only $52 Until the End of February 2025.
Grab Yours Now! Only $52 for unlimited use purchase. (Promo ENDED)
Zero Version of Alwinson Gold EA
Looking for better trading results without relying on complex candlestick analysis? Our Trading Robot uses accurate candlestick pattern signals to help you achieve consistent and stable profits with relatively low risk.
Key Features: Safety mechanisms for investment stability
Backtest Result Default:
Back-

使用高级RSI+EMA趋势指标最大化您的交易成果! 借助这一强大的指标,探索技术分析的新高度,为寻求明确识别趋势并在正确时机采取行动的交易者量身打造。 主要功能 : 图表上的可视信号 :通过图表上清晰标记的箭头,立即发现最佳买卖时机。 EMA和RSI的结合 :利用指数移动平均线(EMA)和相对强弱指数(RSI)的先进技术,提供可靠的交易信号。 可自定义的提醒 :启用声音/视觉提醒,即使在处理其他任务时,也不会错过任何交易机会。 适合人群 : 想要发现新兴趋势和市场方向变化的交易者。 基于精准和可靠信号的自动化交易策略。 适用于所有金融资产,包括外汇、指数、股票和加密货币。 工作原理 : 该指标分析两条EMA(快速和慢速)与RSI之间的关系,以识别超买、超卖条件和趋势交叉点。 买入和卖出信号以箭头形式(向上或向下)直接显示在图表上,使决策过程快速且直观。 优势 : 借助高度可靠的信号提高准确性。 使用自动化且可配置的提醒节省时间。 通过简单易用的工具简化分析,即使是初学者也能轻松上手。 使用集简单性、有效性和先进技术于一体的指标,改变您的交易体验

This is the Parabolic Dashboard MT4. This dashboard will scan multiple timeframes and symbols in MT5 platform, from M1 chart to D1 chart. It will send the buy/sell signals by alert on the platform or sending notification to your phone or message you via a email.
The buy signal is generated when the SAR changes its position from above to below of the candle. The sell signal is is generated when the SAR changes its position from below to above of the candle. The up/down trend color will be di
高级交易量分析热图指标 热图指标提供了一种实用且可视化的市场交易量分析方法,帮助交易者快速做出明智决策。 主要功能 1. 热图显示交易量 通过清晰的色彩梯度显示交易量强度: 蓝色 :低活动量 绿色 :中等活动量 橙色 :高活动量 红色 :最大交易量 2. 可定制界面 可根据用户偏好调整颜色设置。 提供实时百分比显示以提高数据清晰度(可选)。 直观的设计便于趋势解读。 3. 警报系统 根据具体市场条件自定义通知。 实时警报以跟踪重要变动。 4. 性能优化 资源消耗低,确保稳定运行。 兼容所有时间周期。 实际应用 日内交易 :帮助识别交易量和波动性的高峰。 波段交易 :简化累积和分配阶段的分析。 短线交易(剥头皮) :检测市场快速变化,适合高频交易。 自定义选项 根据您的交易风格调整分析周期。 选择使用交易的真实交易量或成交量。 调整灵敏度设置以匹配个人偏好。 优势 简单且高效的设计。 灵活的定制,满足个性化需求。 可靠警报支持实时决策。 免责声明 :该产品仅用于分析目的。过去的表现不代表未来的结果。所有交易均存在风险。

One of the key elements in trading is identifying zones or levels that allow traders to make buy or sell decisions during trading. أحد العناصر الأساسية في التداول هو تحديد المناطق أو المستويات التي تسمح للمتداولين باتخاذ قرارات الشراء أو البيع أثناء التداول. The indicator displays Fibonacci levels يعرض المؤشر مستويات فيبوناتشي drawing levels based on historical daily or weekly data. مستويات الرسم بناءً على البيانات التاريخية اليومية أو الأسبوعية. Daily levels update with each new day’s opening

Are you a newbie who feels like trading is rocket science? Fear not! With our new Indicator, you’ll trade like a pro—without the awkward space suit!Say goodbye to the confusion and hello to profits! Now you can impress your friends with your "expert" trading skills—even if you just learned what a stock is! :money_mouth:Trade smart, not hard! Grab the Trade Wiz-A-Matic today and let’s launch your trading journey! Key Features: Dynamic Levels : The indicator calculates and plots key levels based o

This is an expert advisor for trading on the DAX index in 15 minutes, with one trade at a time with SL and TP .
If you are looking for a simple and effective solution to maximize your profits in the index market, GoldenGatesDAX is the perfect choice! This expert advisor stands out for: Simplified Configuration With few settings, GoldenGatesDAX is easy to use, even for beginners. Exclusive Operation It is designed to work exclusively on the DAX index (D40/GER40),

The indicator plots levels based on an internal equation So that it automatically draws levels as soon as it is placed on the chart Levels can be used as supports and resistors So that entry is based on testing the level And close down or up, depending on the direction It is also an effective tool and help in making the right decision *There are two options in the settings 1. Zone A 2. zone B Where Zone A shows the levels starting from 123-369 The zone B shows the levels to start 693-96

Enter/Exit indicator Try trading on signal change BUY/SELL to Sell SELL/BUY to buy or exit by signal change. Very good for trading news. - - - - - - - - - - Please leave positive comments. - - - - - - - - - - - - - - - - - - - - - - - - - - - - - - - - - - - - - - - - - - - - - - - - - - - - - - - - - Info: CalculatedBars = Indicator Calculated Bars; AlertConfirmation = true On false Off LongBarPoints = maximum point value for signal long bar size. Buffer0[] = Arrow Up; Buffer1[] = Arrow Down;

When geometric shapes meet with time and price, they give more confidence in the chart The indicator plots daily and weekly price triangles So that the weekly is kept until the end of the trading week While the Daily is changing with each opening The size of the triangles varies based on the previous data They will be an aid in decision-making, especially on both sides of the Triangle * Contains options to activate and disable triangles * Merge weekly and daily triangles together, each c

Graff – диалоговая панель для работы с графическими объектами. Если вы занимаетесь техническим анализом рынков, то построения таких графических объектов как трендовая линия, каналы, фибоначчи и многих других, может занимать много времени (построение, изменение цвета, стиля линий, видимости). Для значительного ускорения и упрощения работы и была создана утилита Graff . Этим индикатором я пользуюсь постоянно (анализирую много валютных пар). Это мой надежный помощник. Перечислю основные функции: к

此實用程式適用於水平線: Prof1、Prof2、Loss1、Loss2。 這些線具有嚴格固定的名稱,由交易者在其終端的任何圖表上獨立繪製。 可以選擇一次建立所有線路,也可以選擇四條線路中的任一條。 只要看一下這些線條的名稱,其用途就一目了然了。 Prof1 和 Prof2 線指示交易的獲利水平,但以視覺化形式呈現,使交易者更容易感知資訊。 Loss1 和 Loss2 線反映停損水平,清晰直觀地呈現風險。 因此,該工具有助於創建關鍵層級的清晰視覺化,使交易者能夠做出更明智的決策。
此實用程式的獨特之處在於,只需將其安裝在一張圖表上,您就可以使用任何終端圖表上的線條。 專家實用程式可自動偵測終端中的所有 Prof1、Prof2、Loss1、Loss2 線,並產生有關該工具上所有交易的資訊(利潤、損失、數量)。 MT5 版本鏈接 該實用程式的第一個目的是有關盈虧的資訊。 使用停損線和獲利線來關閉交易 = 僅供參考,線下方的 OFF 符號禁止關閉交易。計算並在這些線下方放置一條此類型的線:Prof1 OFF +584$/19 -396$/7 = +187$/26。 說明:線路名稱,線路是

When executing an order, whether through the Metatrader ticket on a computer or the Metatrader app on a mobile device, either manual or pending,
Easy Trade will automatically set the take profit and stop loss levels, as well as a limit order with its respective take profit and stop loss levels. It follows the trading strategy for market open (US30, US100, US500), but it can be applied to any market asset.
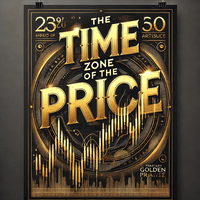
When time converges with price in a critical zone, it creates a pivotal area that simplifies decision-making. This is precisely the functionality of this indicator, as it integrates time and price to highlight a robust zone you can rely on.
Key Features of the Indicator: • Dynamic Time-Price Zones: The indicator draws a time-price zone determined by the user, based on customizable settings available in the configuration. • Customizable Day Selection: A dedicated field allows you to choose th

Monex Scalp is an intelligent trading robot designed for 1-minute time frames, offering simplicity and efficiency for traders.
Key Features: • User-Friendly Settings: Monex Scalp offers straightforward settings, making it accessible for traders of all experience levels. • Session Scheduling: Customize trading sessions to align with various market hours, enhancing strategy execution. • Adjustable Stop-Loss: Set personalized stop-loss levels to effectively manage risk according to yo

I am excited to introduce my newly developed Expert Advisor (EA), Grow EURUSD , to the MQL community. This EA has been specifically designed and tested for the EUR/USD currency pair on the 5-minute timeframe . I’m publishing it here to gather feedback from experienced traders like you and to refine and enhance its performance. Your comments, suggestions, and insights will be invaluable in improving this EA. Let’s collaborate to make it even better! Thank you for your support, and I look forward

Volume Bar POC 指标 是一种创新工具,可以基于成交的点数交易量精确显示关键价格水平(控制点,POC)。该指标分析每根K线内的每个价格点,并显示最重要的价格水平,可用作强大的支撑和阻力区。非常适合日内交易和长期交易策略。 Volume Bar POC 指标如何工作? 该指标在每根K线形成过程中使用高级算法来计算POC: 在K线开启时创建表格 : 新K线开启时,指标会创建一个内部表格,包含以下数据: 价格 :K线高低范围内的所有价格水平。 成交量 :每个价格水平的点数交易量(tick volume)。 表格动态覆盖K线范围内的所有价格点。 在K线形成过程中更新表格 : 随着高点和低点的变化,新价格水平被添加到表格中。 当市场(买/卖报价)经过某一价格水平时,该价格水平的成交量会增加。 计算POC(控制点) : 指标持续监测哪个价格水平的成交量最大。 POC被定义为点数或交易量最多的价格水平。 此信息会动态更新,因此该指标始终显示K线形成过程中最活跃的价格水平。 主要特点和优势 : 点数成交量分析 :使用点数交易量,确保高精度并支持所有MetaTrader 4平台支持的市场。

This is an expert advisor for operations on the Ethereum / USD pair in 1H, with one operation at a time with SL and TP, following Fibonacci patterns .
Ether Fibe Welcome! We are excited to present our Expert Advisor , an innovative tool designed to optimize your operations in the financial market. This system particularly focuses on two crucial areas: The Power of Fibonacci Fibonacci : Utilizes Fibonacci sequences to identify support and resistance levels, allowing for a more a

**"Discounted Price."**
We are always in pursuit of the perfect time to achieve the desired price, as timing is a pivotal factor in trading. This is exactly what the indicator does: It seamlessly combines time and price, dynamically mapping them onto the chart using two lines that represent both time and price together, introducing a completely innovative conept. • No more complex settings. Simply place the indicator on your chart, and it will handle everything for you. ---------------------

Initial Stop Loss Setup : Automatically applies an initial stop loss (in points) immediately when a trade is opened. Provides peace of mind by ensuring every trade is protected against unfavorable price movements. Dynamic Trailing Stop : Adjusts the stop loss at the close of each candle based on a fixed point distance. Moves the stop loss incrementally closer to the current price, locking in profits as the market moves in your favor. Works Across All Timeframes : The EA adapts to any chart time

Fully automatic indicator - type trading expert . Entry into the market is based on the signals of two indicators . A distinctive feature of this expert Advisor is that it is possible to enter the market both as single positions and as a Pack of positions at the entry point . Entering with a bundle of positions makes it possible to " spread out " the entry point a little and allow several positions and bundles to enter the market at a more favorable price if the price goes against the direction

AurumCubePro is an Expert Advisor (EA) for MetaTrader 4 ( MT4 ) designed to simplify your trading strategy. Based on precise calculations between moving averages and the asset price, it automatically sets your Stop Loss and Take Profit, optimizing your trades and reducing risk. Key Features: Intelligent Calculations: AurumCubePro uses advanced algorithms to analyze the relationship between different moving averages and the current price, identifying ideal entry and exit points.
学习如何在MetaTrader AppStore上购买EA交易,MetaTrader平台的应用程序商店。
MQL5.community支付系统支持通过PayPay、银行卡和热门付款系统进行交易。为更好的客户体验我们强烈建议您在购买前测试EA交易。
您错过了交易机会:
- 免费交易应用程序
- 8,000+信号可供复制
- 探索金融市场的经济新闻
注册
登录