适用于MetaTrader 4的EA交易和指标 - 274

This EA will open reversal order if the price hit the red line. eg: Buy ticket opened, if price hit below red line, buy ticket will be close and sell ticket will be open (lot size based on EA parameter setting)
Parameters Setting Monitor order with StopLoss set: if set to TRUE , order on same symbol with stoploss level will be closed if the stoploss line is hit if set to FALSE , order on same symbol with stoploss level will be ignored LotSize: Lot size for trade by EA new StopLoss position ran
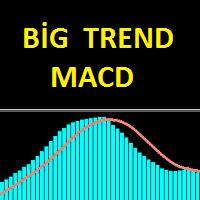
The Big Trend MACD indicator is an advanced model of the standard MACD indicator. It is very easy and simple to use. The main purpose of the indicator is to find great trends. With this indicator you can easily detect in small trends. This indicator can be used as two different trend finding tools for big trends and small trends. Try to use the big trends suggested, or with other suitable chart-appropriate indications.
Features and Trends This indicator has period, signal, period color, signal
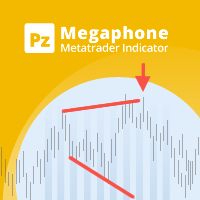
使用此指示器可以轻松找到 扩音器 样式。 [ 安装指南 | 更新指南 | 故障排除 | 常见问题 | 所有产品 ]
易于使用 可自定义的颜色和尺寸 它实现突破信号 它实现了各种警报
输入参数 模式的大小:要找到的模式的大小,表示为替代点之间的条形 最大。历史柱线:图表中要检查的过去柱线的数量 看涨形态的颜色:此参数不言自明 空头形态的颜色:此参数不言自明 标签的字体大小:图表中1-2-3标签的字体大小 线宽:图案线的大小 看涨突破的颜色:这是买入箭头的颜色 看跌突破的颜色:这是卖出箭头的颜色 箭头大小:这是图表中显示的箭头的大小 自定义警报名称:此图表中引发的警报的自定义标题 显示警报:启用或禁用屏幕警报 电子邮件警报:启用或禁用邮件警报。 推送警报:启用或禁用推送警报。 声音警报:启用或禁用声音警报。 声音文件:出现屏幕警报时播放的声音文件。
作者 ArturoLópezPérez,私人投资者和投机者,软件工程师,零零点交易解决方案的创始人。

This is a panel EA for one-click trading.
Demo version | User manual | Contact me for any questions / ideas for improvement / in case of a bug found
List of main functions
Risk management Calculate the lot size by X dollars(currency of deposit) and stop loss.
Calculate the lot size by percent of equity and stop loss. Calculate lot size by equity percent (free margin percent). Calculate lot size by specified lot for each X dollars(currency of deposit) of balance.
Positions and o

The EA is optimized for trading #FTSE and it is fully prepared for installation in the MetaTrader 4 terminal. No additional settings are required. The initial deposit must be at least 5000. The EA trades a fixed lot based on two indicators, Moving Average and Fractals. Deals are closed by TraillingStop or StopLoss. There are only two input parameters: MaxRisk - default is 70 Slippage - default is 3 For the correct operation of the Expert Advisor, an uninterrupted Internet connection is required

This indicator allows you to measure the profitability of each specific transaction (the ratio of Stop and Profit). The indicator allows you to adjust the ratio by step size and number of steps. You can build an unlimited number of ratios to compare the risks from different movements.
Note: in MT4, the number of horizontal lines in a single ratio cannot exceed 32.
Building a line : click the " Ratio " button and draw a line (mouse click - the first point of the line, where the mouse is relea

StrongCurrency是基于各种技术指标,移动平均线和枢轴的完整交易系统。这些元素中的每一个都可以通过定义的规则和系数进行评估(取决于指标),为StrongCurrency提供了无限优化的方案。StrongCurrency通过评估数据创建一个趋势强度和入场信号列表显示,它显示所有货币对的数据。根据每个货币对趋势强弱获得入场信号。列表数据包括Symbol,BuyPercent,SellPercent,LastBuySignal,LastSellSignal。其中LastBuySignal和LastSellSignal内容显示入场价格,时间,货币对趋势百分比。趋势强度大于70%时,认为是强货币对;该工具适用于外汇市场,指数,金属的数据。 该工具仅在一个图表任意周期上运行,它对于多货币交易者非常有吸引力的,其简化的信息(LastBuySignal和LastSellSignal)可以提供出色的输入信号。帮助您快速,识别强弱货币对。请参见截图。 关于MT4回测多货币的限制在评论里有说明。
输入参数 Text Color = White - 常态文本颜色。 Buy Signal colo

Forex Hunter 是一款全自動化專家顧問。 開單信號基於Candlestick Patterns中的吞噬型態,吞噬信號以及移動平均線的信號同時成立時開啟訂單。 如果行情與訂單方向相反,可以使用停損機制,或是加大停損至1000點以上,啟用Martingale系統,增加獲利機會。 本EA採用動態手數管理,當您的本金增加時,下單的手數會以相同比例增加。 Buy單與Sell單分別為獨立交易系統,經常性的同時存在。預設參數適合用在EURUSD的M30時區。 真實帳戶監控 https://www.mql5.com/zh/signals/296113 可使用停損或馬丁格爾交易系統 適用四位數及五位數報價系統 回測結果與真實帳戶交易相符 適用任何交易商 交易條件 貨幣兌:所有貨幣兌 時間框架:所有時間框架 推薦槓桿為1:500 建議帳戶最小資金為100元 交易及設定說明 加單時下單手數為第一單的手數乘上LotMultiplier 停損點數預設100000,基本屬於不停損,如果有需要停損的人可以自行設定 參數說明 MagicNumber - 魔術數字 GridSetp - 補單最小距離,補單時兩
Strongest and Weakest Currency Analysis This product shows the strength of the main currencies in FOREX based on average pip gain/loss in different time-frames! Depending on the strength of the currency, the indicator colors changes from blue to red also the orders may also be changed, allowing you to find the strongest and weakest currency at a glance!
Advantages Whatever your trading method and strategy are, it is always important to choose the correct pairs, so this indicator will help you

The Expert Advisor consists of three popular indicators: MovingAverage; Stochastic; MACD. It is possible to use all three indicators both together, and individually, selecting the necessary combination.
Basic settings of the Expert Advisor Magic - magic number of orders; Volume - trade volume; Slippage - slippage when opening orders; Stop Loss - close order at a certain loss in points; Take Profit - desired profit in points; Trailing Stop - move StopLoss to order's opening price when a positiv

The Expert Advisor uses a trading strategy based on Fibonacci levels. On the levels of ~38.2,~50.0 and ~61.8, it sets virtual pending orders (Buy Limit, Sell Limit). A grid of virtual pending orders is built in trend direction. Trend is determined using the ZigZag indicator. Orders are closed at a total virtual take profit or a total virtual stop loss. The EA makes a decision at the opening of a new candlestick, so optimization can be performed using open prices.
Settings and Input Parameters

Background The EA trades a grid of orders using the martingale technique. It is designed for multi-currency trading. It opens and closes a large number of orders. My account monitoring: https://www.mql5.com/en/signals/author/mizrael
Advantages Trading results are visible every day. The EA works 24/5. Is not sensitive to trading conditions. Suitable for a rapid deposit boost. Ease of use.
Recommendations Use the EA on several pairs simultaneously. Recommended deposit 500 $. When using the EA

The script allows selecting the required 'Filter level' value of the AIS-MTF indicator. Run the script on the required chart and selected timeframe. Once its operation is complete, the HPS.csv file will be created in the Files folder. Open the file. You will see three columns. The 'Filter lvl' column represents the value of the 'Filter level' for the AIS-MTF indicator. Am. dev. - degree and direction of the indicator's deviation from the price level (sorted in ascending order). Negative values i
FREE

This indicator studies the price action as a combination of micro-trends. All micro-trends are analyzed and averaged. Price movement is filtered based on this averaging. IP_High and IP_Low (blue and red dashed lines) show the instantaneous price movement. They display the forecast only for the current price values, taking into account only the number of bars defined by the 'Filter level' parameter. SP_High and SP_Low (blue and red solid lines) smooth the price movements with respect to history.

The Signal MACD product is an indicator that works with the standard MACD indicator. This indicator is designed to do signal trading using the objective MACD indicator and a set of algorithms. This indicator can be used both as an oscillator and as a signal producing product. So you can use this indicator in two goal. When the indicator finds a signal, it shows arrow marks on the oscillator. These arrows allow investors to trade.
Trade Rules "Buy" action when you see a green arrow and receive

A powerful assistant for manual trading. Execute a deal with one click and manage the trade volume, stop loss and take profit, according to your trading strategy, without being distracted from the chart. The product can also visually preview your levels of entry into the market, stop loss and take profit before placing an order.
Advantages easy and intuitive interface the control panel in real time 3 modes of setting the order volume 6 stop loss setting modes 5 profit take setting modes calcul

This EA is the 28-common-pairs Scanner in the Forex Market. It based on the theory of 123 Pattern with a set of SMAs, Heiken Ashi for detecting Trade signals. You can choose any time frame to scan as you like.
123 Pattern Theory Buy Condition: Fast MA is above Slow MA (Uptrend confirmed) while Heiken Ashi pull back and begin to continue going up with the trend. Sell Condition: Fast MA is below Slow MA (Downtrend confirmed) while Heiken Ashi pull back and begin to continue the downtrend. (Attac

此多品种和多时间框架指标扫描以下烛台模式(请参阅屏幕截图以了解模式说明): 三白兵(反转>延续形态) 三只黑乌鸦(反转>延续形态) 看涨和看跌三线罢工(反转形态) 当指标设置中的严格选项启用时,模式不会经常出现在更高的时间范围内。但是当他们这样做时,这是一个非常高概率的设置。根据 Thomas Bulkowski(国际知名作家和烛台模式的领先专家)的说法,三线罢工在所有烛台模式中的整体表现排名最高。结合您自己的规则和技术,该指标将允许您创建(或增强)您自己的强大系统。 特征 可以同时监控您的市场报价窗口中可见的所有交易品种。仅将指标应用于一张图表并立即监控整个市场。 可以监控从 M1 到 MN 的每个时间范围,并在识别出模式时向您发送实时警报。支持所有 Metatrader 原生警报类型。 可以使用 RSI 作为趋势过滤器,以便正确识别潜在的逆转。 该指示器包括一个交互式面板。当单击一个项目时,将打开一个带有相关代码和时间范围的新图表。 输入参数 请在此处 找到输入参数的说明和解释。 请注意,由于具有多时间框架功能,该指标不会在任何图表上绘制线条和箭头或买卖建议。 我建议您将指标放在干

This Expert Advisor is based on the famous Morning channel breakout strategy. At the appointed hour, the EA plots a channel using High and Low of the specified number of candles of the selected Timeframe . Filtering is performed by the size of the channel range. The BuyStop and SellStop orders with the initial lot are placed at the channel boundaries. If one of the pending orders triggers, the other one is deleted. The EA marks the Breakeven price on the chart with yellow icons. If the price pas

MIRA is an Expert Advisor built according to the principles of indicator-less short-term trading based on martingale with different protection levels and customization. It provides methods for reducing risks by fixing a part of profit by trailing stop, smoothing out the gaps by means of dynamic locking, automatic recovering from drawdowns, buying out losing positions. A strict risk management system allows setting a limit on the allowed drawdown both as a percentage and in the deposit currency.

The indicator operates based on a unique candlestick pattern. When the indicator generates a signal, there is a high probability of price reversal, and we can use it in trading.
Indicator use strategy Market entry should be performed at the closure of the signal candlestick. Stop Loss should be set behind the signal cloud. We will have two take profits, the first one is equal to the stop loss value, 50% of lot amount should be closed at this level, and stop loss should be moved to breakeven. T

Signal Lock Scalper is a signal-based scalper with locking of unprofitable orders , followed by subsequent transfer to breakeven using profitable orders . The EA trades the trend strategy with the use of original built-in indicator for opening and closing orders. To protect the deposit from unexpected circumstances, the EA provides the ability to either lock all orders when reaching the specified drawdown levels, as well as setting a fixed stop order as an oppositely directed pending order. Ther

Samurai Scalping Indy is indicator signal strategy trading with Heiken Ashi, Smoothed Moving Average, and Ichimoku. It'll alert signal with an audio or pop up on the chart for Entry BUY/SELL and Exit BUY/SELL alert signal. Helpful for your system trading. Its easy use to filter major trend and help for scalping strategy to follow the trend. You can ON/OFF audio alert signal on the chart, Notifications alert on mobile, Email message alert. (Setting the alert on Mobile/Email in MT4. Go to Tools >>
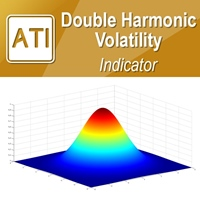
Introduction to Double Harmonic Volatility Indicator Use of the Fibonacci analysis for financial trading can nearly go back to 85 years from today since the birth of Elliott Wave Theory by R. N. Elliott. Until now, traders use the Fibonacci analysis to identify the patterns in the price series. Yet, we could not find any one attempted to use Fibonacci analysis for the Volatility. Harmonic Volatility Indicator was the first technical analysis applying the Fibonacci analysis to the financial Volat

It is a simple indicator showing the moments of intersection of two Moving Averages, and it can be an indefensible tool for use in some trading systems. When the MAs intersect, the indicator draws arrows in accordance with the crossover direction and generates and alert.
Indicator parameters Period Fast MA - fast Moving Average period; Period Slow MA - slow Moving Average period; Method MA - Moving Average method; Apply to - price used for MA calculation; Alert - alert; Number of history bars
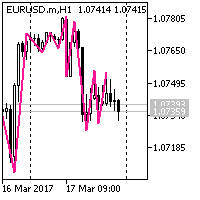
The ZigZag works as follows: On the left part of the chart, it finds a pivot point with the NumderOfBars parameter, which is a bottom. If the price action draws a top with the NumderOfBars parameter after this bottom, then the ZigZag draws a line from the bottom to the top. If the price action makes a new deeper Low, without forming a top, then the ZigZag extends the descending line to the new bottom. If the pivot point with the NumderOfBars parameter on the left side of the chart is a top, the
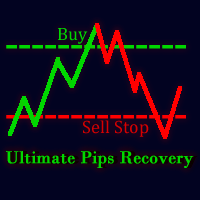
Ultimate Pips Recovery ( UPR ) is a unique, high quality and affordable trading tool, which is easy to use because knowledge of Forex trading is not much required to use this Expert Adviser. UPR does not require a specific time frame because it uses the technique that at every point, market will either go bearish or bullish. It opens a trade(say a buy trade) and immediately opens a sell stop position with a higher calculated lot size whose take profit is the same as stop loss of the previous ope
Price Line EA is an utility designed for manual trading. This expert advisor offers the ability to trade in automatic on your favorites levels. Default levels are created on chart when you upload the expert and after you can move them to your selected levels. When the market reaches the price levels, it opens orders. This algorithm allows an increase on risk management to grow your exposure. The utility opens operations with stop and reverse strategy, so place the levels on an important market r
Saint Volume Trader EA consists of the two sets of strategy. When "read volume" parameter is on, the EA trades with special build-in software to extract volume data from the data provider. Data provider updates real time data for every two minutes. When "read volume" set to false , the EA trade with standard MetaTrader 4 volume indicator. Both strategies have the same concept to read aggregated volume figures from the standard MetaTrader 4 volume indicator or data provider on a certain timeframe

The trading panel (EA) is intended for the fast and convenient closing of orders in the MetaTrader 4 terminal. It is a trader's assistant allowing to automate routine actions. The "Close" button closes all orders on the symbol of the chart, on which the EA is running. The "Close all" button closes all orders (on all symbols) which are open in the terminal. The EA does not work with pending orders. If closing fails, the EA displays the full error information on the screen. Also the EA shows the t
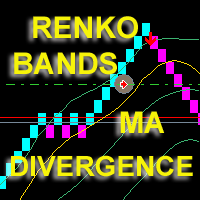
The Expert Advisor displays on a chart renko bars, Bollinger Bands and Moving Average indicators drawn based on Close prices. The EA opens and maintains trades based on divergence. Price peaks are determined when renko bars exit outside the Bollinger bands and move back. A sell trade is opened when the next price peak exists the borders of the upper Bollinger band and is higher than the previous one, and the divergence between the middle Bollinger line and the moving average is less than the poi

This is a risk management tool for your account. It shows the drawdown information on the chart. You can change the size and color of the text on the chart. You can install it on many charts at the same time. Please contact me if you have any problems with it and you can request some other essential features. Version for MetaTrader 5: https://www.mql5.com/en/market/product/23781
Parameters Size - Size font. Color - Color char.

這是一個多時間框架 Pin bar 警報指標。 您可以僅使用目前時間範圍,也可以使用從 1 分鐘到每月的所有時間範圍。
當您選擇所有時間範圍時,您會收到有關圖表開啟的當前時間範圍以及上面的時間範圍的警報。
每個選定的時間範圍分別有彈出視窗、電子郵件和推播通知警報。
此指標在價格圖表上放置一個箭頭。 對於看漲/多頭 Pin 棒,它位於價格線下方,對於看跌/空頭 Pin 棒,它位於價格線上方。
如果您只想獲取警報並且不希望圖表中充滿箭頭,只需選擇箭頭顏色:無
設定 要檢查的左側蠟燭數量:看跌 Pin Bar 應該是最高的,看漲應該是最低的才有效。 選擇左側的蠟燭數量,如果我們尋找看跌 Pin bar,則數量必須較低;如果我們尋找看漲 Pin bar,則數量必須較高。 最小主體/完整尺寸百分比:Pin bar 的最小主體尺寸。 最大主體/完整尺寸百分比:Pin bar 的最大主體尺寸。 最小長影線/全尺寸百分比:看跌 Pin bar 頂部有長影線,看漲 Pin bar 底部有長影線。 您可以選擇長燈芯的百分比。 顯示箭頭的蠟燭限制:傳回顯示箭頭的蠟燭數。 時間範

Gann Grid 该指标显示一天的江恩线。仅适用于少于每天的时间段。 指标设置说明: Count_Bars - 显示江恩线的每日柱数。如果 = 0,则显示在整个可用柱线历史上。 scaleGann1 - 第 1 行的比例(每条柱的点数) clrGann1 - 线条颜色 # 1 styleGann1 - 线条样式 # 1 widthGann1 - 线宽 # 1 scaleGann2 - 第 2 行的缩放 clrGann2 - 线条颜色 # 2 styleGann2 - 线条样式 # 2 widthGann2 - 线宽 # 2 scaleGann3 - 第 3 行的缩放 clrGann3 - 线条颜色 # 3 styleGann3 - 线条样式 # 3 widthGann3 - 线宽 # 3 scaleGann4 - 第 4 行的比例 clrGann4 - 线条颜色 # 4 styleGann4 - 线条样式 # 4 widthGann4 - 线宽 # 4 scaleGann5 - 第 5 行的缩放 clrGann5 - 线条颜色 # 5 styleGann5 - 线条样式 # 5

ChartChanger 是一个很棒的实用工具,可以减少终端上打开的图表数量。它分为三个部分:符号、时间框架和模板。您只需要打开一张图表,并且仍然可以向上滚动到多个图表。 符号:只需按一下按钮,您就可以从一个符号更改为另一个符号,并且您应用的指标将保留在下一张图表上。对于符号有自动检测模式,或者您可以手动输入所需的符号。您可以使用全部 28 或低于该数字的任何数字。您可以使用 MetaTrader 拥有的任何符号:货币对、能源、指数、商品等。 时间范围:在面板中间添加了时间范围更改器功能。只需按一下按钮,您就可以更改为所需的时间范围,从 1 分钟图表到每月图表。 模板:该面板的第三个功能是模板更换器。九个内置模板,使用任何或都不使用。 所有按钮都位于自由浮动面板内。将光标放在面板的顶部,然后单击鼠标左键,您可以将面板自由移动到图表上的任何位置。您无法将面板移出价格图表窗口。 每三个部分都可以使用该部分右上角的“+”或“-”按钮折叠或展开。通过此功能,当面板不使用时,您可以最大限度地减少价格图表中占用的空间。 请注意:在一张图表中只能使用一个 ChartChanger。无法回溯测试。 C

The EA "Opposite" is a full automated trading expert. The EA uses the hedging strategy as follows: He opens a buy and a sell position at one moment and closes one of the positions after reaching the take profit. Then he opens again two orders in two directions, but in one direction the lot size is bigger than in the other one. Thus one has two possibilities: Either one takes the profit in the direction with less lot size or one takes the profit in the direction with bigger lot size. In the last

Future Candle Two Candle is an arrow indicator of candlestick patterns, based on the calculation of historical statistics. It identifies and calculates patterns consisting of two candles.
Advantages of the indicator Gives information about the next candle right now; The indicator values are based on statistical data on the history of the current instrument; Forecasts and displays the result of trading based on its signals; The colors of the indicator have been selected for a comfortable operat

Future Candle One Candle is an arrow indicator of candlestick patterns, based on the calculation of historical statistics. It identifies and calculates patterns consisting of one candle.
Advantages of the indicator Gives information about the next candle right now; The indicator values are based on statistical data on the history of the current instrument; Forecasts and displays the result of trading based on its signals; The colors of the indicator have been selected for a comfortable operati

Future Candle Three Candle is an arrow indicator of candlestick patterns, based on the calculation of historical statistics. It identifies and calculates patterns consisting of three candles.
Advantages of the indicator Gives information about the next candle right now; The indicator values are based on statistical data on the history of the current instrument; Forecasts and displays the result of trading based on its signals; The colors of the indicator have been selected for a comfortable op

这个多时间框架和多品种指标可以识别以下 5 个交叉点: 当快速移动平均线穿过慢速移动平均线时。 当价格达到单一移动平均线时(收盘高于/低于或反弹)。 当出现三重移动平均线时(连续对齐的所有 3 MA:s)。 当 MACD 主线与信号线交叉时。 当信号线穿过 MACD 零(0)线时。 结合您自己的规则和技术,该指标将允许您创建(或增强)您自己的强大系统。 特征 可以同时监控在您的市场报价窗口中可见的选定符号。仅将指标应用于一张图表并立即监控整个市场。 可以监控从 M1 到 MN 的每个时间范围,并在识别出交叉时向您发送实时警报。支持所有警报类型。 可以使用 RSI 作为额外的趋势过滤器。 该指示器包括一个交互式面板。单击某个项目时,将打开一个带有相关代码和时间范围的新图表。 指标可以将信号写入一个文件,EA 可以使用该文件进行自动交易。比如 这个产品 。
输入参数
请在此处 找到输入参数的说明和解释。 重要的
请注意,由于多时间框架功能,图表上不会绘制买入/卖出建议或 MA 线。我强烈建议将指标放在干净(空)的图表上,上面没有任何其他可能干扰扫描仪的指标。

Requirement for the EA use: the EA needs a low spread (recommended spread value is 2) and minimum slippage! The EA is a system that trades the signals generated by the following indicators: Bollinger Bands, Stochastic and Moving Average. The EA works from 00:05 to 08:00, terminal time. By default, all orders are closed at 23:59 (can be modified). Important!!! The EA operation start time should match the American trading session close time, while the operation end time should coincide with the E

This long-term trading system works on 10 pairs and M5 timeframe. It uses various trading systems, such as trend trading, countertrend trading and others. This increases the chances of sustained growth and reduces exposure to a single pair or individual operations. The risk is very controlled. The settings are very simple, there is no need to change them. Optimization is not required as well. Realistic management of internal adjustments. Instead of trying to find the exact values that fit the h

Price Action Breakout is one of the most popular trading strategy. This Price Action Breakout indicator is designed using several indicators combined to be one strategy. It is very useful for traders that trade based on the breakout strategy. It will make it easier to identify the support and resistance levels. This Price action indicator will draw the support and resistance levels on the chart, so it will make it easier to identify the support and resistance levels. It will inform about the sup

The Effort and Result indicator is based on the work of Karthik Marar; a volume spread analysis trader. It compares a price change (Result) to the volume size (Effort) for a certain period. By comparing the effort and result, we can get more information about the future price movement. Both values are normalized and converted to a scale of 0 - 100 % based on a selectable look-back period.
This indicator is also known as the Effort Index.
The law of effort and result The law of effort v

This Script Shows your Account & Symbol information which you use on your graphics. These are: Account Information Number Name Currency Server Leverage Stop Out Level Balance Information Balance Equity Margin Free Margin Symbol Information Symbol Lot Size Min.Lot Lot Step Max.Lot Tick Value Tick Size Spread Stop Loss Level Swap Long Swap Short Initial Margin Maint.Margin Required Margin Trade Allowed

The Avato is one of our standalone tools. (A Signal based on it will also be provided on Mt4 Market in the future). It is designed around a combined form of hedging and martingale techniques and uses sophisticated algorithms and filters to place the trades. It uses Stop loss and Take profit levels while Lot size is calculated automatically following the according multiplier settings. We consider it a toolbox for every seasoned trader. Made with Gold market in mind, it can be tested in other inst

Area 51 EA generates signals on different strategies. Has different money management strategies and dynamic lot size function. When a position is opened, it is equipped with a take profit and a stop loss. If the position becomes profitable, a dynamic stop loss based on the specified values (TrailingStep and DistanceStep) will be set for it and constantly trailed. This allows you to always close positions in profit. If you want, that your manual opened positions will be handled by the EA, so you

This is a free demo version of the Replicator utility ( https://www.mql5.com/en/market/product/23028 ), which trades the minimum lot and only on EURUSD. The program is designed for copying your successful orders. The price is often fluctuates within a channel. But there is no time to place the next orders, especially if it happens at night. Place an order, when it closed with profit, the program repeats your order as a pending limit order. This will continue until the order closes with a loss, o
FREE

The program is designed for copying your successful orders. The price is often fluctuates within a channel. But there is no time to monitor the terminal and place the next orders, especially if it happens at night. Place an order, when it closed with profit, the program repeats your order as a pending limit order. This will continue until the order closes with a loss, or the price goes too far away and the pending order will not trigger. An offset is provided for inclined channels. The order wil

SRP (Strong Retracement/Reversal Points) is a powerful and unique support and resistance indicator. It displays the closest important levels which we expect the price retracement/reversal! If all level are broken from one side, it recalculates and draws new support and resistance levels, so the levels might be valid for several days depending on the market!
Key Features You can use it in all time-frames smaller than daily! Displays closest significant support and resistance levels Update the l

Djinn EA is a fully automated trading robot. Djinn expert system analyzes situation on the market and opens positions in a trend direction. The EA is optimized for GBPUSD pair. When used on H1 chart it is prepared to gain profit in long-term period. Recommended charts are M1 and H1.
Settings Lot - volume of the opened position MaxTrades - maximum number of opened buy or sell trades Maxspread - maximum allowed spread Global_TakeProfit - set to True if you want to automatically close orders when

The indicator allows you to quickly switch from one instrument to another, from one time period to another using the keyboard or buttons on the monitor. Each command can be assigned a hot key from 0-9, a-Z (case-insensitive) and VK_OEM_COMMA ("<" on the keyboard) and VK_OEM_PERIOD (">" on the keyboard). This can help you to operate the maximum number of instruments that are available at your broker, analyze more instruments/periods in less time. This product cannot be tested in the tester , beca
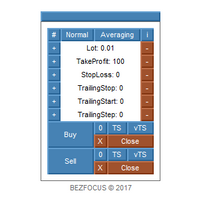
Trading panel for scalping.
Features Two languages (English, Russian). Adjustable panel scale. Two color schemes. Virtual trailing stop. Trailing stop. Averaging.
Parameters Lot - lot size. Lot Button Step - step for changing the lot size using buttons. Take Profit - take profit. Take Profit Button Step - step for changing the take profit using buttons. Stop Loss - stop loss. Stop Loss Button Step - step for changing the stop loss using buttons. Trailing Stop - trailing stop. Trailing Stop B

A combination of trend, pullback, range breakouts and statistics in one indicator Mainly functions as an Entry indicator. Works in any pair and timeframe.
Suggested Combination Cluster Helix with Strength Meter Strategy: Confirm signals with ideal strength levels Watch Video: (Click Here)
Features Detects range breakouts on pullback zones in the direction of the trend Analyzes statistics of maximum profits and calculates possible targets for the next signal Flexible tool, can be used in many

The YFX Symbol Watermark indicator is used to display a watermark on your chart, which makes it easy to see at a glance the symbol information for any chart. The displayed information includes: Symbol Name and Timeframe on the chart Description of the currencies Tag line, which can contain any user-defined information All the information can be displayed on the chart so that it can be easily read. The indicator also has parameters that can be set to customize which information is displayed. Para

MACD ColorBars paints bar frames according to a trend, as well as changes the histogram color when MACD bars are rising or falling (if Color Bars is enabled in the inputs window). The growth of bars indicates a divergence between the fast and slow moving averages, while the decrease indicates their convergence.
Parameters
Fast Moving Average - period of the fast moving average; Slow Moving Average - period of the slow moving average; MA method - moving average smoothing method (simple, expone

Measures the length of the selected movement in points, shows the duration of the movement, as well as the speed of movement. Outputs the average value of each dimension.
It is designed to calculate the expected target based on typical market movements.
The intended goal will provide information about the ratio of the stop size to the possible profit and will allow you not to open positions with a small expected profit.
It will also help you determine the point at which it is more logical t

Twins RSI 基于 RSI 指标的振荡器。 设置: 价格 - 使用的价格。它可以是以下值之一: PRICE_CLOSE - 收盘价; PRICE_OPEN - 开盘价; PRICE_HIGH - 期间的最高价格; PRICE_LOW - 期间的最低价格; PRICE_MEDIAN - 中位数价格,(高 + 低)/ 2; PRICE_TYPICAL - 典型价格,(最高价 + 最低价 + 收盘价)/ 3; PRICE_WEIGHTED - 加权收盘价,(最高价 + 最低价 + 收盘价 + 收盘价)/ 4。 RSI_PERIOD - 计算指数的平均周期。 K 是动力学系数。 模式 - 平均方法。可以是以下任何值: SMA - 简单; SMMA - 平滑。 Twins RSI 基于 RSI 指标的振荡器。 设置: 价格 - 使用的价格。它可以是以下值之一: PRICE_CLOSE - 收盘价; PRICE_OPEN - 开盘价; PRICE_HIGH - 期间的最高价格; PRICE_LOW - 期间的最低价格; PRICE_MEDIAN - 中位数价格,(高 + 低)/ 2;
YTG cci 具有基于 CCI 指标的动态水平的振荡器。 设置: CciPeriod - 计算指标的平均周期。 价格 - 使用的价格。 AvgPeriod - 计算指标平滑的平均周期。 AvgMethod - 计算指标平滑的平均方法。 MinMaxPeriod - 计算动态水平的周期。 _levelUp 是顶级值。 _levelDown 是较低级别的值。 YTG cci 具有基于 CCI 指标的动态水平的振荡器。 设置: CciPeriod - 计算指标的平均周期。 价格 - 使用的价格。 AvgPeriod - 计算指标平滑的平均周期。 AvgMethod - 计算指标平滑的平均方法。 MinMaxPeriod - 计算动态水平的周期。 _levelUp 是顶级值。 _levelDown 是较低级别的值。
Eureka OpgtsFx is a Custom Indicator created to alert the trader when there is a cut-across trend correlations from Daily (D1) to Monthly (MN) Time frames with the belief that the major trend dominates the market and also save the traders from being eaten for breakfast by the big dogs in the financial industry. This indicator is suitable for both the Swing and the Long term Traders due to their peculiar styles of trading and waiting for days, weeks or probably months before taking their profits

The PriceAction_Helper indicator automatically recognizes Japanese candlestick patterns on charts. The indicator marks the location of a candle pattern and indicates the most likely price direction based on that pattern.
Who can use the indicator If you are a novice in trading Japanese candlesticks, PriceAction_Helper will help you detect patterns, demonstrate how they work and enable you to memorize candle pattern types and names. If you are an experienced trader familiar with Price Action, t
Auto-closing a trade using candle Сlose price based on a timeframe opened.
No need to set TP/SL point Make sure connection and PC are always ON (I recommend using 99.9% up-time VPS) Only support for one direction ticket only, if buy and sell ticket exist at the same time, the EA will not activate The EA will automatically activate if the conditions are met
Input NumberOfTry - number of retries if order trigger failed
Condition For Buy Ticket Blue line must be ABOVE the current price Blue l

The trend beads indicator is software that does not include trend indicators such as moving average, Bollinger bands. This indicator works entirely with price and bar movements. The purpose of the indicator is to calculate the most likely trends. To assist the user in determining trend trends. The user determines the trend direction with the colors on the screen. You can use this indicator alone as a trend indicator. Or with other indicators suitable for your strategy.
Trade Rules Rising trend

Golden Monowave is monowave indicator, the monowave theory is one of Elliott wave approach and one of most complicate and accurate method. Golden Monowave can shortcut many major steps to identify and describe the monowave. It works on any timeframe and with any trading instrument, including currencies, indices, futures, etc.
Input Parameters initial_Bars - set the initial number of bars to calculate. wave_color - select the color of the wave. label_color - select the color of labels. temp_lab
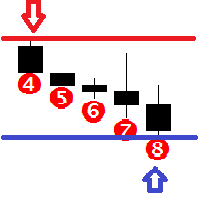
Features This indicator determines consecutive bullish and bearish bars; Determines the High and Low for the last N bars (N can be changed in the settings); It shows the Buy and Sell signals based on the values of other indicators, such as Bollinger Bands, Stochastic and MACD; It graphically displays from 4 to 12 consecutive bullish and bearish bars with an alert; It is possible to disable the alert and unnecessary graphical elements; It is also possible to adjust the number of bars in history,

Super Trend Bars is a trend finding indicator. It tries to find the trends that are most likely to trend. A set of indicators and a set of algorithms. Trend probability changes color when it finds a high trend. The red color represents the declining trend. The lime color represents the upward trend. Super Trend Bar changes color when it finds a trend.
Features This indicator is a trend indicator by itself. It can operate without the need for additional indicators. When you see the first lime c

Background It only needs a small initial deposit. Suitable for multi-currency trading. Real account monitoring: https://www.mql5.com/en/signals/294440
Operation Principle The EA opens orders based on a built-in indicator. The EA determines the order with the greatest negative profit each tick. Then the determines the total profit of Buy and Sell orders on each currency pair. If the total profit of Buy or Sell orders on each currency pair plus the amount of the order with the greatest negative
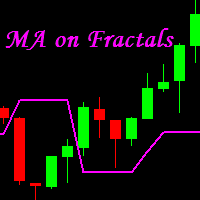
MA on Fractals is a professional trend-following indicator for MetaTrader 4 . It builds a moving average using Bill Williams' fractals. We believe that MA on Fractals is much more efficient than a standard moving average. Its combination with other indicators allows receiving more accurate trading signals. It is most suitable for M15, M30, H1 and H4.
Advantages Unique indicator. Generates minimum false signals. Suitable for beginners and experienced traders. Simple and easy indicator configur

The EA consists of multiple virtual Prototype-1 robots (up to 100 strategies depending on the currency pair). Each strategy has different settings. Once the lot sizes for all strategies are calculated, the EA obtains the resulting trading lot. The operation principle is trading within a corridor. When leaving the corridor, the EA closes the positions and saves them for opening in the future. The best condition for trading is a flat, the worst condition is a long trend without rollbacks. Recommen

The Expert Advisor of the Forex Fraus family, the system is designed for scalping and adapted for the accounts with fast execution of orders.
Operation Principle It buys and sells based on the values of the internal indicator; When a signal is received, the orders are opened by injection, using tick data; Always sets a stop loss; Positions are closed by Trailing Stop; Not closed positions are closed at the opposite trade; Built-in adjustable risk management block. Depending on the balance, it
MetaTrader市场是一个简单方便的网站,在这里开发者可以出售自己的交易应用程序。
我们将帮助您发布您的产品,并向您解释如何为市场准备您的产品描述。市场上所有的应用程序都是加密保护并且只能在买家的电脑上运行。非法拷贝是不可能的。
您错过了交易机会:
- 免费交易应用程序
- 8,000+信号可供复制
- 探索金融市场的经济新闻
注册
登录