适用于MetaTrader 4的EA交易和指标 - 216

Auto Fibonacci Button The Fibonacci retracement is a popular and reliable technical analysis tool for traders to determine support and resistance areas. It employs the "Golden Ratio," a mathematical pattern seen throughout nature and even the universe, to forecast particular levels of support level and resistance level. This tool is generated in technical analysis by dividing the vertical distance between two extreme points on the chart (typically a peak and a low) by the important Fibonacci
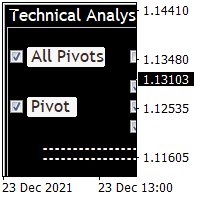
Technical Analysis 4 in 1 give you Pivot points, Resistances, Supports, Fibo, OHCL all together with any timeframe and you can back as you want in candles Pivot points have been a trading strategy for a long time. Using this method, you can understand where the market is going in a day through a few simple calculations. you can switch on/off any line you want. please check the pictures to understand more about this indicator.

这个多时间框架和多符号供需区仪表板指示器在价格达到供需区时发送警报。也可以使用它来提醒常规的双顶/双底而不是区域。它可以用于从 M1 到 MN 的所有时间范围。可以使用 RSI、背离(MACD、RSI 或 Awesome)和蜡烛图过滤器(pin bar、吞没、镊子和晨星/夜星)来仅过滤掉最强的设置。结合您自己的规则和技术,该指标将允许您创建(或增强)您自己的强大系统。 在产品博客 的末尾,您将能够下载示例智能交易系统 (EA) 的源代码,该示例使用 iCustom() 函数从指标获取交易信号。尽管 EA 功能齐全,但主要目的是使用代码并将其粘贴到您自己开发的 EA 中或将您自己的额外进入/退出逻辑添加到此 EA 中。鉴于我的时间有限,我将无法提供任何编程支持。我很抱歉。
特征 这 足以放置一个指标图表上,你会出现在仪表板的任何新的信号接收警报。支持所有 Metatrader 原生警报类型。
可以选择要在仪表板中显示的时间范围。 在仪表板内持续执行发散等级排序。可以禁用此排序,以便更轻松地找到特定符号。然后,交易品种将按照它们在交易品种参数中输入的相同顺序显示,或者按照它们在市场报价窗
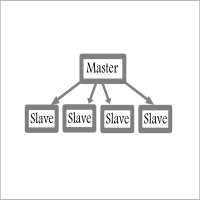
Fast / Reliable / Multi Functions / Simple To use local MT4 to MT4 | MT4 to MT5 platform copier , it will copy all your Master account orders into any Slave accounts very fast , no delay, Also it supports any kind of orders/ExpertAdvisors such as Buy / Sell / BuyStop / SellStop / BuyLimit / SellLimit / Smart Partial Closing / opened in Hedge mode / opened in Martingale mode / Modifying Pending orders / Modifying StopLoss-TakeProfit .using it is simple , Just drop the EA on Master account which y
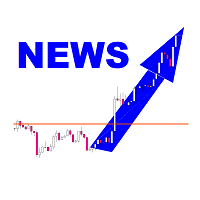
The Expert Advisor trades on market surges, while not using any indicators. The Expert Advisor analyzes the speed of price movement and if the price starts moving faster than the set one, opens a position in the direction of price movement. Trades are closed by SL TP and trailing stop. If the averaging is set to greater than 0, then the stop loss is not set, but new deals are opened with an increased lot and averaged.
Parameters:
Lot = 0.1; LevelNewse = 50; strength of the news (price jumps i

The “Market maker move" indicator is written for trading GOLD on M5 The indicator perfectly confirms the rebound or breakdown of the support and resistance levels. The indicator does not lag, does not redraw, and does not change values during testing. With proper use of the “Market maker move" indicator, you can trade almost without drawdown. To do this, you just need to plot the support and resistance levels on the chart. The “Market maker move" indicator is a powerful assistant for trading. Th

The indicator implements a kind of technical analysis based on the idea that the market is cyclical in nature. Tracks the market trend with good reliability, ignoring sharp market fluctuations and noise around the average price. Thus, all intersection points will be optimal points at which the movement changes taking into account the indicator period. It catches the trend and shows favorable moments of entering the market with arrows. Crossing points can be used as potential market reversal poin

Determining the market trend is an important task for traders. The Inside indicator implements an improved algorithm for visualizing the market trend. The main purpose of the indicator is to evaluate the market on small timeframes (i.e. M1, M5 and M15) for scalping. If you are a scalper looking for a reliable indicator to improve the quality of your trading, Inside is what you need. The indicator works in a separate window, showing red and green bars on the histogram. Two consecutive green (red

Professional robot DirectionClassic, which implements a strategy for trading in the moving direction and price. When the moving average and the price cross each other, a buy or sell signal is generated. The direction of the signal is set in the settings. The EA handles errors correctly and works reliably with capital from 100 USD. It is important to choose the direction of work, either in both directions, or only for the purchase or sale. The Expert Advisor uses basic concepts: breakeven, trail

The Expert Advisor is based on the idea of finding overbought / oversold prices using DeMarker values. The moving average of the older TF gives a more effective result. Expert Advisor is flexible for settings on various pairs. It can work on DeMarker signals with 1 timeframe or two higher TFs. No stops are provided. Sends reports to Telegram in testing mode. The chart icon at the beginning of the line indicates that Moving Average was used. Description of fields: Lot Type: fixed or% of the ba

A professional robot that implements the classic trading strategy based on the Bands indicator. A signal is generated when the price bounces off the borders of the Bollinger Channel. When the price breaks or touches the upper Bollinger band and then comes back, it serves as a sell signal, if the price breaks or touches the lower Bollinger band, it serves as a buy signal. The Expert Advisor handles errors correctly and works reliably in the market. Works with capital from $ 100! It is important

A professional robot that implements a trading strategy for the 3rd RSI at different time intervals. Signal from the RSI exit from the overbought / oversold zones, the levels of which will be the levels with the values of LevelMax and LevelMin and with indices 1,2,3 according to the number of time intervals. Buy when the entire RSI first drops below certain levels (LevelMin), and then rises above them. Sell when the RSI first rises above certain levels (LevelMax), and then falls below them.

Greetings to you!
I want to present to your attention a new product. It's not just an indicator - it's a whole system: a mix of several CCI oscillators , a signal moving average (MA) , an additional oscillator index (optional) and matrix calculations .
You don't have to do a complex analysis of the indicator. This system is equipped with arrows notifying about entering the position. It have are signals that will allow you not to follow the chart, in fear of missing the entrance to the mark

[ MT5 Version ] How to trade using the Fear and Greed Indicator: Click here Uncertain about when to take total or partial profits? The Fear and Greed is your reliable companion for making confident trading decisions. This innovative tool offers unparalleled insights into market sentiment, helping you identify key pivot zones and optimize your trading strategy. Why Choose Fear and Greed? Revolutionary Market Insight: Sentiment Analysis: The first indicator for that reveals the market's Fear and

The expert works on the Fibonacci levels on the previous candle With some digital way to enter the deal On the five minute frame Work on currency pairs only Do not use TakeProfit or Stop Loss How the expert works It is placed on the three currency pairs GBPUSD GBPJPY GBP AUD Same settings without changing anything When he works, he will work on only one currency of them until it closes on a profit Pursuing the profit from the trailing stop within the expert programming Explains how the expert w
Account protection
BULL BEAR GOLD MT4 is a fully automated expert advisor. by using candle value patterns to enter trades And there is a system of balance lots to increase profitability according to the size of the account (adjust the risk accordingly).
Feature No martingale Trading using candlesticks and trends It takes time to place an order with high accuracy. There is a system to open orders to increase profits when the wrong way. Money management Dynamic lot size based on balance Hedgi

This is a simple yet really handy assistant. It is useful if you want to close all positions on the market when a definite sum of the free margin is reached. Just place the assistant on a free chart and set a closing amount. All positions of all symbols will be closed when this amount is reached. At that, you don't have to sit by the monitor waiting for a good moment. The EA will do it for you.

Professional robot Forgotten Technology, which implements the classic trading strategy. The signal is generated when the Alligator's trend changes. When the Jaw, Teeth and Lips are closed or intertwined, the Alligator is about to sleep or is already asleep. When he sleeps, his hunger increases - the longer he sleeps, the more hungry he will be when he wakes up. When he wakes up, the first thing he does is open his Mouth and start yawning. Then he begins to smell the smell of food: bull meat or

The correlation coefficient reflects the relationship between two values. It shows the dependence of changes in one value on changes in another. For example, from changes in the price of EURUSD and EURNZD. The correlation coefficient in trade, currency relations is constantly changing. Special indicators of correlation help to define it, trace changes, draw correct conclusions. One of them is the Hubbles Correlator indicator. The indicator allows you to simultaneously display several other char

Colored candlesticks showing the trend based on two moving averages and the slope of the slow moving average. For long term trends use Period2 = 200. Convenient to filter trends according to your trading strategy The time unit also depends on your trading style Gives you a signal for each trend, displayed on the screen coloring the candlesticks. No sound signal; no push notification; these functions will be there in the next updates

A technical indicator that calculates its readings based on trading volumes. It has an oscillatory line that follows the change in volumes.
Large arrows on the line indicate reversal values. A channel is built around the line with small arrows showing the strengthening of price movement in the direction of increasing volumes.
The indicator does not redraw values. Works on any instrument and timeframe. It can complement any trading strategy by finding a trend or make entries in the direction of a

the indicator will show signal arrows on the graph at the crossing two EMA it has push and audible alerts. By crossing above each others , a blue arrow will come out for the BUY, at the same time an audible signal will sound. By crossing Below each others, a red arrow will come out for the SELL, at the same time an audible signal will sound. Possibility to deactivate push and audible alerts.

the indicator will show signal arrows on the graph at the crossing of Awesome Oscillator base level it has push and audible alerts and Email alert. By crossing above base level , a blue arrow will come out for the BUY, at the same time an audible signal will sound. By crossing Below base level, a red arrow will come out for the SELL, at the same time an audible signal will sound. Possibility to deactivate push and audible alerts. MT5 version : Buy the 'Awesome cross MT5' Technical Indicator fo

The Expert Advisor is based on a long-term study of the volatility of the # DAX30 index. The Expert Advisor opens no more than one deal per day. If there is no signal, the deal will not be opened.
IMPORTANT!!!! if there is an already open deal, the EA will not open a new one. Even if you opened a deal manually, the EA will not open a new one. made for the purpose of security of the deposit and opening in opposite directions.
FOR THE EXPERT TO WORK, THERE SHOULD NOT BE OPEN DEALS IN THE TERMINA

Professional robot Forgotten Technology, which implements the classic trading strategy. The signal is generated when the Alligator's trend changes. When the Jaw, Teeth and Lips are closed or intertwined, the Alligator is about to sleep or is already asleep. When he sleeps, his hunger increases - the longer he sleeps, the more hungry he will be when he wakes up. When he wakes up, the first thing he does is open his Mouth and start yawning. Then he begins to smell the smell of food: bull meat or

the indicator will show signal arrows on the graph at the crossing of MACD level it has push and audible alerts. By crossing from low to high level 0, a blue arrow will come out for the BUY, at the same time an audible signal will sound. By crossing from low to high level 0, a red arrow will come out for the SELL, at the same time an audible signal will sound. Possibility to deactivate push and audible alerts.
MT5 : Buy the 'MACD Arrow' Technical Indicator for MetaTrader 5 in MetaTrader Marke

Main features: I nforming via telegram buttons content and closing orders for one of the pairs or all necessary orders. Alert and information buttons to the telegram window when the specified percentage of profit is reached for each pair, or for two at once. The telegrams "sleep" while no profit we need, when a profit is reached, a menu of 5 buttons appears, in each button the profit will be displayed both in currency and in %%. When you click on the button, the direction of orders for this pa
初學者日間交易的外匯指標。當價格轉向另一個方向時,該指標以箭頭顯示。此時,您可以達成交易。該指標在 H1、H4 時間範圍內交易。該指標還用線條顯示趨勢方向。白天,您可以按照趨勢方向開單,並設置至少 15-20 點的止盈點。當一筆交易被止盈平倉時,您會立即按照指標線的方向開啟另一筆交易。
初學者日內交易指標的工作原理: 該指標是一個現成的交易系統。您不需要使用其他指標來分析市場。使用日間交易初學者指標進行交易就足夠了。該指標用箭頭顯示市場轉向的方向。線條顯示市場的發展方向。您需要在市場走勢的方向上開單。訂單必須伴隨空頭獲利。
指標設置: fast_period - 快速時期。 slow_period - 慢週期。 bars - 指示指標將在圖表上顯示的柱線數。 signal - 發送推送和電子郵件信號。

This is a fully automatic forex robot optimized for EURUSD M30. It can trade on both sides at the same time. It uses a dynamic grid and a sophisticated martingale system. It has separate money management for first trade and for martingale trades. This system is not slip sensitive and will work well for all brokers. Settings Start and end of trading Trading TimeFrame Use RSI filter RSI settings ::::::: Money management
Lots – starting lot Autolot balance – automatic calculation of the initial lot

High Probability Reversal Indicator The indicator looks for trend exhaustion areas, and plots Buy/Sell arrow after confirmation of trend exhaustion. Signals can also be shown as popup alerts, or be sent as e-mail or mobile phone notification. Trades can be taken on breakout of the signal candle. Inputs
Signal Type: Aggressive/Normal History Bars : Can be set to 0 (zero) to show all historical signals, or can be set to a limited number of bars for faster execution. Show Alert : True/Fal

===== NEW YEAR 2023 PROMO PRICE TILL END MONTH IS 4.999$ or 10 Licenses ================== REGULAR PRICE 4.999$ PPttraderEA45 is an EA developed on the basis of years of PROFESSIONAL experience It is based on the original INDICATOR and runs on the composite batch size which will give you EXCELLENT results, as you can see by doing Backtesting The minimum and recommended DEPOSIT is only $ 100 USD It is a RISK strategy, but if you are PATIENT, the profits will come
EA supplied in SETUP Plug and Pl

Meta Trend Indicator is an efficient way to forecast and detect the trend in any market. It reveals the trend, support and resistance levels, volatility and the maximum potential target, all in one indicator. To adapt to the price and to decrease consecutive trend failures, the internal trend detector algorithm studies the market and dynamically chooses the right values for the internal parameters. This indicator is a perfect trend filter for any strategy or expert advisor. Features Super Adapti

The trend in the market can be predicted using trend lines but the problem is you don’t know where exactly the price is going to touch the trend line where you can put your pending orders on. Smart Channel Expert Advisor makes it possible to put an advanced channel around the price data, which can be configured to handle placing orders, opening and closing positions, managing risk per trade, spread, slippage, and trailing stop-loss and take-profit automatically. Features Money Management (Calcul

我们只在 MQL 市场上销售产品,如果您看到某处以更便宜的价格转售,那一定是 假冒的。 并且 100% 确定性能不是真实的 .也不会得到我们的支持。我很高兴加入我们的游戏,不要冒险购买 假冒版本 。 允许提升性能 ,购买后请联系我了解如何获得免费版本的指标和每日分析。 升级 4.0 到所有对也很好用。 如果你想提高你的 手动交易技巧 , YOLO是你训练手动交易的好工具,如果你的决定不是太可怕,YOLO会帮助你TP,你就可以开始你的下一个决定了 购买免费版指标后PM我 说明:这里 信号监视器: 这里 与指标的最佳匹配: 这里
YOLO的概念:
您每天都投票,如果您的决定与我通过单击“买入”或“卖出”-> 开始交易在 YOLO 中编码的趋势相匹配! 这是为了长期保护您的帐户(根据我的信号,每月超过 140%) YOLO 是一种安全的鞅策略,但易于在 XAUUSD 和所有货币上使用。也供手动用户使用图表上的面板进行交易。
全自动交易方向与趋势,以防止大幅回撤 交易面板供用户选择方向 所有隐藏的 TP 和隐藏的盈亏平衡价格 移动应用订单控制 (

This Expert Advisor is able to independently adjust to a volatile market. It determines the best parameters for trading by counting over a certain history which candles, levels and indicator readings are most suitable for opening a position. This makes it possible to optimize parameters manually less often and, probably, to trade for longer without losses despite the market changes. However, not all parameters are automatically optimized, it is necessary to set deviations of indicators from the
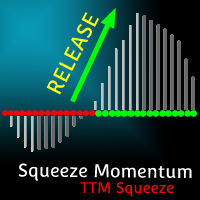
MT5 Version TTM Squeeze Momentum
TTM Squeeze Momentum is an enhanced indicator ideal for recognizing consolidation periods in the market and the start of the next explosive move. This improved version is a volatility indicator based on John Carter's "TTM Squeeze" in which the histogram is based on a linear regression rather than a simple momentum indicator. Red dots on the middle line indicate that the market has entered a "Squeeze" zone or consolidation period, indicated in this enhanced versi

the first release of the new year's special promo price.normal price 150 USD. important user guide is here https://heyzine.com/flip-book/62a16c6955.html indicator to speed up finding support and resistance price.very easy to use very neat interface.doesn't display unnecessary confusing things.uses basic trading strategies for professional traders.....happy trading if something is still not clear,please contact me personally,i will reply later

Real Forex EA is fully automatic EA that works with candle based strategies. It uses Weekly, Daily, 4-hour, and 1-hour time periods. Strategies are built on finding the right entry points. EA has 5 different TP strategies. It works with 10 symbols. EA has both single mode and multimode feature. If the drawdown is low, it works in single mode. If the drawdown is high, both single mode and multi mode work at the same time.
Recommendations and features It works in the H1 timeframe . Symbols= EUR

No price discounts. No Black Fridays, no Christmas deals – simply put, no promotions at all. No one will be disadvantaged. The price will be fixed for everyone. If you have any questions, I’m always happy to help, so feel free to contact me.
I believe that markets function as people do, so if we’re capable of understanding them in the present moment, why not take advantage of it, right? TREND IS MY FRIEND! It is trend system, which is based on trend indicators. Works very well on bitcoin and e

Канальный индикатор "Snake" . Отлично показывает точки входа и выхода.
Не перерисовывает!
Хорошо подойдет для стратегий с сетками (усреднения), стратегий с пирамидами (стратегий добора), обычной торговли по тренду, торговли на коррекции.
Для любых типов инструментов: валюты, нефть, металлы, криптовалюты. Для любых таймфреймов: от M1 до D1 . Для любых стилей торговли: скальпинг, интрадэй, свинг, долгосрок .
Используйте в сочетании с трендовым индикатором, чтобы исключить риски входа про

Orion I is a multi-strategy Expert Advisor: 13 different strategies has been embedded into a single Advisor with a logic able to select the best algorithm for each market phase! Multi-strategy allows to achieve a smooth equity line keeping at the same time the risks at an acceptable level. Money Management is based on fixed lot size OR fixed risk (i.e. maximum risk per trade expressed as % of available balance). This EA has been developed for EURUSD with 1H time interval. Can be used on other

Нестандартный индикатор определения текущего тренда. Альтернативный подход к определению текущей рыночной тенденции. В основе лежит уникальный алгоритм. Не используются скользящие средние , осцилляторы , супер-тренды и прочие стандартные индикаторы.
Для таймфреймов: от M15 до D1 . Для стилей торговли: интрадэй, свинг, долгосрок .
Может стать готовой торговой стратегией совместно с любым канальным индикатором. Например таким, как индикатор "Snake" . Внимание! Это индикатор, а не советник,

This Trading bot will always get updated, that is why the monthly fee is placed. *I Will be adding more Features and Videos from customers' feedback on how they would like to improve on this.
This is based on the Martingale Custom Strategy but could be used as an Indicator for your Entry Point to have a HIGHER SUCCESS of a CALCULATED OUTCOME. * DO NOT TRADE AGAINST MATHEMATICS* I have YOUTUBE Videos that will show you how each step works. Look at Part1-Part5 VIDEOS to see how this ea. FOR NOW

如果您一直在尋找新的交易機器人並想長期購買外匯顧問,那麼這個交易機器人就是為您準備的。它可以滿足大多數交易者的要求,包括初學者和專業人士。我在為自己和訂單開發交易機器人方面有多年的經驗,我明白我在說什麼。您可以在我的個人資料中找到有關我的信息。
如果您想收到禮物,請在購買後寫信給我!
專家的主要優勢:
一個交易機器人中的多種交易策略。
即使在市場發生變化並且這種或那種策略停止工作之後,您也不再需要花錢購買其他機器人。如果所需的策略還沒有在機器人中,那麼寫信給我,如果有希望,那麼我會將其添加到顧問中。您可以在此處找到交易策略列表、未來修改和參數的完整 描述 。
剝頭皮交易、馬丁格爾交易、網格交易。
您可以僅使用一個訂單或一組訂單設置交易。具有動態、固定或乘數步長和交易手數的高度可定制的訂單網格將允許您使 EA 交易適應幾乎任何交易工具。
回撤系統,不盈利的訂單重疊和余額保護。
網格交易易受非反彈價格變動的影響已不是什麼秘密,但由於訂單恢復系統,顧問將能夠擺脫大多數回撤。回撤的退出是通過將最遠的不盈利訂單與最接近市場的盈利訂單重疊來執行的。交易機器人可用於恢復賬

Great Bird expert advisor using a scalping system with low DD. has StopLoss and TakeProfit features automatically set by the algorithm. you can also set StopLoss and TakeProfit manually. The Expert Advisor does not need complicated setup and is ready to be used for all currencies Use Timeframe M5 account ECN recommendation Minimum account balance $ 100 (for one pair)
The Expert Advisor does not use: Grid Averaging Martingale Doubling
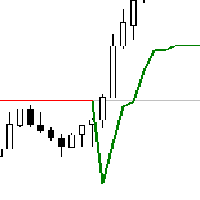
Based on supertrend indicator ,
get alert based on trend change of very popular SUPERTREND indicator..
Supertrend indicator can be used for both trend change setups or inline trend confirmation can be seen as trend continuation. providing as better entries and exits. or you can use supertrend indicator also as dynamic support and resistance zone.
When applied to chart Dashboard will scan and show current position of price with respect to supertrend indicator , and you will be able to get

The Qv² Trend is an indicator that aims to identify trends.
Buying trend signals are indicated by arrows pointing up.
Selling trend signals are indicated by arrows pointing down.
It can be used in all deadlines.
It can be used in all pairs.
I use it on the H1 with a period of 24.
Important note: I recommend using it in markets that naturally show trends. For in range markets I present my other indicator on this link OBOS

这是一款真正的趋势跟踪交易系统,它能够让你不错过重大的趋势行情! 它通过均线系统进行开仓,并会通过ATR和你的余额来自动计算头寸规模单位,目的是让一倍ATR相当于账户净值的1%,加仓方式为金字塔型浮盈加仓,行情每顺势移动0.5ATR则加一层仓位,如果开仓后行情反向运动则会止损(默认单笔交易最大亏损为1%),你能够自定义单个品种的最大仓位和所有品种的最大仓位。 本趋势系统并不能保证能够在单个品种上的稳定盈利,因为在震荡行情中趋势跟踪系统会进行反复止损,我承认这是均线系统的通病,这无法避免,因此最好同时运行在多个不同的品种的图表上(请选择高流动性和松散关联的多个市场),以便不错过每一个趋势行情。 如果你想通过一款趋势交易系统在趋势行情中,代替你人工盯盘进行交易的话,这将会是一款非常合适的交易系统!
注意!!!外汇品种大多数震荡行情较多,容易造成反复止损!!
参数说明: minBalance:账户最小余额 Maximum Number Of Positions:单个品种的最大头寸单位,多单和空单各N个 StopLoss (nATR):止损为N个ATR Scale Out Of Posit
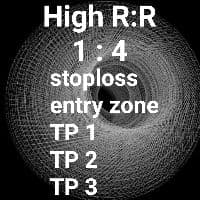
斐波那契突破是一种使用斐波那契回撤的交易策略。这种技术实际上是一种让我们进入趋势开始的技术。即使是初学者也很容易理解。 策略是您只需要等待自动自定义斐波那契出现,然后手动下达您的挂单,在斐波那契水平止损和获利。当价格成功重新测试时,该头寸将被打开。斐波那契突破适用于外汇、加密货币和股票。 斐波那契突破水平详细信息: 1- 监控交易 = 0(可以是止损水平) 2- 进入区域 = 0.50 – 1.00(当价格在区域内时进入) 3- 获利区 目标 1 = 1.618 目标价 2 = 2.618 目标价 3 = 4.236
标准操作程序 (SOP) • SOP 非常简单易懂。系统将识别存在: 1. 初始中断 (IB) 或显性中断 (DB) 2. Candle Break 1 (CB1) - 标有蓝色或红色的 X 符号(实际上是之前 ABC 模式的 B 点) 3. 重新测试(斐波那契水平 0.50 – 1.00) • 当三个条件都满足时,SOP 就完成了。斐波那契将出现在图表上,给出入场区域 (EZ)、止盈 (TP) 水平和止损水平 (SL)。 • 如果遵循 SOP 和资金管理

专家顾问根据我的作者的蜘蛛交易系统坚持切入点,该系统基于在趋势运动出现时找到交易的最佳切入点。 要搜索趋势,使用我的作者的指标,加上有一个卡通趋势指标,从更高的时间框架确定趋势。
此外,如果价格与一般信号相反,顾问会输入一个订单网格,但与此同时,如果有相反趋势的新信号,顾问会打开新的交易,从而分散风险。 机器人是如此的数学配置,只有当价格对信号超过5000pp时,才有可能失去存款,即市场上会出现"黑天鹅"。 在任何其他情况下,它将稳步赚取你在一个全自动。 这将是一个极好的收入全额负债.
M5图表是为了顾问的工作,所以会有很多交易,而对于英镑/美元对
我们已经创建了近一年的顾问,我们一直在优化它,现在才准备将它放在这个资源上出售,因为我们确信它会带来稳定的利润。 我们的顾问自2021年11月以来一直在积极赚取收入,每月将持续从10-25%带来额外的确认!!! 此外,所有的优化和更新将完全免费提供给您,以及我们团队的持续技术支持。
还有,购买后私信给我写信,我会亲自帮你设置,安装在你的终端,配置好VPS,投入运行!!!
设置在屏幕上的存款deposit1000。 此外,如果

全自动高级交易机器人。它适用于经典鳄鱼指标的信号。为了平仓,它使用智能追踪系统或使用挂单进行平均。 优点:
全自动系统, 可定制指标参数, 内置自动手数计算, 直观的设置, 乘数设置, 简单的面板界面。 问题解决 -> 这里 / MT5 -> 这里 指标的本质: 鳄鱼指标由三个移动平均线组成。 下颌滑动较长(蓝色),牙齿中等滑动(红色),嘴唇快速滑动(绿色)。该指标有助于确定趋势的存在及其方向。 当绿色在上、红色在下、然后是蓝色时,趋势为上升。当蓝色在上面,然后是红色、绿色在下面时,就是下降趋势。当指标线交织在一起时,没有明显的趋势,市场处于横盘状态。 战略: 当指标显示趋势已开始并得到确认时,EA 将开立订单以延续当前方向。 也就是说,顾问顺应趋势进行交易。在一个趋势中,顾问只能打开第一个订单一次。也就是说,在关闭一笔订单或一格后,顾问将不会打开新订单,直到趋势改变方向。 改变趋势方向后,EA 会向相反方向开仓。 从某个位置退出: 顾问打开订单后: 1 - 如果仓位朝盈利方向发展,则激活追踪止损。该仓位将使用智能追踪系统进行平仓。 2 - 如果仓位亏损,则使用挂单应用平均函

Coral Trade Planner is a 3-in-1 tool for making smart trades. The Lot Size Calculator lets you determine the appropriate lot size based on risk, and see the impact on your risk as you change the stop loss distance and/or lot size. The Trade Planner is an innovative tool for visualizing your planned trades on the chart, and gives you immediate feedback on the value of the trade (both the risk of hitting your stop loss and the reward of hitting your take profit). Both Market and Pending order

FLEX REVERSE PRO - GBPUSD
Good evening everyone, I'm Tiziano and after over 2 years of modifications and backtesting today I present the definitive EA for GBPUSD which, as per the attached screenshots over the last 15 years, had a net profit of 13 million starting from a capital of 1000! In fact, already in 2009 it had reached a balance of € 800,000 but due to the broker's block at 100 pips per operation, it is not possible to carry out operations with greater lottery, if it had been possible

QV2 MA is an indicator that displays the results of two smoothed moving averages applied to Candles. Item 01 - Buy signal: Candle show color Aqua when the 4-period smoothed moving average is expanding and above the 24-period smoothed moving average. Item 02 - Sell Signal: Candle show color HotPink color when a 4-period smoothed moving average is expanding and below the 24-period smoothed moving average. Item 03 - The gray candle is an undefined region.
When the candle is gray, there are two rec

This EA has a semi hedging character to minimize the risk of long floating. open trade parameters based on a special zone of my style of resistance support. The minimum resistance to use this EA is 10000 points with an average yield of 5% to 7% per month. If this EA is floating, it will look for a long moment for hedging floating recovery. .....................................
please keep yourself from anything products, everything have a risk.
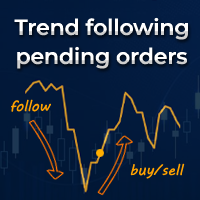
Trend following pending orders detect a group of orders opened by chart buttons and automatically follows market price.
Once your STOP or LIMIT orders are activated Trend following pending orders immediately adds STOP LOSS and TAKE PROFITS . Optionally you can add rule for closing all market orders when sum or price will reach your profit or loss. You can also enable trailing stop loss and traling take profit to market orders. It is a very handy tool in cases where you want to catch the perf

It's a smart Investing.com utility signal analyzer on MT4 chart during 28 pairs ,It uses all technical and candlestick patterns for each pairs to analyze the final trend ,You can use it as base entry signal for each pairs, It's easy to use ,You must add the address ' https://www.investing.com/ ' in the list of allowed URL tab 'Advisors' , Added GlobalVariables for each pairs as buffer simulation to get data from any ExpertAdvasor for trading.
Setup
So to work with the server, you must add the U
用俄语写“重要通知 – 需要许可证和激活
激活说明:
完成购买后,请立即联系我们以获取您的许可证密钥、密码或激活详情。没有这些,软件将无法运行。我们将确保激活过程顺利,并协助您解答任何问题。
多语言定制 为了提升您的交易体验,我们提供软件的多语言完整定制。我们的团队可以提供以下语言的翻译: 中文 | 法语 | 葡萄牙语 | 西班牙语 | 俄语 日语 | 德语 | 韩语 | 意大利语 | 土耳其语
只需告知我们您偏好的语言,我们将调整指标以确保用户友好的体验。
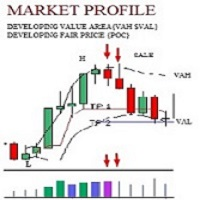
MT4 市场概况指标 – 高级拍卖市场分析 市场概况是一个强大的图表工具,使交易者能够观察驱动所有市场运动的双向拍卖过程。它可视化价格随时间的涨落,揭示群体行为和价格接受区域的关键模式。
本质上,市场概况是一个动态图形,持续记录和组织拍卖数据,帮助交易者精确地确定关键市场水平。
主要功能与概念 1. 价值区域 (VA) – 识别真正的市场平衡 价值区域表示包含一天交易活动中70%的价格范围,相当于价格分布的一个标准差。该区域突出显示大部分交易发生
This is a custom RSI of MA indicator consisting of 8 indices: AUDindex, NZDindex, CADindex, EURindex, CHFindex, GBPindex, USDindex and JPYindex. It can run on Forex brokers' servers having 28 currency pairs. No repaint.
How to Use When one of the 8 indices turns upwards, sell the strongest pair. When one of the 8 indices turns downwards, buy the lowest pair.
+ For newbies: Best trading has been detected on H1 chart in Euro session and US session to avoid sideways market Or use timeframe M5/M15

sarangani venom is 100% profitable, easy to use indicator, a chart without indicator is stressful and will lead you to many losses, this indicator is pleasing to the eye that will gives you more confident to trade when there is signal, your computer will gives sound and the spider will animate, it can be used to all time frame and to all currency, you have many options, when the candlestick touches to upper line it is buy, when it touches to lower line it is sell, when the rope is pull to buy ar

新的、更準確的 Xmaster 指標版本。來自世界各地的 200 多名交易者在他們的 PC 上對該指標的不同組合進行了 15,000 多次測試,以獲得最有效和最準確的公式。在這裡,我們向您展示“Xmaster 公式指標外匯無重繪”指標,它顯示準確的信號且不重繪。該指標還通過電子郵件和推送向交易者發送信號。隨著每個新報價的到來,它不斷地通過超過 75 個參數分析市場,並向交易者顯示準確的買入和賣出信號。此外,在該指標的幫助下,您可以看到趨勢現在朝著哪個方向發展,以便在正確的方向上進行交易。 新的“Xmaster 公式指標外匯無重繪”指標如何工作,它與舊版本有何不同? 首先,它是最優化的市場分析算法,已被全球不同交易者測試超過 15,000 次。 其次,該指標配備了針對錯誤信號的獨特算法過濾器,這使其成為每個交易者非常有用的工具。它特別適合使用剝頭皮策略進行交易,因為了解價格的每日方向非常重要。而這個新指標很好地說明了這一點。 第三,與舊版本不同,這個新指標“Xmaster 公式指標外匯無重繪”向電子郵件發送信號並推送。為您的交易策略配備如此專業的工具,您一定會在交易中獲得巨大優勢,並能

Expert system BotMFI .
The most important characteristics for an expert are the ability to predict, that is, potential profit in the future, and not in the optimization period. To do this, you can simply check the Expert Advisor, cycle it through history in two stages. The first stage is optimization and sampling (according to one invariable rule). The second stage is the sweep. Thus, you can cycle through several times and draw conclusions. In this case, for optimization, an interval of one

Forex indicator " iron condor strategy " allows you to apply a very well-known strategy of options in the forex market. With the help of this indicator, you will know when to open a buy deal and when to open a sell deal. The "iron condor strategy" indicator shows you this information using the arrows on the chart. This will allow you to get information in which direction you need to open a deal by looking at the indicator signals in 5 seconds. Instead of analyzing the chart for an hour, now you
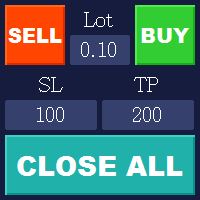
It is a simple fully customizable trading panel. It allows you to perform the simple trading operations on a trading pair / symbol, on the chart where it was placed: Buy, Sell, Close trades. The parameters are set in the panel: Lot size, Stop loss in points, Take profit in points. Thus, the panel allows you to open / close positions as quickly as possible with preset parameters. The panel is fully customizable and can be multilingual. When the panel is resized, all elements are resized automatic

Orion II is a multi-strategy Expert Advisor: 20 different strategies has been embedded into a single Advisor with a logic able to select the best algorithm for each market phase! Multi-strategy allows to achieve a smooth equity line keeping at the same time the risks at an acceptable level. Money Management can be based on fixed lot size or on a variable lot size. The lot size is determined according the a maximum risk % based on available Balance. The EA is set to use variable lot size with t

Possible Price reversals levels - based on Fibonacci + Support + Resistance Levels Auto levels drawn based on input index (Bars Count ) ---->>> Price Over 50% Fibo line ---> UP TREND ---> BUY when price drop near Support Lines ---->>> Price Down 50% Fibo line ---> DOWN TREND ---> SELL when price goes up near Resistance Lines
--->>> The more close price levels ----> the more possibility for price reversals --->>> are you a scalper --> try it on M1 charts with big index like 5000 bars or

Pulse Scalper EA works on the EURCHF currency pair. Working timeframe M1. The strategy is based on searching for and playing back strong price impulses in the opposite direction. Does not use tick history, uses only closed bars, so you can test using open prices. The Expert Advisor does not use dangerous trading methods that can destroy the deposit: grids, martingale, locking, sitting out without stops. Stops are fixed; in addition, a hidden algorithm is used to track positions, which closes

A professional bot that implements a trading strategy based on RSI and Envelopes indicators. The analysis is carried out by the levels of price intersection with the Envelopes lines, for a breakdown of any of the lines, if an upward breakdown then this is a buy signal, if a downward breakdown of any line is a sell signal. In this case, a breakdown of one of the RSI levels is also required. An upward breakdown of any level is a buy signal, and a downward breakdown of any level is a sell signal.
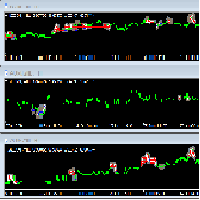
迈达克论坛交易记录复盘工具。 运行平台:MT4 迈达克论坛有很多优质的信号,如果你需要研究学习这些优质信号的交易轨迹,可以用这个工具进行复盘。 适用方法: 1、选择优质信号 2、选择“交易历史记录” 3、交易历史记录标签页右下角选择 导出至CSV历史,导出历史记录 4、将导出导出的CSV历史记录文件存放到MT4安装目录下的 \ MQL4\Files文件夹中。 5、运行程序,在参数表中输入历史文件名称,并点击确定。 6、软件自动在所选图表中绘出涉及到当前交易品种的交易痕迹。 说明: MT4,MT5信号均可在MT4上进行交易痕迹绘制。 多单蓝色显示,空单红色显示。止损红色表示,止盈蓝色表示。 在具体使用中有任何问题,可以联系我的微信gaoqing001

这是一个顺势网格交易系统,主要适用于震荡行情,开单方式是先分别通过“ADMI”的4H、24H、1W的时间周期共振确定趋势,再通过Stochastic指标寻找入场点。网格区间是通过订单的利润点数决定的,当订单的亏损/盈利点数达到了您设定的网格利润,则会进行开仓。如果趋势发生任一逆向转变,则会触发仓位风控,仓位风控的方式为,当ADMI任一周期不满足条件时,所有订单加起来的总利润点数大于网格利润就会平仓,你可以手动设置开单手数和网格利润,订单会自动在价格达到网格利润点时进行开仓或者止盈,该系统将在震荡行情中非常好用。 以下是参数说明: Lots:开单手数 GridProfit:网格利润 ADMI_Period:“ADMI”指标的周期 K_Length:KDJ的K值 D_Smoothing:KDJ的D值 K_Smoothing:KDJ的J值 MAX Account Loss:账户最大止损(该项为所有品种交易单的总止损) Maximum Grid Number:最大网格数,当仓位层数达到最大网格数量时,触发仓位风控
学习如何在MetaTrader AppStore上购买EA交易,MetaTrader平台的应用程序商店。
MQL5.community支付系统支持通过PayPay、银行卡和热门付款系统进行交易。为更好的客户体验我们强烈建议您在购买前测试EA交易。
您错过了交易机会:
- 免费交易应用程序
- 8,000+信号可供复制
- 探索金融市场的经济新闻
注册
登录