适用于MetaTrader 4的EA交易和指标 - 114
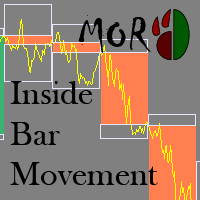
This indicator allows analyzing the movement of prices inside a bar. The indicator draws the contours of the bars of higher timeframes on the current chart.
Inputs Value TimeFrame - the timeframe to display bars NumberOfDays - the number of days the indicator calculates Bull_Body - the body color of the bullish bar Bear_Body - the body color of the bearish bar ShadowUp - the color of the upper shadow of the bar ShadowLow - the color of the lower shadow of the bar Selectable - enable/disable the
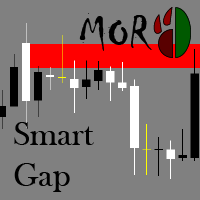
The indicator finds and visualizes price gaps, which often can be used as support and resistance levels. It can display levels from different timeframes on one chart.
Inputs Value Label - show/hide the timeframe of constructed levels TimeFrame - select timeframe to draw levels from DrawRangeDay - the length of the level in days DrawRangeHour - the length of the level in hours GapSizeForDrawing - a level will be drawn if gap is equal to or larger than this level in points CountDays - the number

This multicurrency strategy simultaneously determines the strength of the trends, entry points and the take profit levels for each trade. The indicator can determine entry points on any trading period from M1 to D1. For the convenience of users, the indicator renders the entry point (in the form of an arrow), recommended take profit levels (TP1, TP2, TP3) and the recommended stop loss level (SL1, SL2). The options for using the strategy are described below. Full description of the indicator Cosm

Features: Generates BUY / SELL Signals for easy to use: You do not need to read or understand market trend lines on indicators. Quantina Bitcoin Indicator shows a little Red Arrow for SELL and a little Green Arrow for the BUY entry points above- and under - the actual bars. (Green = Bullish Trend , Red = Bearish Trend). Measured Signal Strength also has written on the chart for advanced traders. Working on every known currency pairs: It's working on major-, minor-, and cross - pairs too. Also, Q

eaVeryActive is an Expert Advisor (Robot) for any financial instrument on the MT4 platform. All input parameters were optimized and used on EURUSD, M15 . Of course you are able to optimized those parameters for any currency pairs and time frames. The main input parameters are a, b, c, d, e, f, g and h , which can be any numbers in the range from 1 to 9 - input parameters (weight coefficients) of the one layer neural network. This robot will open as many position as you want by input parameter ma

This robot uses a unique algorithm to confine a prize zone and catch trends just from their starts. Using Bollinger Bands to detect the sharp lazer entry points. The major advantage of this robot is that It uses advanced money management system to avoid risky trading conditions and to harvest all profitable opportunities. USE recommended set in the comment section Strategy: Let us first agree on that, all straddle EAs are working by purely martingale formula. This would prepare the scene for a d

IlanisNeuro is a modification of Ilanis . The EA uses averaging. Neural network is used for opening positions. The network has been trained on seven major currency pairs (EURUSD, GBPUSD, AUDUSD, NZDUSD, USDJPY, USDCHF, USDCAD) for the period 2004-2017. Real account monitoring: https://www.mql5.com/en/signals/author/fastinvestments The free version of the Expert Advisor: https://www.mql5.com/ru/market/product/25165
Ilanis Expert Advisor Does not require setting the parameters. Ready to work on E

NIZMA is a ready-made trading system, that is the most efficient on the EURUSD, AUDUSD and GBPUSD currency pairs. The best timeframes are M5 and higher. The system shows the market entry points in the form of arrows, and also displays the information on the strength and direction of the trend. The signals are easy to interpret. It is suitable for both novice and professional traders. With the properly selected settings, it gives the minimum number of false signals. In tests, this number did not

The HeLL_Cat PRO Expert Advisor is a powerful trading tool, suitable both for professionals and beginners. Its arsenal includes various strategies - the HeLL_Cat mode, the Safe mode and the News mode. The PRO version differs from the standard version in the added functionality of settings. The complete list of differences can be found in the documentation for the EA. The HeLL_Cat mode uses the adaptive trading strategy based on a neural network consisting of 4 interconnected logical cores. A dis

The Expert Advisor trades two strategies, each designed for a particular market behavior. Using both strategies allows you to cover a significant range of trading time and get high and stable results. The Channel strategy is based on the principle of scalping within the channel bounds, during periods of low volatility. Trend strategy builds on the principle of following the trend in during the high volatility hours. The trading periods are selected based on the statistical and fundamental analys

The HeLL_Cat Lite Expert Advisor is a powerful trading tool, suitable both for professionals and beginners. Its arsenal includes various strategies - the semi-automatic HeLL_Cat mode, the Safe mode and the News mode. The semi-automatic HeLL_Cat mode uses the adaptive trading strategy based on a neural network consisting of 4 interconnected logical cores. Unlike the other versions, HeLL_Cat Lite does not open the first order, it only manages the orders opened by user. A distinctive feature of thi

The Magneto Precision Trend indicator is based on candlestick analysis. It determines the trend change on the previous candle, signal is not redrawn.
Indicator setup and use Increasing the Period parameter decreases the indicator sensitivity, resulting in less frequent changes in color but filtering the market noise. However, the trend change signals will arrive visually with a delay. And, conversely, decreasing the value of Period provides more accurate but more frequently changing signals. Th

The Magneto Reverse Signal indicator is based on the candlestick analysis. It identifies the reversal points.
Indicator setup and use Adjustment of the indicator is reduced to selection of parameters Period (left window of the panel) and Gate (right window of the panel). It is more convenient to adjust the settings using the control panel directly on the chart. In this case, you can immediately see which optimal parameters can be used in the current market. This method is shown in the video in

RSI Currency Strength Meter uses RSI (Relative Strength Index) to monitor how strong a currency is, or in other words, if it's being bought or sold by the majority compared to the other currencies. It displays the strength-lines of the currencies of the pair (base and counter currency of the chart) with changeable solid lines. Also, you can add up to five additional currencies to the "comparison pool". If you want to look and compare, for example, EUR, USD and JPY, it will only look at the EURUS

This indicator helps to define the dominant trend. The Blue line and Red line changes at incrementations of the trends.
Parameters ki: factor of the delay. per: Displays the indicator period. Trend: Displays the Trend movements. Trend true.(false) X: moves the trend left and right. Y: moves the trend up and down. How to understand the status: If the arrow is blue, trend is up. If the arrow is red, trend is down.

这个指标显示2条移动平均线间的交叉,一个快速和慢速移动平均线。当快速MA1向上穿越慢速MA2时弹出报警。当快速MA1向下穿越慢速MA2时弹出报警。
输入参数 快速MA设置 Period = 5 -快速MA周期 Mode = SMA - type of Moving Average (SMA, EMA, SMMA, LWMA). Price = Close - type of price (Close,Open, Low, High, Median, Typical, Weighted). 慢速MA设置 Period:10 - 慢速MA周期 Mode = SMA - type of Moving Average (SMA, EMA, SMMA, LWMA). Price = Close - type of price (Close,Open, Low, High, Median, Typical, Weighted). 其他 NewBarCheckOnly = true/false - true:Check only new Bar DistanceBetweenMA = 0 - 2个

这个EA是基于经典的趋势跟踪系统监测入场信号的。它是基于ATR和CCI指标与移动平均线指标 DYJ TwoMACrossAlarm ,它使用2条移动平均线交叉查找信号,2个平均线分为一个快速和慢速移动平均线,这个EA使用了动态分配移动平均线MA1和MA2的周期,平均线周期使用了斐波那契数列,例如5,8 或 13,21 或 21,34 或......;当快速MA1向上穿越慢速MA2与CCI值向上穿越0线时,建立多单。当快速MA1向下穿越慢速MA2与CCI值向下穿越0线时,建立空单。ATR指标用于自动计算止损。如果有相反信号以及止损,止盈,追踪止损退出. 输入参数
MA Setup IsAutoAllocationMA = true - Dynamic allocation Period Fast MA Setup Period =5 - period of Faster Moving Average (value 5 ),if not automatic allocation period . Mode = EMA - type of Moving Average (SMA, E

DYJ NewsForexFactory是用于基本市场分析的日历交易工具,同时它也是宏观经济事件指标。 在这里,你可以找到全球最大经济体的金融新闻和指标——从美国、欧盟到澳大利亚和纽西兰和日本和中国,共有9个经济体,涉及60多个货币对。800多个宏观经济指标和事件是从公共来源实时收集的。每个指标都有历史、当前和预测值以及重要性特征。此外,该服务存储图表和表格中列出的大量历史数据。 指示器右侧动态绿色箭头指示最后一个事件的发生,并给出该货币的数据分析结果,Better或者Worse,你能根据结果判断货币对的多与空 指示器左边指示黄色星号表示下一个即将发生的事件 指示器时间序列栏里显示每个时间点的事件对象。 指示器具有电子邮件和推送通知功能。
所有货币对 GBPUSD、EURUSD、USDJPY、USDCHF、USDCAD、GBPJPY、EURJPY、eugbp、EURAUD、EURNZD、EURCAD、EURCHF、CADJPY、CADCHF、AUDUSD、AUDNZD、AUDCAD、AUDJPY、AUDCHF,NZDJPY、NZDUSD、NZDCAD、NZDCHF
参数
Inp

This trade panel is designed for opening market orders with predefined values of Magic, TakeProfit and StopLoss. The panel displays the following data: Ask - current Ask price; Bid - current Bid price; Spread - spread equal to (Ask-Bid)*0.0001 for 4- and 5-digit quotes, and (Ask-Bid)*0.01 for 3- and 2-digit quotes; Buy - button for sending a request to open a Buy order; Sell - button for sending a request to open a Sell order; TakeProfit - set TakeProfit: pips - in pips (0.00001) for 4- and 5-di

EW Oscillator PRO is an indicator for MetaTrader 4 based on mathematical calculations on the price chart. This is one of the most common and useful indicators for finding the trend reversal points. EW Oscillator PRO is equipped with multiple types of notification (push notifications, emails, alerts), which allows opening trades in time. A panel for displaying the information on the indicator signals from different timeframes is located in the top left corner (see screenshot #2).
Distinctive fea

This utility device opens an opposite position a specified distance away from an original order (opened by another EA or just by manual trading) which it automatically detects. It can be used to gain back losses on false breakouts for example. Positions opened by the device can have a fixed SL and TP or/and can be protected by a trailing stop . In addition, it has a partial close function and a separate function to set a TP for secondary targets . It also uses a Magic number system , so it can b

The EA identifies divergences in two correlated currency pairs and trades in the direction where they converge back. Working timeframe: M30
Input parameters MagicNumber - identification number for the EA. OrdersComment - comment to order, automatic if an empty value is set. Lots - lot size. DepoPer001Lot - automatic lot calculation (specify the balance per 0.01 lot) (if 0, the value from 'Lots' parameter is used). TimeFrame - working timeframe. Symbol #2 - correlated currency. Symbol #2 reverse
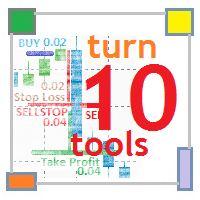
Features This EA works using a reversal logic: Buy → Stop Loss → Sell Stop → ... Multicurrency program (10 trading instruments are defined in the EA parameters). It is attached to one chart and trades up to ten trading instruments. Individual parameters are used for each trading instrument. The main logic is the same for all instruments. Martingale - customizable multiplier. It is possible to limit the number of increase steps. The EA opens the first order based on the signal: the price crosses

这个 Expert Advisor 是基于3条移动平均线指标,移动平均线交叉基于下列思想:快速、中速、慢速3条移动平均线交叉时,作为开仓和关仓的信号,其中三线交叉包含了三线交叉于一个点的特例。 当FastMA(MA1) 向上穿越middleMA(MA2)与middleMA(MA2)向上穿越slowMA(MA3)时建立多单. 当FastMA(MA1) 向下穿越middleMA(MA2)与middleMA(MA2)向下穿越slowMA(MA3)时建立空单; 当FastMA(MA1) 向下穿越middleMA(MA2),关闭多单,当FastMA(MA1) 向上穿越middleMA(MA2),关闭空单。 这个专家使用了资金管理,传统的止损、止盈、追踪止损。每次交易只有一个订单,这确保交易的最大安全。
输入参数:
Fast MA settings Period = 5 - period of Faster Moving Average (value 5 ). Mode = EMA - type of Moving Average (SMA, EMA, SMMA, LWMA). Price =

The RiseTrading is a unique High quality and easy to use and affordable trading tool because we have incorporated a number of proprietary features and PowerSignal and MACD and Stochastic indicators. The main advantages of the trend trading strategy used by the Expert Advisor are opening positions only in the direction of a trend, ability for the long-term retention of profitable positions allowing users to achieve good combinations of profit/loss distributions. That can work on a real account at

DYJ Stoch 控制器 是一个全货币对 Stoch 交易系统,它能显示每一个货币对M1到MN周期的 Stoch 值,当某个周期的 Stoch 值达到超卖区和超买区时有颜色提示,你能根据这些信息做出正确的交易 请你制作一个 Stoch 指标模板命名为DYJ Stoch ,保存它 当你用鼠标单击超卖区或者超买区时,自动打开相应货币对 周期的 图表,并加载 Stoch 指标 INPUT
InpPairs = "GBPUSD,EURUSD,USDJPY,USDCHF,XAUUSD,USDCAD,GBPJPY,EURJPY,EURGBP,EURAUD,EURNZD,EURCAD,CADJPY,AUDUSD,AUDNZD,AUDCAD,AUDJPY,NZDJPY,NZDUSD,NZDCAD,GBPAUD,GBPNZD,GBPCAD,CHFJPY,NZDCHF,AUDCHF,EURCHF"; InpStrategyMinTimeFrame = PERIOD_M1 -- Strategy MinPeriod InpStrat

这个 DYJ SoarTrading 是基于 SoarSignal 指标,它能使用任何货币对和任何图表周期。 当SoarSignal交叉在oversold下方, 达到oversold区域,且它们的交叉又向上穿越oversold线时,多头进场。当SoarSignal交叉在overbought上方, 达到 overbought区域, 且它们的交叉又向下穿越overbought线时,空头进场。 当SoarSignal到达对侧的区域,如果对侧区域是overbought区域关闭多单,如果对侧区域是oversold区域关闭空单. 这个专家使用了资金管理,传统的止损、止盈、追踪止损。每次交易只有一个订单,这确保交易的最大安全。 输入参数
SoarSignal指标设置 nPeriod = 20 - 指标周期 zoneSELL = 80 - 超买水平(overbought) zoneBUY = 20 - 超卖水平(oversold) 风险管理 Risk_Management = Automatic - 自动管理风险. Auto_Risk_Percent = 2 - 2%的活动资金. Auto_Max_R
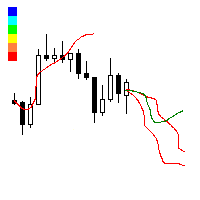
This utility searches the history for price patterns, which are similar to those present in the intervals selected by trader (there are several intervals, see the screenshot). The length of the pattern and selected intervals is the same and is given by the number of bars. The similarity is estimated by comparing the colors of bar bodies, sizes of bars' bodies and wicks. For all identified patterns, further movement of the price is visualized as lines. The color of lines determines the degree of

This small tool takes over the manually opened positions and treats them according to the predefined settings with the dynamic stop loss and Money Management, which predicts which position size should be used for the trade. The program dynamically tracks the stop loss as soon as the position comes into the plus. Possible commissions and swaps are taken into calculation. It should only be installed on one chart window per symbol.
Settings LotRiskPercent = 25 - Percentage of the item size. Calcul

This Expert Advisor implements elements of the Martingale system. Orders are opened at a specified distance from the moving average. The Parabolic SAR indicator and certain technical details are used to ensure the most accurate entries. The EA is highly customizable. It is recommended for simultaneous use on 4 currency pairs: EURUSD M15; GBPUSD M15; USDJPY M15; USDCAD M15. Despite good stability, it is advisable to disable the EA operation during the days rich in news releases.
Configurations P
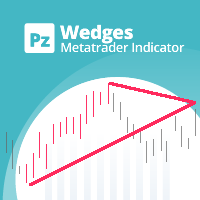
该指标找到 楔形 ,它们是通过围绕价格合并期的趋同趋势线确定的延续模式。它使用donchian突破与形态突破一起发出交易信号。 [ 安装指南 | 更新指南 | 故障排除 | 常见问题 | 所有产品 ] 易于使用 可自定义的颜色和尺寸 它实现突破信号 它实现了各种警报
最佳用法 要查看可能重叠的所有大小的楔形,请在图表上多次加载具有不同大小的指标,例如6、12、18和24。
输入参数 大小:要找到的图案的大小,用替代点之间的条形表示 突破期:唐契安期指示交易
最大。历史柱线:图表中要检查的过去柱线的数量 看涨形态的颜色:此参数不言自明 空头形态的颜色:此参数不言自明 不间断图案的颜色:此参数不言自明 线宽:图案线的大小 看涨突破的颜色:这是买入箭头的颜色 看跌突破的颜色:这是卖出箭头的颜色 箭头大小:这是图表中显示的箭头的大小 自定义警报名称:此图表中引发的警报的自定义标题 显示警报:启用或禁用屏幕警报 电子邮件警报:启用或禁用邮件警报。 推送警报:启用或禁用推送警报。 声音警报:启用或禁用声音警报。 声音文件:出现屏幕警报时播放的声音文件。
作者 Arturo Lopez Pe

London Trader EA uses a breakout strategy that can be set to London Session, Tokyo Session, New York Session and Sydney Session.
Recommendations Time frame: H1 Pairs: EURJPY, EURCAD, EURAUD, CADCHF, USDCHF and other pairs can be used. Minimum Leverage: 1:100.
Benefit No martingale or No grid. Can be optimised to any markets time Session. Equity protection by Stop Loss application. EA has a safe mode option. Multicurrency EA.
Input parameters London Trade Time Start : London session opening ti

DAX Farmer EA is a fully automated Expert Advisor based on a simple system of moving averages. The basic settings are optimized and I will update them every 6 months. Do not hesitate to contact me if you have any questions or just to give me a feedback.
Starter Kit Symbol: DAX (GER30) M5. Optimum deposit: $1000. Leverage: 1:300-1:500. ECN account with fast execution and low spreads. VPS hosting is highly recommended.
Input parameters MagicNumber - this EA will only deal with trades with this n

Climb O is an Expert Advisor (EA) based on Martingale method and oriented to equity value. This EA will immediately send one order after launch and Climb O will work based on this first order. If the order have price loss, this EA will send another orders with the same type and double lots. This action is to get more return to cover the loosing prices at the opposite movement of prices, and also to find the best equity balance that can get by each orders. Because this EA use high risk method: Ma

Steed is a trend-following multicurrency Expert Advisor, intended for long-term and safe investment. The strategy is based on the analysis of statistics of currency pair movements, as well as the correlation between te underlying currencies of the currency pair the EA is trading. Decision on each specific entry is made through technical analysis, while considering the data from different timeframes. It is necessary to understand that periods (weeks or months) of drawdown or operation with zero p

SolaceSystem is a trend scalper. The Expert Advisor algorithm calculates price consolidation levels and opens trades if a strong market movement is expected. The Parabolic SAR standard indicator is used to filter trade opening.
Distinctive features Martingale is not used. Does not accumulate loss. Uses take profit and stop loss. Trades are closed either by TP and SL, or using a unique trailing stop algorithm. Automatic lot calculation. The Expert Advisor is fully ready for long-term automated o

The presented indicator implements the idea embedded in the classic technical analysis indicators - "Bulls" / "Bears" at a new level. The "Bulls or Bears AM" indicator displays the difference between the maximum and minimum prices for the current period of time and the values of the channel built on the maximum and minimum prices for a longer period. The growth of the indicator values above zero indicates that the maximum price for the current period is greater than the average value of maxi

Trendator EA is a fully automated Expert Advisor based on a moving average an MACD and a custom trend tracking algorithm originally planned for large Timeframes like H1-H4-D1. Use this EA on EURUSD with the default settings if you want to use it on another Symbol you will need to optimize parameters especially TrendatorFactor. The basic settings are optimized and I will update them every 6 months. Do not hesitate to contact me if you have any questions or just to give me a feedback.
Starter Kit

This is a multi timeframe indicator to show the direction of the trend in multiple timeframes. The calculations are based on some original indicators but with special settings that is working for years and in combination with some newer indicator formulas. The indicator has multiple arrows based on various timeframe signals so that user can clearly see which signal is for which timeframe. Also draws horizontal lines with different thickness settings and colors from various latest signals so that
For those who studies Bill Williams' books "New Trading Dimensions" and "Trading Chaos (Second Edition)" and tries trading using these methods, it becomes evident that the standard set of indicators is not sufficient for full-fledged work. The Trading Chaos Map indicator draws the "market map", thus allowing you to the charts the same way as the author of the trilogy. Parameters provide options for enabling and disabling each signal. You can use any of the methods, or use them in conjunction. Yo

The Magneto Volume Trigger indicator is designed for determining the volume confirmed by the candlestick pattern and predicting the trend tendency.
Indicator setup and use The calculation of values is affected by two parameters - Period and Gate . The lower the value of Gate , the higher the sensitivity of the indicator. Period allows making a sample of data for the specified number of candles. The lower the value of Period , the more the indicator is adapted to the current market conditions. I

Moriarty is fully automatic advisor based on Scalping, but also uses Martingale strategy. This advisor does not depend on timeframes and uses heuristic algorithms for opening/closing orders. It can work on several currency pairs simultaneously.
Usage Run the advisor on a chart.
Parameters Moriarty Take profit in pips: minimal number of pips that is required to close order with profit Lots: size of lot Step: martingale step Martingale: multiplier for martingale Magic: the magic value to distin

Swingmaster EA is an state of the art investment algorithm for forex using pure technicals determining the price and time of the market moves
Technicals used : Ichimoku Williams % R Bollinger bands Moving Average
EA Spec : H4 based trading one trade per pair when entry signal arises /exit on signal breach Entered swing trade can last for day/week/month depending market conditions Excellent Risk to reward on the swing trades doing multi currency trading No Martingale No Scalping No Grid Mone

Moving Clouds EA is a multicurrency, trend based Expert Advisor which works with two moving averages and the Ichimoku cloud . Moving Clouds EA derives its signal by the following method: Buy Signal : By intersection of Moving Averages with the Ichimoku Cloud from below upwards. Sell Signal : By intersection of Moving Averages with the Ichimoku Cloud from above downwards.
Input Parameters Settings for Ichimoku : Time Frame - Ichimoku's Time Frame. Senkou Span A - Value for Senkou Span A. Senkou

Virtual Trailing and Closing Profit by parts
U Trail and Close Part is a fully automated Expert Advisor for managing trades. The following functions are used in the Expert Advisor:
Calculation of risk in a position StopLoss - used for calculation of risk in a trade. LotFixedUse - only a fixed lot is used. LotFixed - fixed lot size. RiskMM - percentage of risk in the position. The function is active if the fixed lot is disabled.
Partial profit taking PartialOn - enable partial closure (true) b

The Grid EA (with smart mode) is based on a strategy with a dynamic grid channel that can withstand long absence of rollback. The robot can be used for trading any instruments after a proper optimization. With default parameters, it is recommended for: EURUSD, EURJPY, CADJPY, GBPUSD NZDUSD. Monitoring of EA trading: https://www.mql5.com/ru/signals/538873
Key Features Fully automated trading Customizable deposit protection Forced order closing and planned trade pauses Virtual Take profit and St

This utility is designed for level trading.
Parameters buy level, sell level - type of the placed order. open price level - price level of the order. open Lot - order volume. Magic - magic number of the order. TakeProfit - take profit of the order in pips, (0.00001) for 4- and 5-digit quotes, (0.001) for 3- and 2-digit quotes. StopLoss - stop loss of the order in pips, (0.00001) for 4- and 5-digit quotes, (0.001) for 3- and 2-digit quotes. repeat open orders as a Limit Order: on, off - enable t

“预测唐契安通道”指标可让您根据当前价格位置预测唐契安通道水平在未来的变化。 标准之字形指标在接触到对面的 Donchian 通道时开始以 99% 绘制其光束。 通道边界水平的预测将有助于找到修正的终点或趋势变化的点,以估计这些事件发生的时间。 ................................................................................................................ 设置 Period - 计算 Donchian 通道的周期。推荐值从 12 到 240. ................................................................................................................
MACD MTF Signal is an indicator for understanding a trend reversal in any market . It is calculated using the MACD Histogram, which results from the difference between MACD and Signal Line. The strength of MACD MTF Signal is the ability to see more time frames at the same time if they are greater than the one displayed on the chart. In this way it is possible to understand a convergence of ascent or descent on several time frames, which means a strong push in one direction or the other. Another

Trend CruiserGT (for CAD/CHF) It is a swing trading system that trades on CAD/CHF currency pair on 4-hrly chart . The EA is custom designed to take advantage of the start of rising Canadian dollar in 2017, after seeing over 7 year period of downtrend against the Swiss Franc (CHF). The design of the EA have taken consideration of fundamental analysis over last several quarters for the CAD and CHF counterparts, and analyzing the multi-year chart pattern of this pair. The strategy will take full ad
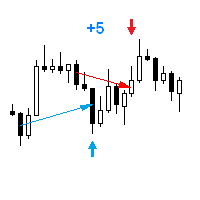
The Expert Advisor opens a trade in the direction of the previous price movement or in the opposite direction (selectable). The previous direction is determined based on the chosen time interval. The interval can be set to trading session hours and thus to check the theory that the price is inactive after session close. Multiple trades can be open at a time depending on input parameters. The Expert Advisor trails the stop loss order, and is provided with multiple breakeven and trade closing func
The Expert Advisor trades based on levels set by the user or an indicator (three indicators are built into the EA). The EA requires two lines for correct operation: one must be higher than the current price, and the other must be lower. The EA supports two line types: horizontal and trend lines. The two lines may have the same or different types. Lines can be used to draw a channel and set the EA to trade within the channel: buy at the lower line and sell at the upper line. It is also possible t

DYJ WPR - SignalSource 是基于 WPR 指标的EA . 它仅仅使用一个货币对某个周期图表运行EA,就能监控全部货币对信号开仓关仓。 WPR 推荐 指标值介于80%和100%之间,表明市场超卖。 指标值介于0到20%之间,表示市场超买。 该指标的入场信号,则是趋势转折点。
该指标使用模拟交易技术, 指标为你提供评价开盘信号和收盘信号整体盈利。 你用哪种评估模式交易都很方便。 当你选择最大利润模型评估模型时, 建议您使用跟踪止损功能。 这样可以最大程度的跟踪趋势利润。 当您选择反向信号关闭评估模式时, 建议你耐心等待反信号出现,然后关闭仓位。 这个可以一直等趋势真正结束并盈利。 如果您需要自动化跟随指标开仓关仓,请下载实用工具软件 DYJ Follow Me
Input parameters [Indicator]
InpWPRPeriod = 14 -- period for WPR
InpShowArrows = true
InpAlertsOn = true
ArrowUpClr

The indicator identifies the most suitable moment for entering the market in terms of market volatility, when the market has the strength to move (the signal is indicated by an arrow under the candle). For each of the signals, the presence of trends on the current and higher timeframes is determined, so that the signal is in the direction of the majority of positions opened on the market (denoted near the signal by abbreviations of timeframes with a trend present). The signal appears after the c

Trading Machine is an Expert Advisor (Robot) for any financial instrument on the MetaTrader 4 platform. All input parameters are optimized for EURUSD M1 . Of course, you are able to optimize these parameters for any currency pairs and timeframe. The main input parameters are A, B, C, D, and E , which can be any positive numbers. These are input parameters (weight coefficients) of the one layer neural network. The EA checks for a new trend and opens a position accordingly. If a trend changes its

CHF Portal is designed for Trading USDCHF specifically.
Trading Concept The operation concept of CHF Portal is based on an algorithm which tries to determine the Trend. To be more specific, CHF Portal works with its own calculation logic according to historical volatility and price movement. It is trying to find out the Top or Bottom in a Trend, and open the Short or Long Position accordingly. Don't expect CHF Portal can be able to open the trade on the highest or lowest level, because CHF Port

This Indicator Shows 5 lines: Avg Buy - Average Buy price line & total size for all open long positions in your chart Avg Sell - Average Sell price line & total size for all open short positions in your chart B / E - Breakeven price line & total size for all open (long & short) positions in your chart S / L - Stop Loss price line T / P - Take Profit price line Calculation includes Commissions and Swaps Works for a specific Magic Number trades or all trades on chart All currency pairs and all cur

EPriceJPY is a auto-trading EA focused on USDJPY.
Trading Concept The operation concept of EPriceJPY is based on an algorithm that tries to determine the Trend. To be more specific, EPriceJPY works with its own calculation logic based on simulation. It is trying to find out the Top or Bottom in a Trend, and open the Short or Long Position accordingly. Don't expect EPriceJPY to open the trade on the highest or lowest level, because EPriceJPY will trade only when the Top/Bottom can be confirmed.

Secret Scalper PRO is pro version of Secret Scalper. The EA is a medium-term scalper. Original version is available here:
https://www.mql5.com/en/market/product/24112
PRO Advantages Trailing SL for First Order: This is classic trailing stop only for first order. Basket Profit Trailing: EA will trail basket orders, if the basket in profit. Day&Time Filter: You can choose EA's working days and times. Orders Closure Type: Profit&Loss To Close can be calculated by Equity&Balance %.
Requirements T

This is an arrow indicator for binary options. It does not redraw, arrows do not disappear. The indicator implements an optional tester for visual monitoring of the number of signal and win rate. Does not require adjustment or fitting. Works on all pairs and gold. The signal appears at the close of a candle. Entry is made on the next bar. Optional alert. For trading with robots, there is a setting for the number of bars in history. If 0, the entire history is used. The EA operation time: 24/5 Wo

ThreeVS3 is a unique and high quality indicator. It is also a effective and understandable trading tool. The operation concept is on a score basis, which is ranged from -3 to +3. Thus, you can just according to the score to do the trade easily.
How the Score calculated? The Score is calculated by 3 set of formulas. Each of them represent Long term, Short term, and entry level respectively.
How to understand the Score? The Positive sign means favor for long position, and Negative sign means fav

One of the biggest problems you will face as trader is finding the right system for myself. AMD Exclusive Two can constitute a complete system for you. Don’t follow the arrows, without thinking twice. Trading using a whole system. What we have? Automatic optimization Overbalance (manual, semi-automatic and automatic) Main and additional signals Fibonacci Pivot Linear Regression Channel Mini Tester Early warning system (yellow cloud on the chart) 3D effect
Button On Chart Button [Start] - Start

This is a simple leading indicator that will aids in drawing lines for Open price of the day, week, month, and the year. It also draws the High and Low of the periods respectively. The Open price helps marking off the starting point of the any symbol within a specified period. These lines can be useful in determining the trend of any market (stocks and FX). It also inclusde ranges of the pip movement of symbol of any given period. These ranges helps you to identify how far the market has moved t
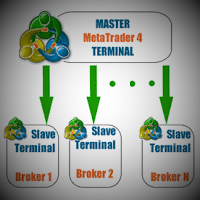
This utility copies the trades between MT4 on one computer. It also supports partial closing trades.
Parameters ID - is not required. If you want to use multiple MASTERs on one PC or on one MT4, each MASTER must have a different ID (alphanumeric). Then SLAVE must have the same ID as the MASTER. Mode MASTER - for a provider account; in this mode, the tool transmits trades from the master account. SLAVE - for a recipient account; in this mode, the tool receives the data transmitted from the maste
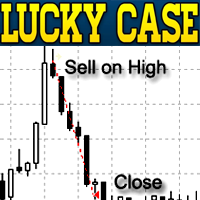
LuckyCase is an Expert Advisor with martingale elements. The EA strategy is based on a significant "deviation" of the price from SAR inadicator and the Bands levels breakthrough point. The money management system is an essential part of the EA. It starts working after a trade is opened. Trades are closed after accumulating specified points of market orders, by deposit % or after an opposite side of the channel is broken through. The default EA settings are meant for: EURUSD M15; USDJPY M15. The
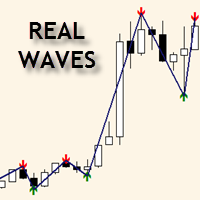
The indicator shows the real waves, based on alternating upper and lower extremums of the price chart, thus displaying the wave structure of the market. When using this indicator, there is no need to manually apply the wave markup for the current timeframe. Relevance of the extremums is determined in the process of their calculation, invalid extremums are not taken into account. Upper extremums are calculated by the bars highs, while lower ones are calculated by the bars lows. Only one bar is co

Copyist MS is a simple and easy to use trade copier. It works as a single-file Expert Advisor with toggled Master and Slave operation modes.
Configurations Type of work - work mode selection: Master or Slave; Copy by magic number - copy trade orders by magic number (configure in master terminal) Will not copy currency pairs - list of unwanted currency pairs to copy (configure in master terminal) Master account number - master-terminal trading account number; Selective copying currency pairs - i
MMM Keltner Channels EA strategy: The robot uses its built in Keltner Channels indicator all the time and does a calculation to determine the prices trends. If it indicates the price will be bullish, it sends a buy order. If the indicator indicates the price will be bearish, it sends a sell order; It will not send an order unless the calculations determines a good trend of profit; Like all MMM products it is also programmed to minimize your losses and protect your money from the hostile market.

Moving band is a trend based, custom indicator which combines multiple Moving Averages and Bollinger Band .
Features Trend based Indicator Does not repaint No False Signals Works on all Time Frames Applicable on Forex, Indices and Stocks
Input Parameters Show Indicator after Testing : True/False Sound an alert : True/False Send an email : True/False Send a notification : True/False Signals The signals are generated with intersection of multiple Moving Averages with mid Bollinger Band Buy when

MArketwave is a multicurrency, trend following indicator which combines three of the most commonly used parameters. Parameters Moving Averages Bollinger Bands Stochastic Oscillator The parameters have been customized to provide accurate signals. Signals Thick dark green up arrows - Uptrend Thin light green up arrows - Buy Thick red down arrow - Downtrend Thin red down arrow - Sell Trading tips Check the trend with thick arrows Buy or sell with thin arrows only in the direction of the main trend
MetaTrader市场提供了一个方便,安全的购买MetaTrader平台应用程序的场所。直接从您的程序端免费下载EA交易和指标的试用版在测试策略中进行测试。
在不同模式下测试应用程序来监视性能和为您想要使用MQL5.community支付系统的产品进行付款。
您错过了交易机会:
- 免费交易应用程序
- 8,000+信号可供复制
- 探索金融市场的经济新闻
注册
登录