适用于MetaTrader 4的付费技术指标 - 69

The Comparison indicator can be used as an independent trading system. It is based on the idea that some currency pairs follow each other. The indicator allows you to simultaneously display another chart on the chart of one currency pair, which allows you to anticipate some movements and quite accurately determine the beginning of trends.
The principle of trading by indicator signals is also simple: a currency pair, the chart of which is above, should be sold, and the one below, should be bou

The Trend Reversal Arrow Scalper indicator is designed to find trend reversals on the current timeframe. Trading with it becomes very simple, since the indicator does all the hard work for you to find points of entry into the market. You just have to buy if a blue arrow appears, or sell if a red arrow appears. The indicator also displays dots (red and blue following the arrow). They show the current trend and are also signals for entry (if, for example, you missed the main entry along the arrow)

Keltner Channels are volatility-based bands that are placed on either side of an asset's price and can aid in determining the direction of a trend. The exponential moving average (EMA) of a Keltner Channel is typically 20 periods, although this can be adjusted if desired.( Default is 50 here..)
In the Classic Keltner Channels The upper and lower bands are typically set two times the average true range (ATR) above and below the EMA, although the multiplier can also be adjusted based on personal

Risk Reward ratio indicator for MT4 BING Risk Reward indicator is a powerful, basic, very needed tool for every trader. Clearly visualize Open Price , Stop Loss , and Top Profit levels on your graphs with easy-to-see colors and trendlines.
Does BING Risk Reward show alerts? Of course! BING Risk Reward Indicator offers all Alerts available for the MT4 platform(Email, Popups, Sound, and Push). It shows alerts on Open Price , Stop Loss , and Top Profit. That way, besides easily seeing what is g

FX Flow indicator can be used as an anticipator of the next trend, preferably confirmed by Price Action or another oscillator (RSi, Stochastic ..).
It takes the money flows of the major currencies USD EUR GBP AUD NZD CAD CHF JPY into account, and processes them. Excellent tool for indices, but also for correlations between currencies. Works on each timeframes.
Blue line: Bull market Yellow line: Bear market
Note : if the indicator opens the window, but does not draw lines, load the histo

KDJ Index 4 交易实用必备工具指标 波浪自动计算指标,通道趋势交易 完美的趋势-波浪自动计算通道计算 , MT4版本 完美的趋势-波浪自动计算通道计算 , MT5版本 本地跟单复制交易 Easy And Fast Copy , MT4版本 Easy And Fast Copy , MT5版本 本地跟单复制交易 模拟试用 Easy And Fast Copy , MT4 模拟账号运行 Easy And Fast Copy , MT5 模拟账号运行 "Cooperative QQ:556024 " "Cooperation wechat:556024" "Cooperative email:556024@qq.com" 强烈推荐趋势指标, 波浪的标准自动计算 和 波浪的标准自动计算MT5版本
KDJ指标又叫 随机指标 ,是一种相当新颖、实用的技术分析指标,它起先用于期货市场的分析,后被广泛用于股市的中短期趋势分析,是期货和股票市场上最常用的技术分析工具。 随机指标KDJ一般是用于股票分析的统计体系,根据统计学原理,通过一个特定的周期(常为9日、9周等

I. TrendPadPRO - Unveiling the Context of Informed Trend Trading The Context of Trend Trading is far more relevant and important than indicators, timeframes, personal perspectives or beliefs. TrendPadPRO 's unique features, including trend inertia (age) analysis, trend direction identification, and precise S/R levels, bring the knowledge of the Context of Trend Trading needed to make decisions in real time.
II. Usability of TrendPadPRO TrendPadPRO is a trading tool designed to cate
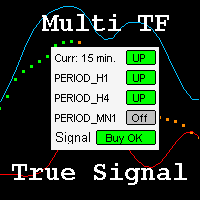
这是指标外壳中的一个函数。为指定数量的 TF(从 1 到 4)生成交易信号。不使用终端随附的指示灯。基本计算是使用 MACD 公式进行的,但使用的是经过修改的第三代 EMA(对趋势的突然变化反应更快)。 此外,功能: - 绘制两条显示趋势强度的波段。 - 检测趋势变化到相反的时刻,并通过警报和声音信号(如果允许)通知它。警报仅在趋势变化时弹出一次。如果至少有 2 个相同颜色的点,则为每个被监控的 TF 生成 UP 或 DN 信号。最终信号由所有允许的 TF 的指标形成。 可以关闭当前 TF 的信号 - 趋势将被绘制,但信号不会被考虑在内。这使您可以自由切换chart-TF以概览一般情况,而不会违反功能的正确性。我不建议让超过 2 个 TF 不必要地工作。或者允许一切,但在不等待最终上涨或下跌信号的情况下做出交易决定。在弱趋势(线之间的小差距,点几乎是水平的,颜色交替),我建议关闭盈利交易而不是交易。或者按照假定的趋势发展方向通过挂单进行交易。在强劲趋势下,允许交易市场订单 输入参数
FastPeriod、SlowPeriod、DeviationPeriod、Deviatio

The Easy Trends indicator gives the trader the ability to visually determine which trend will be present at a particular time interval. It smooths out price fluctuations during signal formation by averaging the data. This is an auxiliary tool for technical analysis, which helps to determine the exact direction of the trend: either upward or downward movement of the price of a trading instrument.
Although the indicator lags a little, it still generates the most reliable signals that a trader c

Reversal Prices is an indicator that has a fairly powerful and effective mechanism for adapting to changing market conditions. Reversal Prices - the new word in trend detection! With the development of information technology and a large number of participants, financial markets are less and less amenable to analysis by outdated indicators. Conventional technical analysis tools, such as the Moving Average or Stochastic, in their pure form are not able to determine the direction of the trend or it

The new Analytical Concentration leading trend indicator uses adaptive anti-aliasing. It allows you to enter the market early. Indicator of a sharp turn to a dynamic change of direction. The Analytical Concentration indicator gives the trader the ability to visually determine which trend will be present at a particular time interval. An indicator that has a sufficiently powerful and effective mechanism for adapting to changing market conditions.
A new word in trend detection! It smooths out p
Product Description 4xZeovo is a powerful trading indicator system monitoring 24/7 financial markets. Metatrader4 tool designed to find the best buying/selling opportunities and notifies the user. Making life easy for traders in helping with the two most difficult decisions with the use of advanced innovate trading indicators aiming to encourage users to hold the winning positions and take profit at the best times. Equipped with a unique trading algorithm providing highly accurate buying/

Based on TheStrat by Rob Smith (@robintheblack) #thestrat , which is a trading method that Rob has developed over a 30 year career in the market. This is TheStrat Timeframe Continuity scanner that allows you to constantly scan either the Stocks, Currency pairs, indices or commodities that you want to watch. The time frames that you can watch can be (Year, Quarter, Month, Week, Day, H4, H1, 15M and smaller if you feel like it). It tells what the current candle is doing. It is either inside b
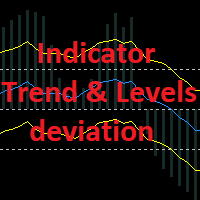
Growth and trend reversal indicator. It does not redraw in the bar calculation mode and can redraw on the 0th bar in the tick calculation mode. The trend line and level lines with their own settings are calculated separately. There are 2 types of arrows - for the intersection of trend lines and the reverse intersection of trend lines (reversal). The arrows are buffer and you can output signals to the Expert Advisor. The arrows can be duplicated with a sound signal, a message from the terminal,
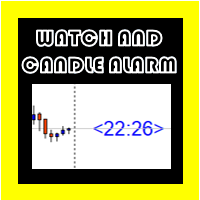
Osw METATRADER 4手表
这是一个指示器,显示了当前蜡烛在手表上到期的剩余时间,该时间始终位于价格之后的最后一根蜡烛旁边,数字与图像中的显示相同,并且可以更改大小和颜色。
您可以在以下设置之间进行设置:
显示时间的数字大小。
显示时间的数字的颜色。
同样在配置中,您可以激活和禁用,以便每次新的蜡烛开始时都会发出警报。
(别忘了检查我的其他指标)
Osw METATRADER 4手表
这是一个指示器,显示了当前蜡烛在手表上到期的剩余时间,该时间始终位于价格之后的最后一根蜡烛旁边,数字与图像中的显示相同,并且可以更改大小和颜色。
您可以在以下设置之间进行设置:
显示时间的数字大小。
显示时间的数字的颜色。
同样在配置中,您可以激活和禁用,以便每次新的蜡烛开始时都会发出警报。
(别忘了检查我的其他指标)

This is a professional Trend Sim indicator. The intelligent algorithm of the Trend Sim indicator accurately detects the trend, filters out market noise and generates input signals and exit levels. Functions with advanced statistical calculation rules improve the overall performance of this indicator.
The indicator displays signals in a simple and accessible form in the form of arrows (when to buy and when to sell). Knowing the entry point of each of the currencies is very important for every

Smart Channel is a non-redrawing channel indicator based on moving averages. The indicator is used to identify trends in financial markets and indicates the direction of price movement.
Smart Channel, in fact, is a miniature trading strategy, since, regardless of the construction methods, it uses the tactics of rebounding from the boundaries of the built channel, and the boundaries themselves are used as guidelines for the correct placement of stop loss and take profit orders.
The key diffe

The Trend Line indicator shows the potential trend direction based on the cyclical-wave dependence. The Trend Line can be used as the direction of potential market movement.
Thus, all rays of the intersection will be optimal rays in the direction of which the price is expected to move, taking into account the indicator period. But do not forget that the approach must be complex, the indicator signals require additional information to enter the market.

The Supernatural channel is determined using a special algorithm, marker points are used to determine the movement of the channel. The Supernatural channel consists of two lines, red and blue, that make up the channel. Simple, visual and efficient use. Can be used for intra-channel trading. The indicator does not redraw and does not lag. Works on all currency pairs and on all timeframes.

World Trend is a hybrid trend indicator, as it is based on the signals of elementary indicators and a special algorithm for analysis. The indicator shows favorable moments for entering the market. The intelligent algorithm of the indicator determines the trend, filters out market noise and generates entry signals.
You can use the indicator as the main one to determine the trend. The indicator can work both for entry points and as a filter. Uses two options for settings. The indicator uses col

The Generic Trend indicator is a trend type indicator. It smooths out price fluctuations when generating a signal by averaging the data and the signal only at certain moments! In those moments when you need to make a decision to enter a position and give the trader a direction. The indicator gives the trader the opportunity to visually determine which trend will be present at a particular time interval.
This indicator was created to quickly determine the situation in the market, reflect the s

The Oscillator Trend indicators are most useful in identifying trend decay. Nobody canceled the divergence. Correct use of this signal will give you a certain head start in the market. When working in flat. The principle of operation of the oscillator is based on the measurement of fluctuations. The indicator tries to determine the maximum or minimum of the next swing - an exit from the overbought and oversold zones. Do not forget that these signals are most interesting at the borders of the fl

MT4多時限發散和超買/超賣檢測指標。
特徵
-在圖表控制面板上完全可自定義,提供完整的交互。
-隨時隨地隱藏和顯示控制面板。
-有關非大寫差異的實時信息。
-有關超買/超賣情況的實時信息。
-有關規則差異的實時信息。
-有關隱藏分歧的實時信息。
-可用於發散檢測的振盪器:AO,RSI,CCI,MACD,STOCH,RMI,TDI,RSIOMA。
-通知服務(屏幕警報|推送通知)。
概括
使用差異交易有助於發現趨勢減弱或勢頭逆轉。有時,您甚至可以將其用作趨勢持續的信號。我們的工具在一個非常舒適和直觀的控制面板中同時提供所有時間範圍的差異檢測,並具有顯示和隱藏的可能性,以使您的圖表盡可能保持清潔。
您會在選擇的歷史時期實時看到超買和超賣情況,定期背離,隱藏背離和無資本背離。
對於沒有大寫字母的差異,我們會在屏幕上顯示MT4通知,並將通知推送到您的手機!
_________________________________________________________________ THEQ HAG Indicator. _________________________________________________________________ - THEQ HAG Indicator具有最大化利润和最小化损失的数学算法,可显示信号 -用信号与趋势进行交易,并采取获利预警信号。 -此指示器从不重新计算,重新绘制,向后重新绘制或在栏关闭后没有延迟。 -所有时间范围和货币对. ____________________________________________________________________

This indicator uses support and resistance, volume and some special formula to calculate the volume to filter the candles. If the volume reaches a specific value, And at the same time, Candle breaks the support/resistance line, There would be a signal and we can enter the market. Signals appear when the current candle closes. then you can enter the trade when a new candle appears. Please don't forget to follow your money management plan.
MT5 Version
Support/Resistance Breakout MT5 : https:
The signal indicator WITHOUT REDRAWING gives recommendations for the direction of trading.
When the price moves through the internal channel, it gives signals (red and blue arrows), recommending a possible change in the direction of the price movement up or down.
When the price crosses the external channel, it gives signals (yellow arrows), warning that a strong price movement is possible, which will not immediately turn the trading direction. When the price crosses the average, it is possi

Step force index is a modified version of the famous force index indicator. As the name suggests it incorporates a step feature to filter the force index values thus eliminating small fluctuations in the indicator. It also utilizes the smooth algorithm library thereby providing multiple smoothing options for the index values. This personal implementation makes it a more easy to use and a reliable tool. Main features A wide range of parameters for signals optimization Alerts, emails and push noti
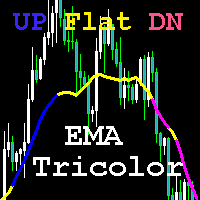
指标将偏移点 Point1 和 Bar1(最后一个关闭的柱)之间的 ClosePrice 差值与 Difer 常数进行比较。 如果该值为正并超过 Difer,则绘制蓝线,对应于上升趋势。 如果该值为负数并超过 Difer,则绘制洋红色线,对应于 DN 趋势。 没有趋势 (Flat) 用黄色表示。 您也可以通过快速和慢速 MA 进行交易。此选项更适合剥头皮。 您还可以根据主 MA 的颜色(和快速 MA 的交点)生成信号,同时考虑新柱的开盘价相对于 MA 的位置。此选项更适合中长期交易。 该指标使用 EMA 计算公式,它对价格变化做出快速反应,但它也捕捉到更多的噪音。当心。当以小幅度横向移动时,不应始终信任 MA 信号。 我一直在用这个籼稻2 Tor 已经使用了 15 年以上,但它仍然没有失去它的相关性,它比其他人更经常使用。 Tricolor 适用于长期交易和剥头皮交易。它同样适用于手动交易和专家顾问。
输入参数 MA_Shift = 指标线移动周期 MA_Period = 主要 MA 平均周期 Point1 Offset= 周期偏移 Point1 不同 =
One of the most successful strategies in Forex, stick and metal market, is rectangle pattern. A hard pattern to find in multiple time frames, but, We made it so very easy for you. You can turn on this indicator in different currency pairs with different time frames and set the alarm on your computer or mobile phone. Working with this strategy is easy and enjoyable. Telegram: https://t.me/triangleexpert Instagram: https://www.instagram.com/p/CNPbOLMh9Af/?igshid=15apgc7j1h5hm
Note: This indica

Indicator of fractals with adjustable indents. Designed according to an original simplified algorithm for use in EA.
The main ones in the indicator are lines showing the levels of the current fractals, which allows you to read the values of the last fractal in one operation.
It works on a closed bar, so it does not redraw and does not load the terminal with calculations.
It should be understood that the indicator is late with the detection of the fractal by the number of bars on the r

This indicator draws the prior Highs and Lows for multiple timeframes, and can display potential Take Profit and Stop Loss levels. In Rob Smith's # The Strat terms, these are potential entry points, or alternatively potential targets for open positions. I like to use them in both ways. On a lower timeframe, say 5 minutes to get a good entry on a daily or weekly level, and then as a potential target. Very small stops required giving an excellent risk/reward ratio. Please watch the DEMO video

The Fúria indicator was developed to work when the market is in trend, that is, you will rarely see any signs in consolidation zones. It can be used for both Forex and Binary Options.
The signs plotted on the graph do not repaint or recalculate, even if you close and reopen your MT4 / MT5 they will be there.
Wait for the signal to set on the candle before you can enter the next candle.
==================================================
* BUFFERS: 0 (CALL) and 1 (PUT); * TYPE OF ENTRY: n
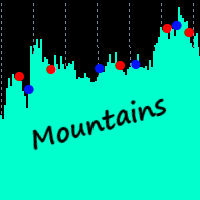
Visual helper for spotting peaks and troughs. Alerts. PSar settings for trend direction determination. Great for scalping. How to use: Simply attach to any chart. To spot peaks and troughs, zoom chart out completely. Sell on red dots. Best results when red dot appears on 3 or more time frames. Buy on blue dots. Best results when blue dot appears on 3 or more time frames. If used on lower timeframes (M1, M5, M15, M30), please make sure to check higher timeframes. Or backtest and use as you see fi

Prosecution is a Forex arrow indicator that tracks the market trend, ignoring sharp market fluctuations and noise around the average price. The indicator is created on the basis of a special algorithm, and based on the developed algorithm, signals are created that allow you to track the trend and see its beginning and end, especially when several timeframes are combined to refine the signal. The arrows show the direction of the deal, and are colored accordingly, which can be seen in the screensh

Free scanner available here: https://abiroid.com/product/abiroid-ema-scalper
Basic Strategy: 1: MA Crossover Up/Down Arrow (Mandatory Check) Optional Checks: 2: If NRTR Check On (Optional): For BUY: Check if NRTR blue and For SELL: NRTR Red If NRTR Shadow Distance On (Optional): Check price for 'x' bars back: at Shadow distance (ATR Multiplier distance) from NRTR line. 3: If High Volume bar On: Check if High Volume or if Medium (if on) Volume bar 'x' bars back 4: If HTF Trend Align On (Option
Новая серия индикаторов Veles Dynamic. Индикаторы не перерисовывают своих значений.
Эти индикаторы работают быстрее и точнее аналогичных по названию.
Индикатор Veles_dMA_Plus представляет собой динамическую МА, рассчитанную по текущим ценам инструмента.
Имеется возможность динамического сглаживания линии. Есть возможность отображения текущего трендового канала с изменением его волатильности.
Параметры: period - период динамической МА price - применяемая цена shift - сдвиг МА влево от
Новая серия индикаторов Veles Dynamic. Индикаторы не перерисовывают своих значений.
Эти индикаторы работают быстрее и точнее аналогичных по названию.
Индикатор Veles_dMACD представляет собой разницу показаний между двух динамических МА, рассчитанных по текущим ценам инструмента.
Хорошо показывает разворотные моменты, позволяет точно определять дивергенции. Имеет цветовое сопровождение изменения показаний.
Параметры: period_Fast - период быстрой динамической МА period_Slow - период
Новая серия индикаторов Veles Dynamic. Индикаторы не перерисовывают своих значений.
Эти индикаторы работают быстрее и точнее аналогичных по названию.
Индикатор Veles_dChannel представляет собой динамическую МА с расчетным каналом по текущим ценам инструмента.
Индикатор показывает полностью законченное движение в цикле.
Данный индикатор может использоваться в качестве установки и траллирования стопов при скальпинге.
Параметры: period - период динамической МА price - применяемая це
Новая серия индикаторов Veles Dynamic. Индикаторы не перерисовывают своих значений.
Эти индикаторы работают быстрее и точнее аналогичных по названию.
Индикатор Veles_dTrend представляет собой гистограмму, рассчитанную на основе нескольких динамических алгоритмов,
использующих текущие цены инструмента.
Пока индикатор не покажет смену тренда, будьте уверены, что тренд продолжит свое направление.
Кроме этого, есть зоны принятия решения, которые ограниченны уровнями.В этих зонах будет

這個獨特的自動趨勢線繪製指示器可在所有時間範圍內運行,可幫助您輕鬆交易短期趨勢反轉以及短期趨勢突破,表明市場上的資產更雄厚。 它獨特地使您可以儘早進入沉重的揮桿動作。 輸入包括:
-Max Candles回顧趨勢線
-線型和顏色
-到外帶和帶週期的最大距離
-當確認蠟燭或價格收盤時,自動重新繪製趨勢線偏離樞軸的選項較低,較低或較高的高位(雙底低位和高支撐位)和最大蠟燭數以進行重新繪製。
-4個換行選項:
1)價格跌破線時刪除
2)不要刪除
3)燭線超出界限時刪除
4)在趨勢關閉時刪除
This unique auto trend line drawing indicator works on all time frames which can help you to easily trade short term trend reversals as well as as well as short term trend breakouts indicating the stronger asset in the market. It uniquely a

Trend indicator based on a combination of moving averages.
Symbols : BTCUSD, GBJPJPY, GOLD, GBPUSD Timframes M5-H4
The main advantage: an additional algorithm of auto-optimization. The indicator can adjust its parameters for any financial instrument and any timeframe.
During auto-optimization, the indicator calculates tens of thousands of combinations and finds the one that gives the best series of profitable trades. The best parameters are set by default
Indicator settings can

An indicator for BUYs only, it is good to trade into the Crypto market and Indices or Stocks, for spot trader (non-leverage / 1-1) it is good to buy and hold for long-term and you can also use it to scalp on smaller time-frame if you receive a buy signal on higher time-frame, basically look for buys on smaller time-frame then, it purely depends on how you approach your trade, some people would take a top-down approach before taking a trade, and for leveraged trader it would be good to place stop
These are ideal entry points for quality The tool is quite easy to set up and use. The best options are set by default The tool was developed for the forex market ( it was also decided to test it on binary options and there is also a good result) The tool is suitable for both beginners and experienced traders and will be a great addition to your trading system or will become the basis for it Settings are just one parameter Perion Chanel = 1.0 This parameter filters out market noises and false le
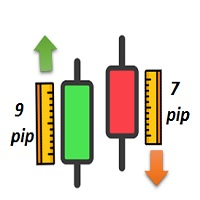
• Candle Length/Direction indicator •Show s the Length /direction of candle s : You can choose one of these two formulas to get the length/direction of candles in all time frames: 1- Open – Close 2- High – Low •Shows the Length of candles: It gives you a table showing the length of the candle of your choice in all time frames (in points). •Shows the Direction of candles: It uses color to indicate candles that are bullish (with positive points) or bearish (with negative points). • Add candle sh
This is a tool for trading binary options and Forex. Benefits No redrawing Accurate good signals Can be used with support and escort levels the result is a good strategy It can supplement any strategy as it perfectly determines the market reversal With cons There are unprofitable trades Parameters The best settings are set by default There are all the alerts you need to work comfortably with the instrument ...

The perfect tool for Scalng in the Forex markets You can trade both from signal to signal and using take profit The algorithm does not use Zigzag! No redrawing! This is a channel instrument that uses a moving average as a filter. Moving Average There are 2 parameters for the settings Ma Period = 5 period Moving Average Channel 1.0 distance of channel lines from the chart Price Signal Filter - calculation of signal opening and filter There is a complete set of Alert There is a multi-timefram

Аттракцион невиданной щедрости - треть цены!
Индикатор отображает на графике другой популярный индикатор XO, представленный на рисунке в подвале. Важно! Сигнальным является 0 бар - не перекрашивается! Параметры индикатора: Zone Range (Pips) - размер зоны в пипсах без учета количества знаков; Line or Histogram Width - ширина линий или гистограммы; Zone Draw Type - способ отрисовки зон: в виде гистограммы или линий на графике; Up Zone Color - цвет зоны BUY; Down Zone Color - цвет з
信號綜合體Atlon是一種現成的交易系統,它以箭頭的形式將信號發送到電子郵件,並將通知推送到您的手機。 Atlon還以紅色正方形的形式顯示現成的TP水平。
該系統可以處理任何圖表(貨幣對,股票,加密貨幣,金屬,石油)。
時限H1。
系統不會重繪,箭頭不會消失在任何地方。
該設置包括現成的設置,必須先加載這些設置,然後才能在圖表上進行安裝。
下載設定
系統參數:
頻譜大小(以巴為單位)-頻譜大小(以巴為單位)。
以點為單位的頻譜大小-以點為單位的頻譜大小。
噪音-噪音
最大條數-最大條數
顯示TP-是否顯示TP。
過濾器TF-使用選定的時間範圍進行分析。
顯示警報-在圖表上顯示信號
推送至手機mt4-向手機發送信號
發送郵件-將信號發送到電子郵件
Great indicator for binary options!
Try what he can do!
Alert is arranged in it so that you are not late with the signal!
You can also customize the periods that suit you! (it is configured for currency pairs)
If you want more, you can always reconfigure and use more!
arrow indicator that works on several indicators, in the settings you can change the color of the arrows and the period! (repeat)
Test it and see it in action!

Hot option premium - A reliable dial indicator that does not draw and shows accuracy.
The signal appears on the previous candle.
Very easy to set up, select a currency pair and adjust the frequency of signals in the “period” settings.
You can also customize the color of the candle yourself; the default is:
-Blue arrow up signal
-Red arrow down signal
Hot option premium is multi-currency and works on all charts.
A very large percentage of good deals.
The best timeframes are M1-M5
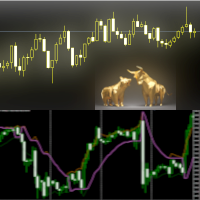
The Trends Change indicator can be used as an anticipator of the next trend, preferably confirmed by Price Action or another oscillator (RSi, Stochastic ..).
Great tool for indices, currencies and commodities.
It works on every timeframe.
Parameters
Range : setting to determine the speed of the indicator
Line_Up : higher RSI value
Line_Down : lower RSI value
Show_Bands : if TRUE shows RSI lines
MaxBars : analyzed bars
Change_Alert : pop-up alert Send App Notification: send

CFF Bounced Trader Signals This is the most accurate reversal indicator for MT4 providing accurate signals to enter a trade without redrawing or delays. It can be applied to: commodities Only. The best results are on the timeframe M5+
IMPORTANT! Contact me after your purchase to get the detailed guide.
Benefits of CFF Bounced Trader Signals indicator
Entry signals without repainting or delays If a signal appears and is confirmed (if the signal candle is closed), it does NOT

This is a powerful indicator that is very easy to work with. Its default setting is for the euro-dollar pair, but with the right settings it can be used in all markets and all time frames less than daily. The basis of the work of the Ranging indicator is to find areas of price range and get signals from it. You can specify the duration of the valid sufferings and the minimum and maximum price in it. It is also possible to determine the number of reliable signals received from each range.
Othe

该指标将根据每个蜡烛的上方或下方绘制一个标签 罗伯·史密斯 斯特拉特 随着它们在您的图表上随着时间的推移而发展。
随着价格的变化,蜡烛可以在三种状态之间切换。当蜡烛第一次打开时,如果它完全位于前一根蜡烛的高点和低点内,那么它将以类型 1 开始。随着时间的推移,如果它突破了前一根蜡烛的高点或低点,它将成为类型 1类型 2,如果价格走势波动且无方向,则它可能会突破前一根蜡烛的相反侧,成为类型 3。
蜡烛
每根蜡烛都由其与前一根蜡烛的关系定义。
类型 1 - 内部蜡烛 - 蜡烛完全位于前一根蜡烛的高点和低点之内。内部蜡烛表明市场处于犹豫不决的时刻。
类型 2 - 趋势蜡烛 - 蜡烛在前一根蜡烛的高点或低点上方或下方延伸,但不会同时延伸到两者之上或下方。
类型 3 - 外部蜡烛 - 蜡烛已突破前一根蜡烛的高点和低点。外部蜡烛显示价格正在扩大,在较短的时间范围内产生更高的高点和更低的低点。
设置
显示内部 如果为真,则显示内部蜡烛的蜡烛编号。
显示趋势 如果为真,则显示趋势蜡烛的蜡烛编号。我经常将此设置保留为 false(默认值),因为我发现它会

FTFC 指的是 Rob Smith 的 The Strat 定义的全时间框架连续性。 该指标在图表上绘制两条线,一条是季度、每月、每周、每日或每小时开盘水平的最高水平,第二条是这些值中最低的水平。这为您提供了一个高于或低于该通道的交易更有可能在一个方向上非常强劲。言外之意,价格走势将更加波动,您可以使用更宽的止损。 还绘制了第三条虚线以显示高点和低点之间的中点。当市场试图将价格推向某个方向时,这通常是寻找支撑或阻力的好地方。如果您通过将颜色设置为无来选择,则可以关闭此行。
设置 包括季度级别 允许您选择在计算中包括季度开盘价,因为有些人喜欢忽略它。 IncludeCurrentTimeframe打开 为真时,如果当前显示的时间范围是 H1、D1、W1 或 MN1,指标将在其计算中包括开放的时段。这是最新版本指标中的新设置。以前,计算不包括当前打开的时间段,这与 TheStrat 不一致。 该设置默认为 false,因此现有用户不受影响,除非他们选择打开它。 MaxMilliSecondsToCalculate 对于加载了大量历史记录(超过 10,000 条柱)的图表,这将限制指标
Big changes in prices (dips) can be opportunity for entering trend reversal trades. Dip histogram shows these big price movements. User can define minimal movement in %, as well as timeframe which will be used for calculation of price movement. Dip histogram input settings: Dip period - timeframe which will be used for price change calculation Price to compare - price type to compare Indication method - percent (alert when price movent is > min. dip in %) / Dip MA (alert when price movement

Introducing the Trend Detection System: Your Key to Unveiling Market Trends with Precision.
The Trend Detection System is a sophisticated MetaTrader 4 indicator meticulously engineered to equip traders with the tools needed to identify and ride market trends effectively. Built upon customized Moving Average principles, this innovative indicator offers unparalleled flexibility and accuracy in trend analysis.
Key Features: 1. Customized Moving Average: The Trend Detection System allows users t

This indicator has two objects, a Lime and Red Point. This indicator takes and combines several built-in indicator functions / requirements and creates more conditions Lime indicates an uptrend and a red downtrend. This indicator reads the total rates in all timeframes and displays the amount in the comment. The likelihood of a correct prediction increases when two dots of the same color are close together. Thank you for visiting, good luck

Black Leopard indicator is a trend indicator which will compliment any strategy.
Features The movement direction of the moving average is indicated by the colors (blue for upward slope, red for downward slope) It does not change color after the candle close. It works on many instruments like forex, metals, stocks, indexes... and on all timeframes Alert function included : email alert, sound alert, and push notification.
Indicator parameters Period: the averaging period Price: type of price

Important notice: Have to be installed altogether with YAHMA indicator [ https://www.mql5.com/en/market/product/66389 ]
Absolutely not as simple as SMA, however, using is still as simple as any other moving averages.
Moreover, you can be informed what is going on higher time frames, where are more important zones.
Minimalist parameter set: Higher Time Frame: (default: H1)
Period: number of calculated bars; the larger, the smoother (default: 200, minimum: 4)
MA method: use LWMA o

Hi friends! Introducing the Currency Strength Indicator Currency Scanner ! The indicator tracks the strength level (percentage) of currencies The indicator allows you to create a picture of 28 currency pairs You can manually track the strength in the table. Strength is indicated as a percentage. Also on the side of the table, the recommended trading pairs will appear, on which you can perform a trading operation. This does not oblige anything and you can only cool down the tools that you need.

市场真的很喜欢整数,它们通常在下跌的市场中充当支撑,或在价格上涨时充当阻力。 该指标旨在以整数值绘制价格水平。它会自动执行此操作,但您也可以选择覆盖它并确定您希望看到的级别。 一轮水平可以像 10 步一样简单,例如 10、20、30 等,或者如果您从事外汇交易,您可能希望看到 0.1 或 0.01 的变化。 该指标绘制两类线,Major 和 Minor,每类都有不同的格式。这使您可以同时查看两个不同电平变化之间的变化。
警报
该指标包括当价格在可配置距离内时在主要、次要或两个价格水平发出警报的能力。
自动设置 默认情况下,该指标将为主要价格和次要价格确定适当的水平。它使用可配置的 DensityIndex 设置来做到这一点,该设置控制您希望随时在屏幕上看到多少行。 如果您设置自己的缩放比例,使用 MajorGap 和 MinorGap 设置,您仍然可以通过使用 ReduceAtScale 设置来获得限制在屏幕上绘制的线数的指标。 请查看屏幕截图以更清楚地了解此功能。
设置 基本配置 重大差距 当设置为 0.0 时,指标会自动计算出合适的刻度 小间隙 当设置为 0.0 时,
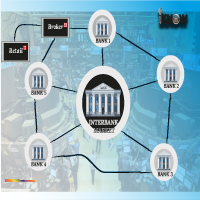
IPDA AND PD RANGES. Interbank Price Delivery Algorithm (IPDA) Range Liquidity and trades in the FX market take place in a decentralized manner as banks, brokers and electronic communication networks (ECNs) interact with one another to set prices. In FX, and ECN is a trading platform or electronic broker that hosts bids and offers and transmit them to users worldwide. ECN broadcasts a price around the world as various participants leave orders to buy and sell. Banks provide streaming prices based

Channel indicator based on the principles of mathematical statistics. It uses neural networks to simplify a lot of complex calculations, which makes the indicator fast, even for weak computers.
How it works The indicator is based on the moving average, the period of which you can set. The indicator analyzes price deviations from the moving average line for the last 1440 or 2880 bars, and each line indicates a certain probability of a price reverse depending on the selected settings: Standard,
RSI tells you oversold and overbought levels, but how can you handle with trending markets with RSI? Solution is CFX Adaptive RSI that recalculate oversold and overbought levels according to a moving average.
Indicator parameters: - RSIPeriod: Period of RSI. - Sensibility: high value means that indicator will be more sensible to trending market. Low value means that indicator will be less sensible to trending market. - MAPeriod: Period of the moving average - TotalHistory: number of candles in

Price Action Trading is an indicator built for the "Price Action" trading strategy. The indicator shows the points of the change in the direction of price movement, the direction of the trend, the dynamics of the trend, the distance traveled in points from the beginning of the change in the trend. This information is enough to trade and get good results in Forex. The Price Action Trading indicator has proven itself very well on GBPUSD, XAUUSD, EURUSD and other major currency pairs. You can inst

CMA dashboard is designed to help traders in identifying trend on multiple timeframes and symbols. It displays a clear state of the overall trend at one place without the need to navigate between different charts and timeframes. This saves time and makes decision making process fast so that potential opportunities are not missed. It is based on Corrected moving averages available here Features
Parameters for signal optimization Inputs for multiple timeframes and symbols Usage Higher timeframe
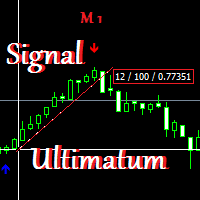
The tool is quite simple to set up and use. The best options are set by default The tool was developed for the forex market The tool is suitable for both beginners and experienced traders and will be a great addition to your trading system or will become the basis for it the tool uses support and maintenance levels in its algorithm This is our own strategy and unique development signals up arrow buy down arrow sale recommended for use on timeframes from m 30 you can trade from signal to signal
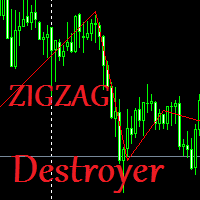
The indicator shows real waves based on alternating upper and lower extremes of the price chart, thus displaying the wave structure of the market. The algorithm of this indicator is absolutely new, everything that connects it is only its appearance, it is based on radically different algorithms and is able to calculate volumes in the market in real time. The wave detection algorithm has nothing to do with ZigZag. The indicator will be very useful for traders trading on the basis of wave analysis
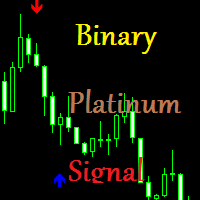
A good and reliable tool if you follow the rules of money management. does not redraw Developed according to its own strategy on a unique algorithm. The indicator is completely sharpened for binary options very easy to use Just add it to the chart and you can start trading Perfect for both beginners and experienced traders. The signals are simple and straightforward. Up arrow buy. Down arrow for sale. Recommended time of expiration is from 1-2 candles. For one transaction, no more than 3% of the
MetaTrader市场是独有的自动交易和技术指标商店。
阅读MQL5.community用户备忘更多地了解我们提供给交易者的独特的服务:复制交易信号,自由职业者开发的自定义应用程序,通过支付系统完成的自动付款和MQL5云网络。
您错过了交易机会:
- 免费交易应用程序
- 8,000+信号可供复制
- 探索金融市场的经济新闻
注册
登录