适用于MetaTrader 4的新技术指标 - 72

Identification of support and resistance areas
A useful indicator for traders
completely free
Can be used in all symbols
Can be used in all time frames
It has three different trends: short term, medium term, long term
Settings:
Clr1,2: You can change the color of the lines
Type Trend: You can determine the trend
Message me for questions, criticism and suggestions
FREE

Hypothetical trend line display
Distance from the trend line
Can be used in all symbols
Can be used in all time frames
An interesting indicator for predicting small waves
The greater the distance from the trend line, the more likely it is to return to the trend line
Settings:
The first three(osic 1,2,3):
are the same as the settings of the zigzag indicator
The bigger these numbers are, the bigger the trend lines and the longer the trend
Back Show:
The number of candles displayed
FREE

Diagnosis of major and minor pivot
Trend detection
with many signals
Can be used in all symbols
Can be used in all time frames
Settings:
Back Show: The number of candles it displays
If you need any adjustments, or have any questions or suggestions, message me
How to trade:
Blue: sell signal
Red: buy signal
Blue and red at the same time: no signal
Exit signal: Opposite signal

Forecasting the future by combining trend and average price
with many signals
Can be used in all symbols
Can be used in all time frames
Settings:
BackShow: The number of candles displayed
Osi: Main setting, the larger the number, the longer the trend
If you need more settings, or have any questions or suggestions, message me
How to trade:
Blue: sell signal
Red: buy signal
Blue and red at the same time: no signal

NOTE: NEXT PRICE WILL BE 550$ Dear Trader I hope you have been eagerly waiting and looking for a tool to improve your trading. I am so glad to introduce my other product to you called Trend Shooter Index. The main goal of this tool is to help traders shoot the trend (target the trend) from the bottom or from the top of the trend for maximum profitability. How is the Indicator designed
This tool is designed to show the following Red arrows pointing down for sell signals. Blue arrows pointing up

A useful dashboard that shows the CCI values for multiple symbols and Time-frames.
It can be easily hidden/displayed with a simple click on the X top left of the dashboard.
You can input upper and lower CCI values and the colours can be set to show when above/below these values. The default values are 100 and 30-100 There are also input colours for when the CCI is positive or negative (but not exceeding the upper/lower levels
Symbols and time-frames are input separated by commas.
Sym
Divergence is one best ways to trade the financial market as it is a leading indicator of price action that detect high probability reversal and continuation setups. The AlgoKing Divergence Detector is an RSI and Stochastics Indicator with Divergence Detection. Features Hidden Divergence for trend continuation. Standard or Normal Divergence for trend reversal. Screen Alerts. MetaQuotes Notifications. Email Notifications. RSI Indicator built in. Stochastics Indicator built in. Types of Divergen
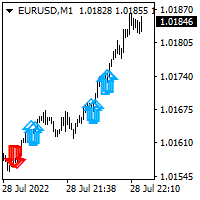
This indicator helps you to build position and profit when market turns in your favor. You will build your full position by trading many small position. Once blue arrow appear on the chart, you could add long position. Once red arrow appear on the chart, you could add short position. I personally spread my full size position in to 5-10 small position. I use small target of 2-5 pips on eurusd pair.

Forex trading support timer: - This is an indicator that supports a trader's trading process. - Before placing a BUY or SELL order, it is advisable to observe what the current time is like, to get the best position when trading. Function of indicator: - Display information about candle closing time of different timeframes (M1,M5,M15,H1), best used when Scalping. - Show market spreads. - Show TimeZone Trading. - Displays the remaining time of a session.
FREE

速度阻力线是确定趋势和阻力线的有力工具。 该指标使用图表极值和特殊的数学公式构建线条。 该指标可用于确定趋势方向和枢轴点。
<---------------------------->
指标参数:
"Depth of search" -搜索图表极值的深度(以条形为单位) "Back step of search" -极值之间的最小距离(以条为单位) "Deviation of price" -同一类型极端之间的允许价格差异 "Line color" -带有相应索引的线条颜色 "Line style" -带有相应索引的线条样式 "Line width" -具有相应索引的线宽 <---------------------------->
你可以在"艾德森*古尔德的稀有作品集"一书中找到更多信息,也可以在私人信息中与我联系。
<---------------------------->
提前感谢所有有兴趣的人,祝你好运征服市场!
FREE

你的高點和低點
UR Highs&Lows 對價格變動及其波動性進行深入分析,並創建價格變動的通道。 該通道現在作為振盪器移動,並與價格偏差重疊,以表明潛在的耗盡和可能的逆轉。
使用 UR Highs&Lows 的優勢:
無參數 您有 3 條線描述價格變動 - 白線是價格的平均值,藍線是價格的極值 直方圖是價格背景下最大偏差的可視化 該界面展示了兩個極端(上部紅色區域和下部藍色區域)上任一條線的耗盡 最大優勢:簡單且可適應所有資產。 有一個特殊的電報聊天,您可以在其中了解最新的工具更新,如果您覺得缺少什麼,也可以發送請求!
為什麼是 UR 高點和低點?
該指標可用作獨立的進入或退出指標。 由於它對價格的依賴 - 它可以應用於每個圖表,其偏差計算算法基於多年的經驗和觀察。
如何使用 UR Highs&Lows ?
請參閱下面的描述以更熟悉它:
設置 沒有任何 展示
價格平均主線(白色):價格的平均值。 價格極值(藍色):價格極值的計算通道。 直方圖:顯示波動率的偏差。 極端區域:價格將耗盡並可能反轉的區域。
添加
我所有的工具

"Scalping trading strategy" - the indicator was created for trading using the scalping system. "Scalping trading strategy" shows on the chart with an arrow where the price will go now. After the indicator draws an arrow, the price will go in the direction of the arrow by at least 20 points. This is enough for us to trade effectively. "Scalping trading strategy" does not redraw its signals. The indicator has many different modes of operation. It can draw an arrow both at the beginning of a new c

The indicator refers to the means of probabilistic analysis. Prediction is performed by the Monte Carlo method together with a mathematical model of a neuron. But, the modeling of samples for this method is made not artificially, but comes from the original "nature", that is, from history. The number of samples and the detail of their modeling is achieved using the lower (relative current) timeframe.
Indicator algorithm :
In general terms, the algorithm boils down to the fact that the ind

價格樞軸點 H1 - 顯示 H1 時間框架上的價格樞軸點的指標,準確度高達 95%。來自 100 的 95 個信號將準確指示相反方向的價格反轉位置。指標不會重繪其值。適用於任何貨幣對的交易。它可用於日內剝頭皮和長期交易。價格樞軸點 H1 將信號顯示為箭頭。當價格反轉時,指標將在圖表上繪製一個箭頭。如果價格上漲,指標會畫一個藍色箭頭,當價格下跌時,指標會畫一個紅色箭頭。信號的準確性使您能夠建立有效的交易策略。我們採用 Sonic 標誌來強調信號的速度。在 93% 的情況下,信號是在價格反轉的那一刻準確繪製的。他們沒有遲到。信號非常快。只有在 5% 時,價格不會立即反轉,而是在幾根柱之後反轉。
指標的好處: 未重繪 向交易者顯示價格方向的變化 非常簡單易用 無需其他設置和設置文件 適用於所有貨幣對 可以使用任何時間範圍。但最準確的信號是在 H1、H4 上。 適合二元期權交易!
指標設置: period - 指標週期。該值越高,過濾器的作用越強,指標繪製的信號就越少。 每個購買此指標並留下評論的人都將收到額外的非常有價值的禮物。購買後私信給我們留言,我們將送你一份禮物!

It could help to calculate Risk-Reward easily before placing a BUY-SELL position. TradeSizeCalculator is a Multi-Tasking Calculator. It will calculate the others when we define the value in one of the columns. Stoploss, risk percentage, risk-money, lot size, take-profit , reward-money, and reward-ratio. Depending on which value is changed. All values in the columns are editable. Also, we can get those calculation results by drag-drop the stop-loss/take-profit line. Parameter: The inputs below ar

Fractal Structures Breakout Trader !!SPECIAL PRICE FOR THE FIRST 10 COPIES!!
A next generation powerfull indicator which brings a new approach to fractal theory Indicator tries to scan and find the fractal breakouts. Momentum, price action and harmonic calculations are also used to complete the algo. Advantages: No Repaint Works on all chart timeframes. Works for every instrument including Currency Pairs, Gold, Oil, Commodities, Indices, Stocks and Cryptocurrencies. Easy to use. User and CPU f

For Nasdaq trading, the most important principle is to know the trend of the fund.
This indicator with 6 green and red lights provides you with the daily path of this important indicator.
This indicator has been tested for 6 months and has a win rate of over 85%.
Be sure to contact me before purchasing to get the necessary instructions on how to use and set up this indicator.
You should use a broker that has dollar index, vix, and commodities. MT5 Version
You can contact us via Instagram,

This indicator provides common shapes as drawing object options. The shapes are rotatable, resizable, draggable, and will keep their proportions (according to their handle trendline) across different chart scales. Multiple drawings are supported.
Shapes: Square Rhombus
Triangle (quadrilateral & isosceles) Circle (grid, overlapped grid, flexi grid, rotatable grid, concentric circles) Features: rays (all object edges will be rays) show/hide each individual drawing type, or all delete last drawn
FREE

CFF Day Trader Machine
CFF Day Trader Machine is the best trading system you will ever find when you want to go right every time with the market so that you will never have to trade against the market again, It’s providing marvelous trading signals based on such and amazing algorithm.
*** 5 Copies left for next price $613 ***

Th3Eng HistoMaster indicator Free Histogram Indicator to detect the current trend direction. The indicator is based on CCI indicator. Also draw arrows when it detect the trend is strong buy or strong sell, with Alerting system (Popup with sound, Email alerting and mobile notification). Also draws a dashboard shows all Time-Frames' current signal.
Requirements
works with all pairs, stocks, CFDs and crypto currencies. works with all Spreads works with all Account types works on all Time-Frames
FREE

极大的提升了交易感官,一目了然的走势展示,简洁高效。 极大的突出展示了行情的趋势脉络,跟随时间周期适应变化,替用户交易者研判了行情走势,简洁高效 同时我们还提供了主窗口和副窗口的展现,有需要可以联系我作者本人,感谢支持。 像传统的renko,又不是传统的renko,技术在发展,同样的砖图可以有不一样的绘制和计算展现。 希望可以帮到大家的交易,再次感谢。
极大的提升了交易感官,一目了然的走势展示,简洁高效。 极大的突出展示了行情的趋势脉络,跟随时间周期适应变化,替用户交易者研判了行情走势,简洁高效 同时我们还提供了主窗口和副窗口的展现,有需要可以联系我作者本人,感谢支持。 像传统的renko,又不是传统的renko,技术在发展,同样的砖图可以有不一样的绘制和计算展现。 希望可以帮到大家的交易,再次感谢。

This Indicator is a very Simple Method to make profit from the market! it has two arrow directions up and down. you can easily buy when you see up arrow and close it when you see down arrow. you can use it for Binary Options too! you also can use it with other indicators like Heiken Ashi and Ichimoku to make a complete System of Trading. it has just two Input Options: nBars: The Number of Candles you want to see the Signals for. ShowPanel: to display or not to display the Panel DoAlert: to Send

Indicator Support and Resistence plain in your chart seven lines; Red line=Resistence 3. Red line=Resistence 2. Red line=Resistence 1. Yellow line= Pivot. Green line= Support 1. Green line= Support 2. Green line= Support 3. adattable in all timeframe (minute 1, minute 5, minute 15, minute 30, Hour 1, Hour 4,Day 1,Week 1,Mounth 1); Buy under support and sell over the resistence;

This is another Arrow Indicator to show the instant direction of the Market. it's no repainting and no lagging. you can easily trade by it's direction or use it on your own System. the later is recommended! you can use it on Automatic Experts too. it's input parameters are consists of: nBars: Number of Bars to be checked EnableAlerts: to send Alert messages when get new Signal. EmailAlerts: to send you Email for new Signals you can simply use it on any Symbol or Time Frame after checking for it'

Magic Lines MT4 is an indicator which can be categorized as trend, levels and channels type. It draws a colored line which is colored in green and red depending where last close is. The value at the current open bar should not be taken into account. This part of the indicator can give us a sense whether it is trending up or down or its going sideways. Magic Lines indicator also draws blue top and bottom levels which can be taken into account for breakouts and false breakouts. A sideway zone shou

CFF New Plan
CFF New Plan is the best trading indicator especially for scalping traders , It’s providing marvelous trading signals based on such and amazing algorithm.
--6 copies has been sold with price $60--
*** 6 Copies left for next price $613***
CFF Follow Me
*** 10 Copies left for next price $613***
* Entry signals without repainting or delays * Error-free opening of trades * Provides signals for any direction sell & Buy * Provides multiple timeframes on a single chart * Colored Histogram based on the market direction * Arrows entry signals
How does the CFF Follow Me Works?
Our CFF Follow Me trading system based on a very accurate "Trend-Following" Trading Strategy. Here's how to Start using ou
AI Signal is an indicator that is a ready to made scalping system that doesn't repaint
Instructions: Load indicator. Use arrows as entries in trends and stay out of sideways markets. Trade with the larger trend and trade only active volatile hours Buy blue arrow above yellow and exit at red arrow or at discretion. Sell red arrow below yellow and exit at blue arrow or at discretion.
Easy to follow and is based on trends. The indicator works on all time frames and assets. Use at your own

Indicator help you recognize trend quickly ( recommended to use TF M30-Daily ) Parameters: Alert when have signal Push Notification to MT4 mobil2 Benefits Easy to use. input parameters is simple The ability to use as filter for any strategy. It work on stock, index, oil, gold, and on all time frames. It has the function of push-notifications, and sound alerts. Importance : Non Repainting Indicator
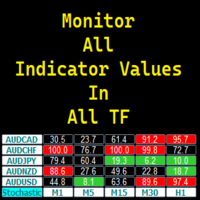
ALL in ONE Indicator Display Indicator values in all Timeframes Display Multiple Symbols/Pairs Fully customizable Click any value/box to open the chart of the corresponding symbol and timeframe Attach multiple instance of the program to display other indicator values Flexible Dashboard Positioning in chart You may request more indicators or additional feature for future updates!
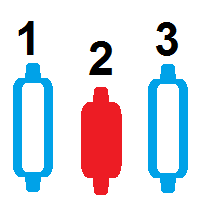
烛台计数器指标 此指标计算任何时间框架图表上的蜡烛数 一个免费的吧台供您在 mt4 上下载 烛台计数器计算较大图表中有多少蜡烛 使用此蜡烛计数器,您可以进行自动烛台计数 免费烛台计数指标供您自动下载和计数柱 bar counter to count the bars count candle counter indicator mt4 count candle MT5蜡烛计数器 如果您对此指标感兴趣,请发表评论,以便我继续改进它 zhútái jìshùqì zhǐbiāo cǐ zhǐbiāo jìsuàn rènhé shíjiān kuàngjià túbiǎo shàng de làzhú shù yīgè miǎnfèi de bātái gōng nín zài mt4 shàng xiàzài zhútái jìshùqì jìsuàn jiào dà túbiǎo zhōng yǒu duōshǎo làzhú shǐyòng cǐ làzhú jìshùqì, nín kěyǐ jìnxíng zìdòng zhútái jìshù miǎnfèi zhútái jì
FREE

UR 趨勢疲憊
UR TrendExhaustion 是不想處理參數值或其他設置的交易者的最佳解決方案 - 它對每個人來說既簡單又直觀易懂。
使用 UR TrendExhaustion 的優勢:
無參數 您有 3 條線最能描述圖表上的情況:趨勢耗盡線、鯨魚資金線和零售資金線。 該界面展示了兩個極端(紅色區域)上任何一條線的耗盡 最大優勢:簡單且可適應所有資產。 有一個特殊的電報聊天,您可以在其中了解最新的工具更新,如果您覺得缺少什麼,也可以發送請求!
為什麼是 UR TrendExhaustion?
在我的整個職業生涯中,我一直在編寫多種指標,並達到了這樣一個地步,即我收集了我所有的知識來編寫這個簡單但最好的 (imo) 工具來進行交易,而不需要圖表上的任何其他工具。 易於理解,易於設置。 該策略的執行方式使做市商很難與它進行交易 - 將死 MM! 您與 UR TrendExhaustion 一起使用的任何其他工具都會增加您的交易,但我一直單獨使用它並取得了很好的效果。 祝你好運!
如何使用 UR TrendExhaustion ?
YT 上有一段

DYJ变色龙基于趋势跟踪和反趋势系统。 DYJ变色龙是一种高概率指示器。该指标使用独特的混合指标,将复杂的指标与用户的判断力相结合。 该指标是一种最先进的Ma交叉和方差算法。 该指示器显示一个彩色方向箭头,指示交易者的最佳进入和退出位置。 当入场是BUY信号,同时它也是上一次入场SELL的离场信号. 你能通过邮件或手机推送接收到信号通知,在通过手机手动开仓
参数 InpPeriod = 50 -- Period InpPrice = PRICE_TYPICAL -- 价格应用方法,您能根据自己的货币对偏好和交易习惯,选择更佳的价格方法 InpMethod = MODE_SMA -- 4种MA模式方法 ,MODE_SMA,MODE_EMA,MODE_SMMA,MODE_LWMA

UR發散觀察儀
UR DivergenceSpotter 是多年經驗的結晶,有時最簡單的方法就是最好的。 一些指標之間存在良好的相關性,但當它們不匹配時 - 價格試圖“重新調整” - 正是在那個時刻我們通過 UR DivergenceSpotter 收到信號。
使用 UR Divergence Spotter 的優勢:
無參數 蠟燭創建後不重繪 當信號不再有效時發出信號(這意味著您可以持有更長時間的交易,將止損設置為 BE 並讓它運行,獲取部分利潤或完全關閉它!)。 該指標是多年經驗和觀察的結果。 它堅固且經過測試。 最好在更高的時間範圍 (h1/h4) 中使用以獲得更好的結果和更安全的信號。
另一種方法是將它與我的其他指標(如 UR TrendExhaustion 或 UR VolumeTrend)一起使用,以獲得更好的信號准確性。 有一個特殊的電報聊天,您可以在其中了解最新的工具更新,如果您覺得缺少什麼,也可以發送請求!
為什麼選擇 UR DivergenceSpotter?
如前所述 - 該指標是將體驗整合到一個指標中。 以某種方式對其進行編碼,

UR 成交量趨勢
UR VolumeTrend 是顯示交易量持續趨勢的最清晰的交易量指標。 與 UR TrendExhaustion 等其他指標完美配合,以發出局部頂部和底部信號。
僅限於 2 個參數 - 值越高,顯示的趨勢越長。 梯度極端顯示成交量可能耗盡以捕捉潛在的逆轉。 兩條線 - 成交量趨勢和平均值。 最大優勢:簡單且可適應所有資產。 有一個特殊的電報聊天,您可以在其中了解最新的工具更新,如果您覺得缺少什麼,也可以發送請求!
為什麼選擇 UR VolumeTrend?
所有人都會同意,成交量是把握趨勢的關鍵。 這個震盪指標是我所有交易量工具的總和,壓縮成一個易於使用的指標。 它以易於查看的方式顯示正/負音量。 後面的界面顯示音量與過去相比是否可能會耗盡 - 或者它是否會推到新的水平。
如何使用 UR VolumeTrend?
請參閱下面的描述以更熟悉它:
設置 Volume Period:值越高,它會嘗試捕捉的趨勢越大 交易量趨勢:此附加行顯示僅基於交易量的潛在反轉條目 展示
漸變界面:顯示基於過去的極值水平。 成交量主線:顯示成交
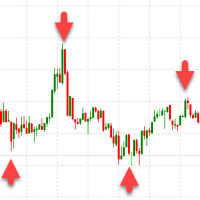
Scalping trader - the indicator is designed for intraday trading (scalping). Does not redraw arrows. Shows possible price reversals on the chart with arrows. The accuracy of the signals is approximately 96%. That is, in 96% after the arrow appears on the screen, the price will go in the opposite direction by at least 40 points for the GBPUSD pair. The trading strategy is very simple. We are waiting for the arrow to appear on the chart. After the arrow appears, open an order in the direction of

indicators to facilitate analysis based on Oma Ally's BBMA strategy by displaying CSAK (CSD), CSM and Extreme labels on the chart 1. Displays the Bollinger Band line 2. LWMA 5-10 High and Low 3. EMA 50 4. Fibonacci 5. MHV . area 6. Alert & Show labels BBMA consists of the use of 2 indicators: Moving Averages Bollinger Bands BBMA consists of 3 types of entries: Extreme MHV Re-Entry Moving Average Settings: There are 5 MAs used in the system: 2 High Moving Averages, 2 Low Moving Averages and
FREE
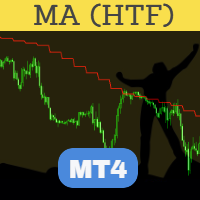
完善的 MA(移动平均线)HTF(更高时间框架)可能是最先进和最可靠的 HTF 指标。该指标在执行方面进行了高度优化,带有 MT4 平台提供的 MA 指标的标准设置。 “将指标放在图表上,任何时间范围。您可以在指标输入中选择更高的时间范围。同一指标可以在图表上多次使用,以从多个时间范围或不同的 MA 值绘制 MA。 一个必备工具,用于在现有图表上以较低时间范围覆盖较高时间范围的 MA。 “不使用给他们的工具的人只会伤害自己。” “我们塑造了我们的工具,然后我们的工具塑造了我们。”
主要特征 高度优化: 也许是目前最快的 MA HTF 指标。只更新新出现的蜡烛,不更新过去的蜡烛。过滤在 MT4 中收到的重复报价。仅此功能就使其非常适合在 VPS 上运行。 更新运行蜡烛: 一些 EA 不需要读取运行蜡烛 [0] 值。因此忽略它的情况可以在 VPS 上节省良好的价值 CPU 周期。这是另一个有助于优化的功能。 错误检查 :指标覆盖来自更高时间或当前时间框架的 MA。如果我们错误地将图表的时间范围切换到比指标中选择的时间范围更高的时间范围以进行叠加,它将切换到当前时间范围。 标准移动平均线
FREE

This is a Multi pair and Multi time frame dashboard. The founder of the system is Mr. Oma Ally, which is a system based from Bollinger Band and Moving Average(BBMA). BBMA consists of the use of 2 indicators: Moving Averages Bollinger Bands BBMA consists of 3 types of entries: Extreme MHV Re-Entry Rejection EMA50 This Dashboard Help you to scan current Extreme, Reentry setup, Rejection EMA50 and also MHV How to read signals:
find the same color in 3 different timeframes in succession
For exam
FREE

Professional Support&Resistance Indicator. This indicator is primarily intended for professional use by brokers. There are countless options to choose from and it is one of the best tools in the stock market today. The indicator is optimized for use with EAs.
For programmers to retrieve output index value is for MQL4; (EXAMPLE)
bool buySNR=false,sellSNR=false;
char count=100;
char limit=1;
char dist=3;
for(short cnt=0;cnt<=count;cnt++)
{
double snr_middle=iCustom(NULL,TF_,"::Indica
The best indicator for Binary Options is now available at the MQLMarket, this version is already configured and optimized to operate with Binary Options, Forex and Cryptocurrencies. It is composed of a momentum algorithm that looks for better opportunities in the market, bringing you the best points to open your positions with low risk and high proportion of gain.
The MQL version can also be incorporated into the MT2 signal automator.
Product features Common signals (Oscillator) S
!! FLASH SALE !! Over 80% off !! For ONE week only. Now only $47 - normally $297! >>> Ends on 30 June 2023 - Don't miss it!
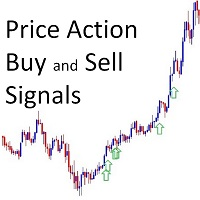
Buy and Sell Arrows On The Chart According To Price Action Sends Alerts On MT4 To Your Phone To You Email
Does NOT repaint. Works on any pair, any timeframe.
10 Activations allowed so you are free from limitations. MT5 Version here . For spreads from a tiny 0.1pip RAW/ECN Accounts, click here . Check out my Waka Esque EA signal here: >> High Risk
MetaTrader市场提供了一个方便,安全的购买MetaTrader平台应用程序的场所。直接从您的程序端免费下载EA交易和指标的试用版在测试策略中进行测试。
在不同模式下测试应用程序来监视性能和为您想要使用MQL5.community支付系统的产品进行付款。
您错过了交易机会:
- 免费交易应用程序
- 8,000+信号可供复制
- 探索金融市场的经济新闻
注册
登录