适用于MetaTrader 4的免费EA交易和指标 - 31

根据波动性,奖励交易头寸的潜在风险基于平均真实范围显示。 点击"买入或卖出"按钮时,会显示风险回报框! ATR计算的一个效用,为一个不属于何时关闭交易的艰难决定的问题感到高兴。 这件事将有助于你的风险管理决定.
规格说明 平均真实范围是一个常用的指标,以点或价格衡量市场的波动性。 真实范围是在任何给定时间段内烛台的最低交易价格和最高交易价格之间的差额。 平均真实范围,在所有,平均这些高点和低点的"前"天。 例如,ATR指标的默认设置为我们提供了14天的周期。 ATR收集点值的高点和低点,除以14天。
但当然,这超出了通用指标ATR。 事实上,三个完全不同的TPs完全依赖于他们自己的时间框架来实现不同的pip消耗。 烛台的规则在技术上是不同的每个时间框架。 因此,当我们使用相同的时间段时,我们会发现每个时间段的结果不同。
例子::
时间段/天数占:14/时间段:M30 时间段/天数占:14/时间段:H1 时间段/天数占:14/时间段:H4 ^这些将提供不同的平均真实范围^ 这里是我喜欢3TP的权力所在和原因:理论上,尾随可以发生在第一个TP朝向第二个TP。 第三个T
FREE

The indicator monitors price movements in relation to a dynamic trailing stop line derived from the Average True Range (ATR). The trailing stop line adjusts based on market volatility, with the ATR determining the distance of the stop from the current price. This allows the stop to widen during periods of high volatility and tighten during calmer market conditions. The indicator tracks how the price interacts with this trailing stop line, marking potential reversal points when the price crosses
FREE

Tool to send alerts to the phone when the account is in a negative balance.
- Push Noti to phone: Enable Push notifications to phone - Percents Equity/Balance, %: Percents loss - Loss amount, -$: Money loss Note: You need to Enable Push notifications on MT4 and enter your MetaQuotes ID The tool only serves the function of sending notifications to your phone when the account is in a negative balance
FREE

Hello all. This indicator helps you to open a trade, when break out occurred, also you can add to your position and ride it if trend continued. I use it on 1-5 min chart, as you can use short stop loss. Also profit target should be small as well. It is better to enter few small position, so you can book some profit early and ride the rest for bigger gains. Look at the past to have a plan. Enjoy.
FREE

Features:
- Moving Average Slope for Max Past Bars - Slope Period - Slope Thresholds - Multiple Slope Type options - See slope visually as a histogram - Info Panel Show/Hide Slope Calculations and Types:
The slope value is calculated using the Slope Period. Suppose Period is 5, it will check the MA value for bar (x) and bar (x+5). And find the slope angle between them.
Read detailed description about Slope Types and Settings here: https://www.mql5.com/en/blogs/post/747651
FREE

White Crow Indicator
by VArmadA A simple yet powerful candle analysis based indicator using the White Soldiers & Crow patterns.
Works with timeframes 1H and higher and tested on all major pairs. Pay attention to the signal: An arrow indicating a long or short entry.
How It Works:
Arrows indicate a ongoing trend. After multiple bullish or bearish candles in a row the chances for another candle towards that trend is higher.
Instructions: - Crow Count: Set the number of candles that need to s
FREE

Th3Eng HistoMaster indicator Free Histogram Indicator to detect the current trend direction. The indicator is based on CCI indicator. Also draw arrows when it detect the trend is strong buy or strong sell, with Alerting system (Popup with sound, Email alerting and mobile notification). Also draws a dashboard shows all Time-Frames' current signal.
Requirements
works with all pairs, stocks, CFDs and crypto currencies. works with all Spreads works with all Account types works on all Time-Frames
FREE

If you need to quickly open grid of pending orders (Buy Limit, Sell Limit, Buy Stop, Sell Stop) on a certain distance from the current price, this script will do all the routine for you.
Usage Run the Script on a chart.
Input Parameters Lots - Lot size for pending orders. OpenDirection (SELL_LIMIT, BUY_LIMIT, SELL_STOP, BUY_STOP) - Type of pending orders. HowManyOrders - Number of orders to be opened. StepPoints - Distance between orders in points. StopLoss - SL Level Points TakeProfit - TP Le
FREE
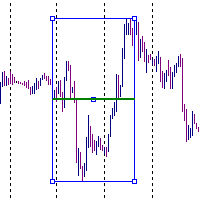
It is just an alternative fibo lines, because mt4 have is a very strange drawing of fibo lines A simple Box (Rectangle) graphic element with adjustable levels binding: it is possible to specify up to 17 custom levels, all rectangles on the chart with the given prefix in their name are processed. Levels are specified in % of the height of the rectangle. A convenient graphical element for analyzing charts by growth-correction levels. Enjoy your work!
FREE

The indicator is designed to determine the pivot level for a group of candlesticks and the trend direction. no repainting calculation is done on an active candle if candlesticks are above the main line, the trend is upward if candlesticks are below the main line, the trend is downward breakdown of the main line signals a trend change or a price rebound two display modes, normal and with acceleration (ModeLite) an auxiliary line displays the resistance line
Configurations BarsHistory - how many
FREE

Indicador "Trade Zones: Supply and Demand Opportunities" para MetaTrader: Eleva tu Trading con Precisión Estratégica El indicador "Trade Zones: Supply and Demand Opportunities" es una herramienta revolucionaria diseñada para potenciar la toma de decisiones de los traders al identificar claramente las zonas de oportunidad basadas en los principios fundamentales de oferta y demanda. Este indicador, compatible con MetaTrader, proporciona una visión intuitiva de las áreas críticas del mercado donde
FREE

DG Equity Monitor is a useful tool that keeps track of the daily transactions made on the account. The EA automatically and instantly closes all the trades running based on two conditions: 1. If the daily profit target is hit. 2. If the maximum drawdown is reached. An alert is sent immediately one of the above conditions are met.
Parameters: Show Account Info -Choose whether or not to display the Account Info on the chart.
Show Pop Up Alert -Show alert on chart when either condition 1 or 2 are
FREE
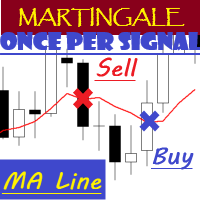
EA "MA Line" with martingale feature
EA will open position once per signal
To see how EA works, please watch the video below. In the video, I perform parameter optimization and do a backtest. The parameters that are optimized are: - MA Period - Stop Loss - Take Profit
For the future, I will try to optimize and test EA, especially the expert advisors in the mql5 community. hopefully it can be useful for colleagues in the mql5 community.
FREE

QuantumAlert RSI Navigator is a free indicator available for MT4/MT5 platforms, its work is to provide "alerts" when the market is inside "overbought and oversold" regions in the form of "buy or sell" signals. This indicator comes with many customization options mentioned in the parameter section below, user can customise these parameters as needful. Join our MQL5 group , where we share important news and updates. You are also welcome to join our private channel as well, contact me for the pri
FREE

The new version of the trading panel, which now has the ability to separately close Buy and Sell orders, display targets for all orders on the chart, as well as the ability to use the panel to trade with brokers working on the FIFO rule. Also, the new version adds option buttons for separate management of open orders.
It has a convenient visualized interface and intuitive control without a lot of additional tabs to which traders have to be distracted and switch their attention. Thanks to this,
FREE

Automatic advisor designed for the forex market.
This trading robot is based on breakdown of trading levels.
All types of accounts are suitable, but it is better to use accounts of the Standard and ECN types.
The timeframe can be used any, but not higher than 1H. The system is waiting for breakdown of the level and closing of the bar. In simple language, you can set the time interval more simply you can skip a signal or it's too late to go into a deal.
The Expert Advisor always displays Stop
FREE

The VR Close orders script is designed to close positions in the terminal at a profit or loss mark set by the trader. The program is written as a script and can work together on the same chart with any other indicators and expert advisors. The program has a simple visual panel and is easy to configure with the mouse. With this program's help, the trader can automatically close positions and delete orders depending on the conditions set. There is often a situation when you need to close position
FREE

This is Only Demo Version.
Download the full version from this link Original Hamster_MT4
(Very Fast EA no Graphics)
The Lite Hamster Scalper is a Trading Robot with no use of Classic martingale. Schedule scalping Options. it uses some Indicators as a filter to maximize Correct entries. Download The Red Sapphire! Recommendations : Lot : 0.01. Balance : 100 USD. Pair : EURUSD. TimeFrame : 5Min. Spread : 30. Broker : Trusted Brokers Inputs descriptions : Initial Lot - Initial lot s
FREE

This indicator is based on Mr. Mark Fisher's ACD strategy, based on the book "The Logical Trader."
- OR lines - A lines - C lines - Daily pivot range - N days pivot range - Customizable trading session - Drawing OR with the desired time Drawing levels A and C based on daily ATR or constant number - Possibility to display daily and last day pivots in color zone - Displaying the status of daily PMAs (layer 4) in the corner of the chart - Show the order of daily pivot placement with multi-day pi
FREE
Hi Friends, This free indicator displays Tick chart on MetaTrader4 platform. Feel free to use it for Day trading or Scalping. Please give generous reviews and feedbacks for the product. All The Best!
Note: When this indicator is initially applied to a chart, it will not show any output. Once price starts moving then Ticks will start getting displayed. Thus when markets are closed, it won't have fresh ticks to display.
About us We are a small team of professional traders with experience in fore
FREE
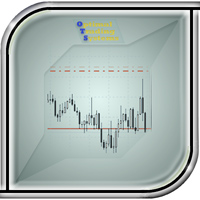
The utility manages other EAs' orders as well as the ones opened manually. It is capable of trailing the price (trailing stop function), set a stop loss and take profit if they have not been set before. When configuring the utility for an EA having no trailing stop function, place it to the new window with the same currency pair specifying the same Magic value (as for the EA orders the stop loss is to be applied to). You can set any timeframe. It does not affect the utility operation. Set Magic
FREE
============ FREE =============
Objective: To properly manage risks and quickly execute trades Works on all timeframes and currency pairs Quickly place a trade
Prevents bad entries when executing a trade by limiting max spread Set your entry and stop loss at better price Set fixed risk amount/percentage per trade Automatically calculate position/lot size based on risk amount/percentage Set proper stop loss level by setting min and max pips Other Tools: https://www.mql5.com/en/market/product/
FREE

Индикатор сглаженных Bollinger Bands (xBB)
Входные параметры: xBB Period - период усреднения xBB Price - используемая цена ( 0 - CLOSE | 1 - OPEN | 2 - HIGH | 3 - LOW | 4 - MEDIAN | 5 - TYPICAL | 6 - WEIGHTED) xBB Deviation - отклонение xBBColor - цвет индикаторных линий xBB Width - толщина индикаторных линиц Принцип работы
Индикатор перерассчитывает стандартный технический индикатор Bollinger Bands (дважды усредняет получаемые значения iBands). Период усреднения индикатора соответствует двой
FREE

APriceChannel is a modification of the standard Price_Channel indicator. The EA draws 2 levels - the upper level shows the price High for the specified period of time, the lower level shows the price Low for the same period. In addition to the period, you can set vertical offset in points to widen the channel up and down. This prevents false breakouts of current support/resistance levels.
Inputs Period - time period in bars - the number of bars to calculate the price High/Low. Offset up and dow
FREE

FREE

This practical tool let you setup your keyboard to have shortcuts and hotkeys to change Chart TimeFrame.
Bring your trading to another level by actually take fast and smooth control of switching Time Frames without losing time clicking all over the Meta Trader Terminal. This tool is born due to scalping issues, where switching from higher timeframe and lower timeframes is really mandatory to make a multi timeframe analysis of the trading setup. Uplift your trading activity, by letting your ke
FREE

This indicator draws regular bullish and bearish divergences in real-time onto the charts. The algorithm to detect those divergences is based on my 10+ years experience of detecting divergences visually. The divergences are drawn as green and red rectangles on the charts. You can even do forward testing in the visual mode of the strategy tester. This FREE Version is restricted to EURUSD and GBPUSD. The full version without restrictions is here: https://www.mql5.com/en/market/product/42732
Param
FREE
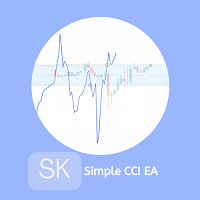
The trade of this EA is based on The Commodity Channel Index (CCI)is a momentum-based oscillator used to help determine when an investment vehicle is reaching a condition of being uptrend or downtrend. with customizable lot size (use martingale or not), stop-loss, and take-profit levels. Easy to use and Simple Recommended Timeframe M30, H1 others timeframes with the appropriate settings. A low latency vps is always recommended. Works for ECN/Non-ECN brokers and 2-3-4-5 digit symbols Built-in
FREE

该指示器基于renko,但其周期等于ATR指示器的周期。 XOATRHIST版本指示器,在图表上显示波段。更加信息化。 关闭波段以外的柱形,会形成x或者o , 这时候报警指示灯会提示 参数: §ATRPeriod - 用于计算ATR的步骤周期。§ 注意:指示器以收盘价格运作,因此需要考虑形成的柱形。 ------------------------------------------------------------------------ ------------------------------------------------------------------------ ------------------------------------------------------------------------
FREE

Aggressive trading robot, be careful over the long term but for a fun account to try to make gains quickly without fear of losing your investment, it can make a profit in a good period. This expert always takes at least two positions in buying and selling. It uses the so-called hedging system to compensate for losses on one side or the other. It can be used with or without indicators for the opening of a trade, it is however more judicious to enter the purchase or the sale with good signals. Tw
FREE

The script sets Fibonacci levels on the chart using maximums and minimums visible on the chart. The script names Fibo with such timeframe on which it has been launched (Fibo D1 or Fibo M30, etc.), therefore preserving previously constructed levels on different time charts. This instrument will be useful for those who start studying Fibonacci levels and those who need to form these levels in a speedy fashion. The script does not have additional settings. Fibonacci lines can be amended in standard
FREE
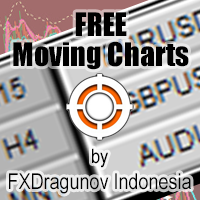
The Symbol Changer Indicator for MT4 is an amazing tool to switch and display any desired currency pair chart and any time frame. Forex traders can display the desired charts with the click of a mouse directly from any open chart. The symbol changer indicator for Metatrader is an essential tool for trend traders working with a top-down approach.
The symbol changer indicator shows all the available trading instruments in the market watch window. It also displays all the currency pairs as buttons
FREE
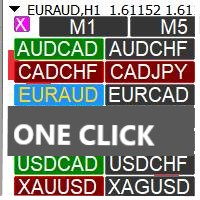
Profit Loss Symbols Dashboard Dashboard displays all manually entered pairs in settings and shows their profit loss information. One click to navigate between all pairs on one chart. Dashboard can be hide or displayed. Green Colour: Symbol(s) in Profit Red Colour: Symbol(s) in Loss Blue Colour: Current Chart Yellow Colour: Timeframe Selected
TRY HAWA GOLD WITH 80% WIN RATE
MT4 VERSION: https://www.mql5.com/en/market/product/58832 MT5 VERSIION: https://www.mql5.com/en/market/product/59276
Pleas
FREE
Please remember to leave a review for improvements thank you Overview of Key Functionalities: Buy Signal Conditions : The Stochastic Oscillator's main line crosses above the signal line. The closing price of the current candle is higher than the previous candle's close. The current closing price is above the EMA (Exponential Moving Average). The Stochastic value is below 50. When these conditions are met, a buy arrow is plotted, and alerts (audible or push notifications) are triggered. Sell Sign
FREE

Fully automated and safe medium-term multicurrency trading robot based on a strategy consisting of several standard indicators. The LockerStop parameter activates the virtual protective stop logic. If LockerStop is not zero, and the loss of an open positions is greater than LockerStop , the EA opens an opposite protective position. The closure of two positions is based on interval virtual stop logic. It is recommended to use the H1 timeframe and the following currency pairs: EURUSD and GBPUSD. C
FREE

The professional utilities "Ichimoku Waves Meter" to analyse graphs using the correct interpretation of Ichimoku kinkōhyō!
Is a graphic program that allows traders to quickly and easily measure the proportions between the indicated points on the price graph. This time and price indicator is a basic tool for analysing the chart according to the Ichimoku strategy on the MT4 platform. Using this tool allows an insightful and complete analysis of time waves as well as price waves in a very short ti
FREE

TrendFinder VolumeI are Colored candlesticks showing the trend based on Volume and Slope of Trend
This indicator will give you the color change on the next bar on the confirmation candle and will never repaint Lime Green = Possible Buy (Volume up), Teal Green = Bullish Weak (Volume Decreasing), Red = Possible Sell (Volume up) , Orange = Bearish Weak (Volume Decreasing)
TrendFinder Volume is optimize to trade on any market and to be used trending and None trending markets. For best results use
FREE

Percentage Profit/Loss Indicator for MetaTrader 4 The Percentage Profit/Loss Indicator for MetaTrader 4 (MT4) displays the percentage impact of open trades’ profit or loss in relation to the account balance. It provides a clear overview of how current open trades influence the overall account balance. Functionality Calculates the total profit or loss from all open orders. Computes the profit or loss percentage as follows: Profit Percentage = (Total Open Orders Profit or Loss / Account Balance)
FREE

This EA does not place pending orders, but forms a virtual grid according to the settings. The EA showed maximum efficiency on a pair of EURJPY. The work of the adviser can be seen on the information panel. For stable work on a cent account you need at least $ 600. With such a deposit, the EA withstands recoilless movement of the price of 4000 pips and does not lose the starting depositю
FREE

This EA is literally a reverse of Recovery Zone Assistance, as its name says ... It is an assistant, an expert advisor that monitors all the orders for the asset in which it has been placed, no matter if that order was by some other expert advisor or by the trader placed on the Manually, he will start his work after each order that is negative. Find Recovery Zone Assistance on https://www.mql5.com/en/market/product/68909 This Expert Advisor is based on this sistem on video "Recovery Zone" on
FREE

万能线段划分指标简介: 万能线段划分是依照两根相互缠绕的均线,依金死叉为标准,将金死叉两边的高低点进行连接开成线段划分。本指标可以设定不同参数多级别叠加使用。 万能分段的原理: 在任意一组均线组成的均线系统中,均线之间的相互缠绕,形成的金死叉是有位次关系的。这点,作者在这里算是首次对外公开这个秘密。上图的均线系统中,走势处于一个较大级别的振荡行情中,均线之间相互缠绕比较频繁,金死叉的数量较多,所以,情况比较复杂。 我们知道,均线可按其周期大小进行位次排序。上图均线依照周期从小到大排序为:MA10,MA30,MA60,MA144,MA233,依照这组均线的位次关系,将每相邻两根均线金死叉做上标注。如:MA10&MA30金死叉标注为“1”,MA30&MA60金死叉标注为“2”,MA60&MA144金死叉标注为“3”,MA144&MA233金死叉标注为“4”。我们将两相邻均线金死叉完全标注完毕后,发现图上还有部份金死叉并未被标注到,这些未被标注到的金死叉全部是非相邻均线之间发生的金死叉。我们依照以上方法,可以识别出均线组之间金死叉的级别位次关系。市场行情的发展是依照此级别位次关系,从小到大
FREE

The Volume Weighted ATR indicator is a helpful tool for measuring market activity. It is based on the idea of the Volume-Weighted ATR. Combining these two elements helps identify potential turning points or breakout opportunities. The indicator for the classification of the activity of the market uses the moving average and its multiples. Accordingly, where the VWATR bar is located (relative to the moving average), it is labelled as ultra-low, low, average, high, very high or ultra high. Th
FREE

Diversify the risk in your trading account by combining our Expert Advisors. Build your own custom trading system here: Simple Forex Trading Strategies
The expert advisor opens trades when the SMAs cross and when the WPR has left overbought/oversold areas. The SMAs are also programmed to close the trades if the trend changes. The Stop Loss, Take Profit, and Trailing Stop are calculated based on the ATR indicator. The recommended currency pair is NZDUSD and the recommended timeframe to operat
FREE

Trender EA - автоматическая система, в основе которой заложен принцип торговли по тренду. Сначала система идентифицирует направление тренда и после этого ищет точки для входа в сделку. Уровень стоплосс определяется автоматически, а тейкпрофит на основе рассчитанного стоплосса. Советник оснащён системой сопровождения сделки "От цели к цели" - системы способной брать несколько целей с частичным прикрытием сделки. Настройки: Параметр Описание ID EA Идентификатор ордеров советника Mode trade Режи
FREE

描述 这款指标在主要金融工具的窗口里绘制彩色线性市场情绪图表。 它有助于判断支撑和阻力级别。 目的 本指标可以用于手工,或自动交易 EA的一部分。对于自动交易, 您可用的指标数值缓存区为 双精度 类型: 上升线 - 缓存区 0, 必须不等于 EMPTY_VALUE。 下降线 - 缓存区 1, 必须不等于 EMPTY_VALUE。
FREE

The Expert Advisor builds a grid of orders, defining inputs by built-in setups. After accumulating the profit specified in the settings, it closes the remaining orders to breakeven. Open “breakout” orders create a grid according to the trend, and each separately “trailing” order allows you to maximize profit from the market. Please see all my products: https://www.mql5.com/en/users/en_coding/seller
Benefits: a unique algorithm for constructing a grid of orders, eliminating the minimum delta be
FREE

当市场与您的交易相反时,保护您的帐户免受追加保证金的影响。
使用Mar,网格,平均时管理风险。它们不再是危险的,而是可以控制的
使用此EA实用程序伴随每次MT4安装
当交易不利时,此EA可以保护您的资金:
最大的金钱损失, 最大提取/股本损失百分比, 您的最低资产净值达到 那些先到达
交易简单,直接,强大
在货币选项卡之一中安装此EA,它将监视来自交易终端的所有交易。
简单,轻巧且非常有用
Dāng shìchǎng yǔ nín de jiāoyì xiāngfǎn shí, bǎohù nín de zhànghù miǎn shòu zhuījiā bǎozhèngjīn de yǐngxiǎng. Shǐyòng Mar, wǎng gé, píngjūn shí guǎnlǐ fēngxiǎn. Tāmen bù zài shì wéixiǎn de, ér shì kěyǐ kòngzhì de shǐyòng cǐ EA shíyòng chéngxù bànsuí měi cì MT4 ānzhuāng dāng jiāoyì bùlì shí, cǐ
FREE

Introductory Pricing for one month
Brute force trader is specially designed to find the best entry point and exit point with the regular tested and proven indicators. The EA will automatically analyse the market and will follow trends with the right entry exit points. Since the timeframe it is using is 30 minutes, the chances that you are stuck into a long trade is very low. Thought it does not use stoploss but it has the
FREE

stoch_bot ea是一个简单的机器人,用于基于随机指标的超买/超卖水平交易。
为了方便交易者,增加了许多功能,使交易更加舒适和安全。
Ea交易有一个内置的作者指标,以防止单向网格。
推荐工具:USDCHF ;
GBPUSD;
欧元兑美元;
美元兑日元;
USDCAD;
澳元兑美元;
欧元兑日元;
推荐的最小mm和设置: 美元兑瑞郎,存款=1000美元,手数=0.01,该工具的预期年利润=15-25%;
GBPUSD,存款=$1000,手=0.01,工具上的预期年利润=25-55%;
欧元兑美元,存款=1000美元,手数=0.01,该工具的预期年利润=25-75%;
USDJPY,存款=1000美元,手=0.01,该工具的预期年利润=30-45%;
美元兑加元,存款=1000美元,手数=0.01,该工具的预期年利润=20-35%;
澳元兑美元,存款=1000美元,手数=0.01,该工具的预期年利润=50-75%;
EURJPY,存款=$1000,手=0.01,工具上的预期年利润=30-45%;
在多货币交易中,EA分别放置在货币对的每个图表上,并
FREE

Objective: To automatically show the Fibonacci entries from last candle. Inputs: 1. Show/Hide the Fibonacci entries 2. Set where the Fibonacci will draw, 0 = current, 1 = last bar … (Default = 1) 3. Set the Fibonacci color 4. Set the line style 5. Set the minimum candle size automatically/manually in which the fib levels will appear 6. Set the candle size based on ADR/X Fibonacci levels: 23.6, 38.2, 50 Other Tools: https://www.mql5.com/en/market/product
FREE

Investment Castle Support and Resistance Indicator has the following features: 1. Dictates the direction of Buy or Sell trades based on Support and Resistance Levels automatically . 2. Candles stick colors will change to Red for Sell and Blue for Buy (Default settings, user can change from the inputs). 3. This indicator is built-in the Support & Resistance based Investment Castle EA which works with Psychological Key Levels "Support & Resistance".
FREE

Commodity Channel Index and Moving Average [CCI MA] A combination of CCI and MA to create a crossover trading setup Input parameters: signal mode: set it to true if you want to plug it into STAT (Signal Tester and Trader) arrow shift: distance between fast EMA line to arrow on chart price line filter CCI period CCI price method Moving average period Averaging method upper level lower level You can find the best setting for 4 hour EURUSD on this video
FREE
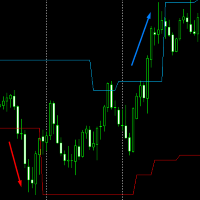
Volatility Channel from JagzFX helps you find breakouts by displaying a channel on the price chart. Volatility Channel is simple to use - there are no parameters - and works on any timeframe. BASIC USE of Volatility Channels The channel can be used as a 'No Trade Zone': you don't trade when the price is inside the channel. However:
When the price breaks above the channel: go Long. When the price breaks below the channel: go Short. The indicator works on all timeframes to suit your trading style.
FREE

The MACD_stopper_x2 indicator shows where the trend has a tendency to stop or reverse. It uses the standard MACD indicator and a proprietary formula for processing data obtained from MACD. There are 2 types of stop/reversal signals: Small cross - probability of a trend stop/reversal is 70-80%; Large cross - probability of a trend stop/reversal is 80-80%; If there are open trades (for example, BUY) on the symbol the indicator is attached to, and the BUY trend ends, the indicator sends push notifi
FREE

Usual martingale grid. The decision-making logic is based on 3 lines of the Moving Average indicator. In the settings, the period of only the first line is set, the periods of the remaining two are calculated based on the first (the period of the second line = the period of the first line multiplied by 2, the period of the third line = the period of the first line multiplied by four and + the period of the first line)
Buy signal: The first line is directed upwards and is above the second and t
FREE

一个简明的趋势与震荡的标示指标。 版本升级:增加预警及通知,增加买卖方向建议,优化界面显示。 更多编程服务可加微信 luolin9687
使用红黄绿三色来标示。 红色表示空头趋势(下跌)。 绿色表示多头趋势(上涨)。 黄色表示震荡区域。 从黄色转变为红色时,行情可能从震荡转变为下跌趋势。一段连续的红色,说明下跌趋势很强。 从黄色转变为绿色时,行情可能从震荡转变为上升趋势。一段连续的绿色,说明上升趋势很强。 指标的上半部分区域和下半部分区域若同步为红色,表明下跌趋势已经形成共振,接下来大概率走出一段空头趋势。 若上下 同时为绿色,表明上涨趋势已经形成共振,接下来大概率走出一段多头趋势。 若上下同时为黄色,表明当前行情为震荡。
参数可调。 //+-------------------------------------------------------------------------------------------+ 特别提示 市场行情是不确定的,任何指标都是根据行情价格的演变而来,不保证使用此指标的盈利性。
FREE

Same behavior of https://www.mql5.com/en/market/product/25552 but fixed lot 0.01 The EA waits for a spike according to a specific logic and opens a position in spike direction setting stop loss and take profit. When positions are in profit they are managed with smart trailing mechanism based also on elapsed time from opened position. It works with 5-digit and 4-digit broker. Must be used on the M1 chart. Does not need historical data. It does not use Martingale Grid Hedge
Parameters spikeFilte
FREE

The Price Volume Trend Oscillator (PVTO) is a powerful technical analysis tool designed to provide insights into the relationship between price movements and trading volumes. This indicator offers a unique perspective on market trends, helping traders identify potential buying and selling opportunities. Parameters: EMA Short Period: Defines the short EMA period for calculating the PVTO. Default 3 EMA Long Period: Specifies the long EMA period for PVTO calculation. Default 10 EMA Signal Period: S
FREE

Have a nice day, everyone. I present to you a free advisor. This Expert Advisor is built on the same algorithms as my other Expert Advisors. The EA does not use Martingale. There is an automatic calculation of the lot from Risk. Also automatic TakeProfit and StopLoss. The EA is fully functional. Perhaps not as often as he wants to trade, but trades. Now why is it free? I was repeatedly approached and asked that I give some kind of adviser. Now I can not write to me, but just download. I n
FREE

This indicator works by plotting fractals on the chart as arrows that can be used as buy or sell signals. It is a great tool for both new and experienced traders as it provides a clear visual representation of the market and helps traders identify fractals. Although it repaints, it can be used quite effectively in conjunction with other tools to filter trading strategies.
We use this indicator in this way in our RoyalFractals II Expert Advisor, which you can purchase on the MQL5 Market: https:
FREE
This indicator help you to easily calculate the price moving. You can change the gird size withing the input parameter for your trading style, such as hedge, swing trader, ect. It can let you easy to find your takeprofit and stoploss target price in chart.
For more about my tools and EA, you can join my channel below, thank you. Telegram channel: t.me/HenryEAChannel
FREE
Track your overall trades! Monitor New Fox is an excellent indicator, which displays your current profits, being them monthly, weekly, and daily, that is, all profits obtained when you opened the mt4. Our brand new Monitor New Fox indicator is able to unlock all advanced features of MetaTrader 4. This indicator can graph with simple data key meta trader account data (Balance, Equity, Free Margin, Current Profit/Loss, Profit/Loss total, amount of open position(s) and size, etc.) and all this in a
FREE

NostradamusMT4 - мощный индикатор из набора профессионального трейдера. В основе индикатора лежит авторский метод Андрея Спиридонова расчета цены (ESTIMATED PRICE) для текущей цены свечи. Данный индикатор является самостоятельной торговой системой. Индикатор подходит для работы на классическом рынке и рынке бинарных опционов.
Преимущества
Индикатор не перерисовывается; Работает на любых временных интервалах; Работает с любыми торговыми инструментами; Отлично подходит для скальпинга и торговли би
FREE

What is The Commitment of Traders (COT)? The Commitment of Traders (COT) report is a weekly publication of net positions in the future market that is released on Fridays by CFTC commission. It is an outline for the commitment of the classified traders as commercial traders, speculators (non-commercial traders), and non-reportable traders. We use this report to understand the dynamics of the market. The commitment of commercial traders is not important for us because they take a position to he
FREE

Suitable for multi time frame market direction prediction. Green and red color indicate the buy and sell call respectively. Green indicator is denote buy call and Red indicator denote the sell call. push notification is available to send instant message to you when green or red indicator will be appear. you have to activate the option at the time of mapping this indicator to you chart
FREE

The currency strength momentum has a lot of similarities with currency strength meter presented in the previous page, but the difference are much more pronounced. You can try putting both in the same chart and see the difference in results. Currency strength momentum measures strength of a currency based on (you guess it) it's momentum relative to other currencies, while currency strength meter measures the strength of a currency based on pips it has moved in a certain direction.
FREE
DMI Show High Low: Visualize Key Market Levels in Real Time 100% free, functional, and without limitations! The DMI Show High Low is an essential tool for traders, designed to display High, Low, and Close levels of a selected timeframe directly on your chart. Ideal for identifying key market zones, this indicator helps enhance your decision-making and trading precision. Parameters: Timeframe: Select the timeframe for displaying High, Low, and Close levels. Default: D1 (Daily) Display Close Line:
FREE

結合BinaryMiner和Root-Diamond最佳設置的全自動交易平台
內置配置。
1.從存款中自動計算深淵。
2.從多頭或空頭頭寸的結算水平只開一個頭寸
3,在逆勢趨勢下實現無損失的安全性
4個二元指標過濾市場,並確定市場走勢附近的波動。
所有合併配置均保證了長期收入
// ---------可配置參數---------- //
工作頻率M1
1.交易保證金百分比-默認設置為100%
2.自動計算交易量-默認設置為false-如果為true,則顧問將計算全部存款的交易量
3.手動計算交易量-默認設置1-1手/最小手,請諮詢數據提供商
4. LEVEL-交易水平-默認設置1-推薦從10到59
// ----------二進制指標---------- // BOOL_F&BEAR_F-默認設置0-兩種力的推薦設置0-可以採用-20至+20的值
該指示器可預測下一個波動。
BOOL_N&BEAR_N-默認設置0-兩種力的推薦設置5-可以取0到30之間的值
該指示器指示反作用力的強度。
BOOL_C&BEAR_C-默認設置0-兩種力的推薦設置1.5
FREE

MQLTA Support Resistance Lines is an indicator that calculates the historical levels of Support and Resistance and display them as Lines on chart. It will also Alert you if the price is in a Safe or Dangerous zone to trade and show you the distance to the next level. The indicator is ideal to be used in other Expert Advisor through the iCustom function. This DEMO only works with AUDNZD, the full product can be found at https://www.mql5.com/en/market/product/26328
How does it work? The indicator
FREE

Average Price Plus is an essential indicator for day-to-day operations. With it, you can graphically check the average price between several open orders on your chart. The average price is the breakeven point between your orders. In addition to the average price, the indicator also shows you the number of pips and the financial value resulting from your open orders, the percentage gains, the number of lots in operation and the number of open orders. Negative values in "pips" or in financial val
FREE
您知道为什么MetaTrader市场是出售交易策略和技术指标的最佳场所吗?不需要广告或软件保护,没有支付的麻烦。一切都在MetaTrader市场提供。
您错过了交易机会:
- 免费交易应用程序
- 8,000+信号可供复制
- 探索金融市场的经济新闻
注册
登录