类别中的新订单:
50 - 100 USD
30 - 50 USD
30 - 50 USD
30 - 50 USD
工作已完成
执行时间12 天
客户反馈
Very nice dev
员工反馈
It was good working with him, great ability for detatils
指定
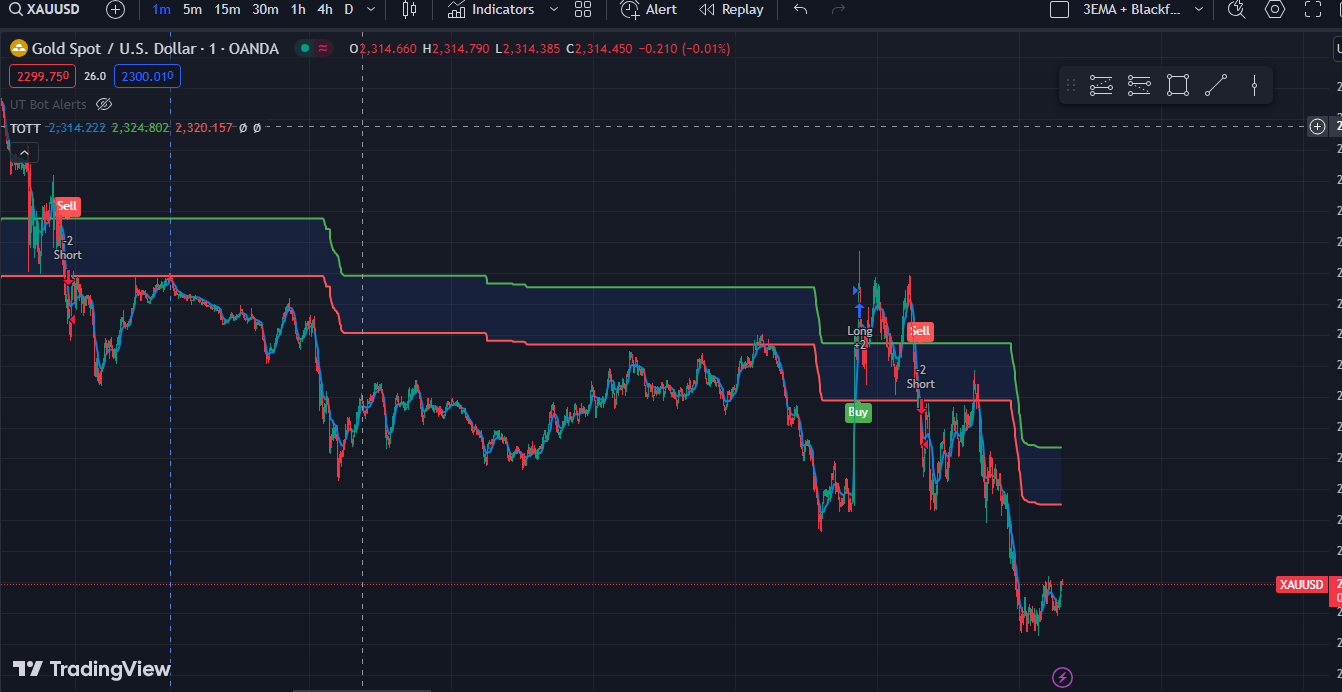
Please convert the Pine Script below into MQL4 Indicator:
//@version=5
// This source code is subject to the terms of the Mozilla Public License 2.0 at https://mozilla.org/MPL/2.0/
// © KivancOzbilgic
//created by: @Anil_Ozeksi
//developer: ANIL ÖZEKŞİ
//author: @kivancozbilgic
strategy('Twin Optimized Trend Tracker', 'TOTT', overlay=true)
src = input(close, title='Source')
length = input.int(40, 'OTT Period', minval=1)
percent = input.float(1, 'Optimization Constant', step=0.1, minval=0)
coeff = input.float(0.001, 'Twin OTT Coefficient', step=0.001, minval=0)
showsupport = input(title='Show Support Line?', defval=true)
showsignalsk = input(title='Show Signals?', defval=true)
mav = input.string(title='Moving Average Type', defval='VAR', options=['SMA', 'EMA', 'WMA', 'TMA', 'VAR', 'WWMA', 'ZLEMA', 'TSF'])
highlighting = input(title='Highlighter On/Off ?', defval=true)
Var_Func(src, length) =>
valpha = 2 / (length + 1)
vud1 = src > src[1] ? src - src[1] : 0
vdd1 = src < src[1] ? src[1] - src : 0
vUD = math.sum(vud1, 9)
vDD = math.sum(vdd1, 9)
vCMO = nz((vUD - vDD) / (vUD + vDD))
VAR = 0.0
VAR := nz(valpha * math.abs(vCMO) * src) + (1 - valpha * math.abs(vCMO)) * nz(VAR[1])
VAR
VAR = Var_Func(src, length)
Wwma_Func(src, length) =>
wwalpha = 1 / length
WWMA = 0.0
WWMA := wwalpha * src + (1 - wwalpha) * nz(WWMA[1])
WWMA
WWMA = Wwma_Func(src, length)
Zlema_Func(src, length) =>
zxLag = length / 2 == math.round(length / 2) ? length / 2 : (length - 1) / 2
zxEMAData = src + src - src[zxLag]
ZLEMA = ta.ema(zxEMAData, length)
ZLEMA
ZLEMA = Zlema_Func(src, length)
Tsf_Func(src, length) =>
lrc = ta.linreg(src, length, 0)
lrc1 = ta.linreg(src, length, 1)
lrs = lrc - lrc1
TSF = ta.linreg(src, length, 0) + lrs
TSF
TSF = Tsf_Func(src, length)
getMA(src, length) =>
ma = 0.0
if mav == 'SMA'
ma := ta.sma(src, length)
ma
if mav == 'EMA'
ma := ta.ema(src, length)
ma
if mav == 'WMA'
ma := ta.wma(src, length)
ma
if mav == 'TMA'
ma := ta.sma(ta.sma(src, math.ceil(length / 2)), math.floor(length / 2) + 1)
ma
if mav == 'VAR'
ma := VAR
ma
if mav == 'WWMA'
ma := WWMA
ma
if mav == 'ZLEMA'
ma := ZLEMA
ma
if mav == 'TSF'
ma := TSF
ma
ma
MAvg = getMA(src, length)
fark = MAvg * percent * 0.01
longStop = MAvg - fark
longStopPrev = nz(longStop[1], longStop)
longStop := MAvg > longStopPrev ? math.max(longStop, longStopPrev) : longStop
shortStop = MAvg + fark
shortStopPrev = nz(shortStop[1], shortStop)
shortStop := MAvg < shortStopPrev ? math.min(shortStop, shortStopPrev) : shortStop
dir = 1
dir := nz(dir[1], dir)
dir := dir == -1 and MAvg > shortStopPrev ? 1 : dir == 1 and MAvg < longStopPrev ? -1 : dir
MT = dir == 1 ? longStop : shortStop
OTT = MAvg > MT ? MT * (200 + percent) / 200 : MT * (200 - percent) / 200
OTTup = OTT * (1 + coeff)
OTTdn = OTT * (1 - coeff)
PPLOT = plot(showsupport ? MAvg : na, color=color.new(#0585E1, 0), linewidth=2, title='Support Line')
pALLup = plot(nz(OTTup[2]), color=color.new(color.green, 0), linewidth=2, title='OTTup')
pALLdn = plot(nz(OTTdn[2]), color=color.new(color.red, 0), linewidth=2, title='OTTdown')
buySignalk = ta.crossover(MAvg, OTTup[2])
sellSignalk = ta.crossunder(MAvg, OTTdn[2])
K1 = ta.barssince(buySignalk)
K2 = ta.barssince(sellSignalk)
O1 = ta.barssince(buySignalk[1])
O2 = ta.barssince(sellSignalk[1])
plotshape(buySignalk and showsignalsk and O1 > K2 ? math.min(low, OTTdn) : na, title='Buy', text='Buy', location=location.absolute, style=shape.labelup, size=size.tiny, color=color.new(color.green, 0), textcolor=color.new(color.white, 0))
plotshape(sellSignalk and showsignalsk and O2 > K1 ? math.max(high, OTTup) : na, title='Sell', text='Sell', location=location.absolute, style=shape.labeldown, size=size.tiny, color=color.new(color.red, 0), textcolor=color.new(color.white, 0))
mPlot = plot(ohlc4, title='', style=plot.style_circles, linewidth=0, display=display.none)
longFillColor = highlighting ? O2 > K1 ? color.green : na : na
shortFillColor = highlighting ? O1 > K2 ? color.red : na : na
fill(mPlot, PPLOT, title='UpTrend Highligter', color=longFillColor, transp=90)
fill(mPlot, PPLOT, title='DownTrend Highligter', color=shortFillColor, transp=90)
fill(pALLup, pALLdn, title='Flat Zone Highligter', color=color.new(color.blue, 90))
dummy0 = input(true, title='=Backtest Inputs=')
FromDay = input.int(defval=1, title='From Day', minval=1, maxval=31)
FromMonth = input.int(defval=1, title='From Month', minval=1, maxval=12)
FromYear = input.int(defval=2005, title='From Year', minval=2005)
ToDay = input.int(defval=1, title='To Day', minval=1, maxval=31)
ToMonth = input.int(defval=1, title='To Month', minval=1, maxval=12)
ToYear = input.int(defval=9999, title='To Year', minval=2006)
Start = timestamp(FromYear, FromMonth, FromDay, 00, 00)
Finish = timestamp(ToYear, ToMonth, ToDay, 23, 59)
Timerange() =>
time >= Start and time <= Finish ? true : false
if buySignalk
strategy.entry('Long', strategy.long, when=Timerange())
if sellSignalk
strategy.entry('Short', strategy.short, when=Timerange())
反馈
1
等级
项目
5
0%
仲裁
2
0%
/
100%
逾期
0
工作中
2
等级
项目
1
0%
仲裁
0
逾期
0
空闲
3
等级
项目
2
0%
仲裁
2
0%
/
0%
逾期
0
工作中
4
等级
项目
932
47%
仲裁
301
59%
/
25%
逾期
124
13%
工作中
5
等级
项目
0
0%
仲裁
0
逾期
0
空闲
6
等级
项目
431
64%
仲裁
5
40%
/
0%
逾期
4
1%
已载入
7
等级
项目
825
73%
仲裁
15
53%
/
13%
逾期
193
23%
工作中
相似订单
The wiper
35 - 48 USD
a ll traders want to find market behavior patterns, which could help identify favorable moments for performing trading operations. They also want to eliminate randomness and influence of external factors, such as rumors, news releases, fatigue, and so on. Traders monitor charts and may formulate some formal rules, which enable objective analysis of price or tick charts. Technical indicators can facilitate such
Create an EA VWAP + RSI for MT5
50 - 100 USD
I need EA that works on MT5 to be able to do the following: - Can recognize Support/Resistance area - Can recognize VWAP direction. - Can recognize RSI. - Can recognize Double Top/bottom, Bullish/Bearish hammer candle, Bullish/bearish engulfing candle. - Ability to set Stoploss below/above support/resistance, but risk must be fixed at a certain price. - Stoploss
Boulē’s Full Margin Trader
30 - 50 USD
I want a program that will help calculate and enter the market on full margin for me. I just need to put in the price for entry, Stop loss and TP then it will calculate the lot sizes for entering the trade on full margin on Mt5
I am seeking a highly skilled and experienced developer to assist with an important project. I need a development of an automated trading bot for NinjaTrader, utilizing a 4 SMA (Simple Moving Average) crossing strategy, with additional custom diversions for trade entries. The bot needs to be based on a strategy involving the crossing of four different SMAs. The exact periods for these SMAs and the conditions for
Copier EA triggered via Mobile
30 - 100 USD
So i have copier EA. The idea is the EA will triggered through manual OP by user via mobile or whatever platform. Let's say 0.01 lot to trigger it. After the EA takes master's position, the EA will be standby mode. If the master take more OP, the EA still not take the master's position (OP) until the user input manually once again via mobile for another 0.01 lot. Since this is a MT4 EA, Whenever user want to close
Criação de robo com base em 2 medias móveis
30 - 50 USD
preciso de um robô com duas médias móveis, uma exponencial high e uma exponencial low. preciso também ter a opção de utilizar e todos os tempos gráficos e alterar os parâmetros das médias. entrada de compra será feita quando um candle de alta romper e fechar a cima da média high e fechará a posição quando um candle de baixa romper e fechar a baixo da média low. a venda será feita quando o candle de baixa romper e
I need a chart to replicate/track my equity + Balance Curve into my mt4. Also this chart i need to be able to add Stochastic / Bollingerband / Moving average on the equity/balance curve. Besides the equity curve i would like the indicator to show the Line-chart of my win + 1 and my loss -1 which results in a win-loss curve. ( i will discuss this with the choosen developer in depth. ) More information on what i want
Greetings great developer, I am in search of a highly skilled developer to assist with an exciting project. I need to convert two open-source TradingView indicators to NinjaTrader 8 and implement a usage restriction based on computer IDs. If you have experience with NinjaTrader 8 coding please let me know. I’d be happy to discuss the details further
Greetings great developer, I am in search of a highly skilled MQL5 developer to assist with an exciting project. I need to convert two open-source TradingView indicators to NinjaTrader 8 and implement a usage restriction based on computer IDs. If you have experience with NinjaTrader 8 coding please let me know. I’d be happy to discuss the details further
Trading bot
300+ USD
We need bot that trades when medium and low impact news hits It will release pending order both directions few min prior to news impact And will have certain risk management strategy attached Example If Monday and Tuesday news successful clears profits It will reduce risk for next news events until new week starts each week message on tg: Dstatewealthtrading NOTE: 4 YAERS OF EXPERIENCE UPWORD, YOU MUST BE A
项目信息
预算
30+ USD
开发人员
27
USD
截止日期
从 1 到 10 天