Bir ticaret robotunun nasıl sipariş edileceğini izleyin
Bir sipariş vermeden veya bir siparişe başvurmadan önce kuralları okuyun
MQL5 ve MQL4'teki bir ticaret robotu nasıl sipariş edilir?
Bir robot sipariş etmek için örnek İş Gerekliliklerine bakın
Kategorideki yeni siparişler:
70 - 100 USD
100 - 300 USD
40 - 100 USD
30 - 31 USD
İş tamamlandı
Tamamlanma süresi: 12 gün
Müşteri tarafından geri bildirim
Very nice dev
Geliştirici tarafından geri bildirim
It was good working with him, great ability for detatils
İş Gereklilikleri
Please convert the Pine Script below into MQL4 Indicator:
//@version=5
// This source code is subject to the terms of the Mozilla Public License 2.0 at https://mozilla.org/MPL/2.0/
// © KivancOzbilgic
//created by: @Anil_Ozeksi
//developer: ANIL ÖZEKŞİ
//author: @kivancozbilgic
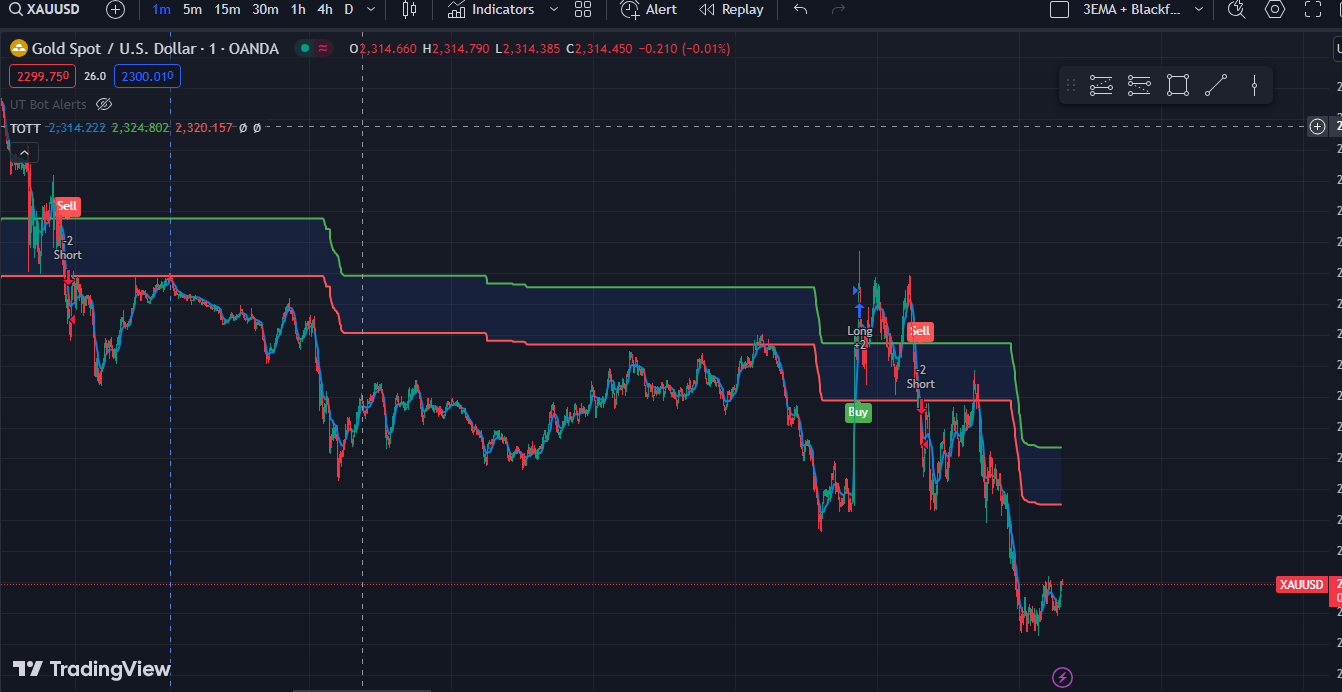
strategy('Twin Optimized Trend Tracker', 'TOTT', overlay=true)
src = input(close, title='Source')
length = input.int(40, 'OTT Period', minval=1)
percent = input.float(1, 'Optimization Constant', step=0.1, minval=0)
coeff = input.float(0.001, 'Twin OTT Coefficient', step=0.001, minval=0)
showsupport = input(title='Show Support Line?', defval=true)
showsignalsk = input(title='Show Signals?', defval=true)
mav = input.string(title='Moving Average Type', defval='VAR', options=['SMA', 'EMA', 'WMA', 'TMA', 'VAR', 'WWMA', 'ZLEMA', 'TSF'])
highlighting = input(title='Highlighter On/Off ?', defval=true)
Var_Func(src, length) =>
valpha = 2 / (length + 1)
vud1 = src > src[1] ? src - src[1] : 0
vdd1 = src < src[1] ? src[1] - src : 0
vUD = math.sum(vud1, 9)
vDD = math.sum(vdd1, 9)
vCMO = nz((vUD - vDD) / (vUD + vDD))
VAR = 0.0
VAR := nz(valpha * math.abs(vCMO) * src) + (1 - valpha * math.abs(vCMO)) * nz(VAR[1])
VAR
VAR = Var_Func(src, length)
Wwma_Func(src, length) =>
wwalpha = 1 / length
WWMA = 0.0
WWMA := wwalpha * src + (1 - wwalpha) * nz(WWMA[1])
WWMA
WWMA = Wwma_Func(src, length)
Zlema_Func(src, length) =>
zxLag = length / 2 == math.round(length / 2) ? length / 2 : (length - 1) / 2
zxEMAData = src + src - src[zxLag]
ZLEMA = ta.ema(zxEMAData, length)
ZLEMA
ZLEMA = Zlema_Func(src, length)
Tsf_Func(src, length) =>
lrc = ta.linreg(src, length, 0)
lrc1 = ta.linreg(src, length, 1)
lrs = lrc - lrc1
TSF = ta.linreg(src, length, 0) + lrs
TSF
TSF = Tsf_Func(src, length)
getMA(src, length) =>
ma = 0.0
if mav == 'SMA'
ma := ta.sma(src, length)
ma
if mav == 'EMA'
ma := ta.ema(src, length)
ma
if mav == 'WMA'
ma := ta.wma(src, length)
ma
if mav == 'TMA'
ma := ta.sma(ta.sma(src, math.ceil(length / 2)), math.floor(length / 2) + 1)
ma
if mav == 'VAR'
ma := VAR
ma
if mav == 'WWMA'
ma := WWMA
ma
if mav == 'ZLEMA'
ma := ZLEMA
ma
if mav == 'TSF'
ma := TSF
ma
ma
MAvg = getMA(src, length)
fark = MAvg * percent * 0.01
longStop = MAvg - fark
longStopPrev = nz(longStop[1], longStop)
longStop := MAvg > longStopPrev ? math.max(longStop, longStopPrev) : longStop
shortStop = MAvg + fark
shortStopPrev = nz(shortStop[1], shortStop)
shortStop := MAvg < shortStopPrev ? math.min(shortStop, shortStopPrev) : shortStop
dir = 1
dir := nz(dir[1], dir)
dir := dir == -1 and MAvg > shortStopPrev ? 1 : dir == 1 and MAvg < longStopPrev ? -1 : dir
MT = dir == 1 ? longStop : shortStop
OTT = MAvg > MT ? MT * (200 + percent) / 200 : MT * (200 - percent) / 200
OTTup = OTT * (1 + coeff)
OTTdn = OTT * (1 - coeff)
PPLOT = plot(showsupport ? MAvg : na, color=color.new(#0585E1, 0), linewidth=2, title='Support Line')
pALLup = plot(nz(OTTup[2]), color=color.new(color.green, 0), linewidth=2, title='OTTup')
pALLdn = plot(nz(OTTdn[2]), color=color.new(color.red, 0), linewidth=2, title='OTTdown')
buySignalk = ta.crossover(MAvg, OTTup[2])
sellSignalk = ta.crossunder(MAvg, OTTdn[2])
K1 = ta.barssince(buySignalk)
K2 = ta.barssince(sellSignalk)
O1 = ta.barssince(buySignalk[1])
O2 = ta.barssince(sellSignalk[1])
plotshape(buySignalk and showsignalsk and O1 > K2 ? math.min(low, OTTdn) : na, title='Buy', text='Buy', location=location.absolute, style=shape.labelup, size=size.tiny, color=color.new(color.green, 0), textcolor=color.new(color.white, 0))
plotshape(sellSignalk and showsignalsk and O2 > K1 ? math.max(high, OTTup) : na, title='Sell', text='Sell', location=location.absolute, style=shape.labeldown, size=size.tiny, color=color.new(color.red, 0), textcolor=color.new(color.white, 0))
mPlot = plot(ohlc4, title='', style=plot.style_circles, linewidth=0, display=display.none)
longFillColor = highlighting ? O2 > K1 ? color.green : na : na
shortFillColor = highlighting ? O1 > K2 ? color.red : na : na
fill(mPlot, PPLOT, title='UpTrend Highligter', color=longFillColor, transp=90)
fill(mPlot, PPLOT, title='DownTrend Highligter', color=shortFillColor, transp=90)
fill(pALLup, pALLdn, title='Flat Zone Highligter', color=color.new(color.blue, 90))
dummy0 = input(true, title='=Backtest Inputs=')
FromDay = input.int(defval=1, title='From Day', minval=1, maxval=31)
FromMonth = input.int(defval=1, title='From Month', minval=1, maxval=12)
FromYear = input.int(defval=2005, title='From Year', minval=2005)
ToDay = input.int(defval=1, title='To Day', minval=1, maxval=31)
ToMonth = input.int(defval=1, title='To Month', minval=1, maxval=12)
ToYear = input.int(defval=9999, title='To Year', minval=2006)
Start = timestamp(FromYear, FromMonth, FromDay, 00, 00)
Finish = timestamp(ToYear, ToMonth, ToDay, 23, 59)
Timerange() =>
time >= Start and time <= Finish ? true : false
if buySignalk
strategy.entry('Long', strategy.long, when=Timerange())
if sellSignalk
strategy.entry('Short', strategy.short, when=Timerange())
Yanıtlandı
1
Derecelendirme
Projeler
8
13%
Arabuluculuk
2
0%
/
100%
Süresi dolmuş
1
13%
Çalışıyor
2
Derecelendirme
Projeler
1
0%
Arabuluculuk
0
Süresi dolmuş
0
Serbest
3
Derecelendirme
Projeler
2
0%
Arabuluculuk
2
0%
/
0%
Süresi dolmuş
0
Çalışıyor
4
Derecelendirme
Projeler
932
47%
Arabuluculuk
302
59%
/
25%
Süresi dolmuş
124
13%
Yüklendi
5
Derecelendirme
Projeler
0
0%
Arabuluculuk
0
Süresi dolmuş
0
Serbest
6
Derecelendirme
Projeler
442
64%
Arabuluculuk
5
40%
/
0%
Süresi dolmuş
4
1%
Çalışıyor
7
Derecelendirme
Projeler
826
73%
Arabuluculuk
15
53%
/
13%
Süresi dolmuş
193
23%
Çalışıyor
Benzer siparişler
Hi I have the code in pinescript for an indicator that I need done in Ninja Trader, I wanted this indicator in NT bcs I chart in NT, and if the indicator could also have been an automated strategy even better. Please confirm that it will be an indicator and Automated Trading Strategy
Hello potential Freelancers I’m very new to trading so please bear with me as I try to explain what ‘m looking for. I'm currently getting signals ( XAUUSD )sent to me and I’m looking to find a person who can look at the data either watch account live, or I send the trade history. The bot my provider is using makes 100’s of trades a day and does very well on average. I’m also looking to have the following features
function (A) Add Transform combine the 4 Expert Advisors into just 1 Expert Advisor, maintaining the individuality of each one Leave in extern (false) or (true) :::::::::::::::::::::::::::::::::::::::::::::::::::::::::::::::::::::::::::::::::::::::::::::::::::::::::::::::::::::::::::::::::::::::::::::::: function (B) Add the function (false) or (true) INTO THE EXISTING FUNCTION: TradeSize = 0.01; (true) Function (C)
Trend Following with ML
50 - 200 USD
Hi guys I would like to k ow if someone has experience with machine learning models? I would like to train a model to identify if there is a range market or trendy market based on several parameters like EMA and ATR for example. If we use for example a 20 and 50 EMA and we measure the distance between both lines the algo should oearn if the trend is strong or weak. If it‘s steong it keeps trending and if it‘s weak
Hello The EA will work on particular zone choose by the user and can mark it on any TF and with some rules can open trades and mange the trade by some unique rules. the EA need to check the difference by RSI as well and with some extra rules . developer should have good attitude and good communication (englsih) with high performence and knowledge with coding EA
Hello I need a very simple indicator This indicator should show the highest floating or history drawdown of the account It means that it can display the highest number that the account drawdown to be displayed on the chart in this format max drawdown account(xxxx$$) ...date(00/00/00)time:(00:00) max drawdown currency ..( currency name with max drwadown) . (xxxx$$) date(00/00/00)time:(00:00) thanks
Hello The EA will work on particular zone choose by the user and can mark it on any TF and with some rules can open trades and mange the trade by some unique rules. the EA need to check the difference by RSI as well and with some extra rules . developer should have good attitude and good communication (englsih) with high performence and knowledge with coding EA. THREE TYPES OF ENTRIES 1: AGGRESSIVE 2: DIVERGENCE 3
I want to create an EA that can take bids according to information of a logic I have developed to give indication of a BUY or SELL opportunity. The EA will then be able to activate the BUY at the lowest possible position once the indicator clears it for a BUY and take bid upwards or identify the highest point and clears it for a SELL and take bids downwards. As you can see from example of JULY 2024 data to see how
Next Candle Probability
50 - 150 USD
Hello, I‘m interested in an indicator to predict the next candles probability (bullish or bearish). But honestly I have no idea how to do this. Would be interested in your opinion how we can create such an indicator. Please let me know if you‘ve done similar work
Profitable EA HFT
50 - 300 USD
From a long time i am searching for a profitable EA i have lost a lot , and now i have only 300$ to buy a profitable EA , i wish to say with 0 losses but some or most traders they don't want to hear this i am really tired of searching for a programmer to just create me a profitable EA with the least losses or zero losses maybe nearly 1 year i am searching i just need an HFT EA that can work very well on MT4,MT5
Proje bilgisi
Bütçe
30+ USD
Geliştirici için
27
USD
Son teslim tarihi
from 1 to 10 gün