//+------------------------------------------------------------------+
//| NormalMembershipFunction.mq5 |
//| Copyright 2016, MetaQuotes Software Corp. |
//| https://www.mql5.com |
//+------------------------------------------------------------------+
#include <Math\Fuzzy\membershipfunction.mqh>
#include <Graphics\Graphic.mqh>
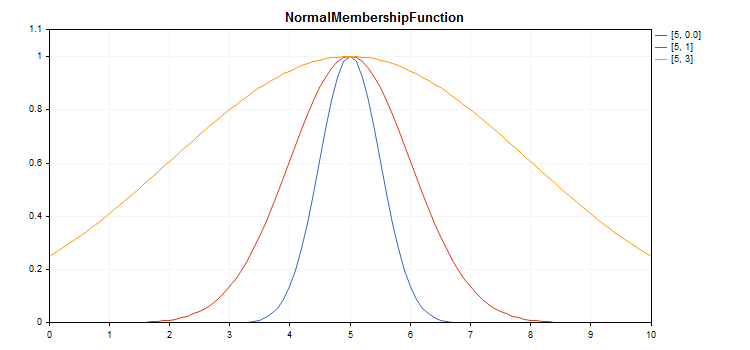
//--- 创建归属函数
CNormalMembershipFunction func1(5,0.5);
CNormalMembershipFunction func2(5,1);
CNormalMembershipFunction func3(5,3);
//--- 创建归属函数包装程序
double NormalMembershipFunction1(double x) { return(func1.GetValue(x)); }
double NormalMembershipFunction2(double x) { return(func2.GetValue(x)); }
double NormalMembershipFunction3(double x) { return(func3.GetValue(x)); }
//+------------------------------------------------------------------+
//| 脚本程序起始函数 |
//+------------------------------------------------------------------+
void OnStart()
{
//--- 创建图形
CGraphic graphic;
if(!graphic.Create(0,"NormalMembershipFunction",0,30,30,780,380))
{
graphic.Attach(0,"NormalMembershipFunction");
}
graphic.HistoryNameWidth(70);
graphic.BackgroundMain("NormalMembershipFunction");
graphic.BackgroundMainSize(16);
//--- 创建曲线
graphic.CurveAdd(NormalMembershipFunction1,0.0,10.0,0.1,CURVE_LINES,"[5, 0.0]");
graphic.CurveAdd(NormalMembershipFunction2,0.0,10.0,0.1,CURVE_LINES,"[5, 1]");
graphic.CurveAdd(NormalMembershipFunction3,0.0,10.0,0.1,CURVE_LINES,"[5, 3]");
//--- 设置X轴属性
graphic.XAxis().AutoScale(false);
graphic.XAxis().Min(0.0);
graphic.XAxis().Max(10.0);
graphic.XAxis().DefaultStep(1.0);
//--- 设置Y轴属性
graphic.YAxis().AutoScale(false);
graphic.YAxis().Min(0.0);
graphic.YAxis().Max(1.1);
graphic.YAxis().DefaultStep(0.2);
//--- 绘图
graphic.CurvePlotAll();
graphic.Update();
}
|