
在 MQL 应用程序中运用 CCanvas 类
本文深入研究了 CCanvas 类及其在 MQL 应用程序中的运用。 该理论附有示例。
应用程序中的图形
在应用程序中处理图形需要访问屏幕上的像素数据。 如果您有这样的权限,您可以改变像素颜色、创建各种用户界面元素、输入字段、按钮、面板、窗口和其它元素、或者从文件中显示图像、以及获取和处理像素数据。 通常,这种机制是在名称中含有 “Canvas” 一词的类中布局的。 在基于 C 的编程语言中,这通常是 CCanvas 或 Canvas,具体取决于代码编写风格。 因此,每个应用程序都需要一块画布才能访问图形。
MQL 应用程序中的画布
在 MQL 中,该工具以 CCanvas 类的形式提供,包含像素数组、修改像素数组的方法、以及将数组发送到终端图表的机制。 OBJ_BITMAP 或 OBJ_BITMAP_LABEL 图形对象用作显示手段。 所应用的图形对象从图形资源获取数据,而图形资源又从像素数组接收数据。
CCanvas 类允许实现所有桌面 UI 功能。 除了用户界面,CCanvas 还支持绘图指标缓冲区、OHLC 柱线、以及更多。 其可能性是无穷无尽的... 我将在我的其它文章中讨论这个话题。 现在是时候回到 CCanvas 类了。
探究 CCanvas
现在是时候进行最有趣的部分了 — 深入研究 CCanvas 类。 了解其结构可以令您精通这个工具。 CCANVA 的结构提供如下。

正如我们所见,这个类被切分成两个大的部分 — 数据和方法。
我们先来研究数据:
- 像素数据。 存储像素的 m_pixels 像素数组,经由绘图方法进行处理,以及 m_width 和 m_height 数据 – 分别对应图像宽度和高度。 m_width 和 m_height 参数对于经由绘图方法处理 m_pixels 数组,以及在更新方法中将 m_pixels 数组传递给图形资源非常重要。
- 字体(Font)数据用于显示文本。 由 m_fontname、m_fontsize、m_fontflags 和 m_fontangle 字段组成的是 – 分别为字体名称、字号、属性和文本倾斜角度。 在调用 TextOut 方法之前,需设置和接收字体属性(使用读取/写入字体属性的方法)这些是方法必须的数据。
- 线条绘图数据。 由两个字段组成:m_style —线条样式和 m_style_idx — 线条样式模板中的当前比特位索引。 它们是绘图方法所必需的。
- 默认数据。 此处我们有一个单一字段 m_default_colors — 默认颜色数组。 它不会在 CCanvas 类方法中使用,但作为调色板,它可能会由 CCanvas 子类的其它函数或方法调用。
- 图表交互数据。 包含以下内容:m_chart_id,m_objname,m_objtype,m_rcname,和 m_format — 分别为图表对象 id、图表对象名、图表对象类型、图形资源名和像素格式。 数据用于以下方法:Destroy、Update、Resize。 尤其是,TextOut 方法操作需要 m_format 字段。
我们来研究这些方法:
- Creation/attachment/removal 方法。 该类别拥有操控图表对象的不同方法。 以下是创建图形对象的方法:CreateBitmap 和 CreateBitmapLabel。 它们用于创建图表对象,和与之相关的图形资源,然后在图表上显示图像。 挂载方法: Attach。 如果图表提供的 OBJ_BITMAP_LABEL 图形对象含有或不含附带的图形资源,CCanvas 处理该对象的方式与处理新创建的图形对象的方式相同。 只需调用相应的 Attach 方法将其挂载即可。 Removal 方法由 Destroy 调用。 它移除图形对象,并释放与图表对象相关的图形资源和 m_pixels 像素缓冲区数组。 因此,在 CCanvas 完成时,我们应该始终调用 Destroy 方法,因为该类不会自动删除其图表对象和图形资源。
- 从文件加载图像的方法。 LoadBitmap 静态方法,能够从 *.bmp 文件里加载一幅图像,将之保存到从参数传递来的某个地址指向的任何 uint 数组当中;同时将得到的图像尺寸保存到 “width” 和 “height” 变量中,这些变量也作为参数通过相应的地址传递给该方法。 LoadFromFile 方法从 *.bmp 文件里加载一幅图像到 m_pixels 数组,并设置 m_width 和 m_height 图像参数。 m_format 的像素格式应等于 COLOR_FORMAT_ARGB_RAW。
- 读取图表对象属性的方法包括 ChartObjectName、ResourceName、Width 和 Height,并相应地返回图表对象名、图形资源名、图像宽度和高度。 这些方法允许用户仅读取一些与图表交互的数据,包括 m_objname、m_rcname 以及m_width 和 m_height 图像数据。
- 读取/写入显示文本字体属性的方法。 首先,我们来研究 FontNameSet、FontSizeSet、FontFlagsSet 和 FontAngleSet 写入方法。 这些方法分别对应设置字体名称、字号、属性、和显示文本的倾斜角度。 现在我们来研究读取方法。: FontSizeGet、FontFlagsGet 和 FontAngleGet。 这些方法分别返回字号和属性,以及显示文本的倾斜角度。 还有一些接收/设置字体属性的方法,可以一次返回/设置所有字体属性。 设置属性的方法 FontSet 分别设置字体名称、字号、属性、和显示文本的倾斜角度。 接收属性 FontGet 的方法分别返回显示文本的字体名称、字号、属性、和倾斜角度。
- 读/写线条绘图样式的方法。 LineStyleGet 方法用于读取,而 LineStyleSet 用于写入。 线条样式对于处理 LineAA、PolylineAA、PolygonAA、TriangleAA、CircleAA、EllipseAA、LineWu、PolylineWu、PolygonWu、TriangleWu、CircleWu、EllipseWu、LineThickVertical、LineThickHorizontal、LineThick、PolylineThick 和 PolygonThick 图形图元的绘图方法是必需的。
- 依据像素数组绘制的方法。 CCanvas 类有许多使用各种算法绘制图形图元的方法,令用户能够使用渐进平滑方法创建复杂图形,包括抗锯齿、Wu 算法和 Bézier 曲线。 我们来研究一下这些方法。 不带平滑的简单图元: LineVertical, LineHorizontal, Line, Polyline, Polygon, Rectangle, Triangle, Circle, Ellipse, Arc 和 Pie。 这些方法分别绘制以下图元:垂直线、水平线、手绘线、多段线、多边形、矩形、三角形、圆、椭圆、圆弧、和填充椭圆扇形。 填充图元: FillRectangle, FillTriangle, FillPolygon, FillCircle, FillEllipse 和 Fill。 这些方法分别在区域中绘制填充的矩形、三角形、多边形、圆形、椭圆形。 通过抗锯齿平滑绘制图元的方法 (AA): PixelSetAA, LineAA, PolylineAA, PolygonAA, TriangleAA, CircleAA 和 EllipseAA。 这些方法分别填充像素和显示手绘线、多段线、多边形、三角形、圆形、和椭圆形等图元。 使用 Wu 算法绘制图元的方法: LineWu, PolylineWu, PolygonWu, TriangleWu, CircleWu 和 EllipseWu。 这些方法分别绘制手绘线、多段线、多边形、三角形、圆形、和椭圆形。 经过初步整理的抗锯齿和可调线宽的图元绘制方法: LineThickVertical, LineThickHorizontal, LineThick, PolylineThick 和 PolygonThick。 它们分别用于绘制以下图元:垂直线、水平线、徒手线、多段线、和多边形。 利用 Bézier 方法绘制平滑图元的方法: PolylineSmooth 和 PolygonSmooth。 这些方法分别绘制平滑直线和平滑多边形。 除了上述方法外,该类别还包括用于显示文本的 TextOut 方法,因为它还改变像素数组中的颜色值,尽管它落于初始 CCanvas 类代码中的文本处理方法组。
- 传递图像以便在图表上显示的方法。 该类别包括两种方法。 Update 方法通过 m_pixels 数组,把图形资源传递给欲在图表上显示的相关图像对象。 正如我曾提过的,在上述绘制方法的帮助下改变 m_pixels 像素数组中的数据。 Resize 方法更改 m_pixels 数组大小(图像尺寸),并将其传递给图形资源。
- 服务。 CCanvas 提供两种服务方法:GetDefaultColor 返回重定义的颜色,而 TransparentLevelSet 通过更改 m_pixels 数组中的 alpha 通道值,来更改图像透明度。
- 其它设置。 此处我们有一个用于设置抗锯齿过滤器的 FilterFunction 方法,它为名称中包含 AA 符号的所有绘图方法设置过滤器。
CCanvas 类 在私密区域中有字段和方法。 我不打算在文章中讲述它们,因为它们是内部方法,不可由 CCAVAS 衍生后代类重新定义。 您可以在 MetaEditor 中的 Canvas.mqh 模块源代码里找到它们。
在 MQL 应用程序中运用 CCanvas 时的应用操作顺序
上述所有讲解的内容,当任何 MQL 应用程序中运用 CCanvas 类时,均可强化一般的动作序列进行处理。 我们来研究将要执行的操作,从而令图像出现在图表上。
- 创建或附加图表对象(OBJ_BITMAP 或 OBJ_BITMAP_LABEL),或附加到现有的 OBJ_BITMAP_LABEL
- 设置字体参数和图元绘制样式
- 使用相应的方法在 m_pixels 数组中执行绘制
- 更新图形对象资源(OBJ_BITMAP 或 OBJ_BITMAP_LABEL)
结果则是,图表将有一个带有图形结构或文本的对象。 我们研究一下动作的细节。
创建图表对象,并附加到现有图表对象
为了令 MQL 应用程序在图表上显示图形,我们需要基于 CCanvas 类或其衍生后代创建一个对象。 创建一个 CCanvas 对象后,我们可以启动开发 OBJ_BITMAP 或 OBJ_BITMAP_LABEL 图表对象。 不然的话,我们也可以将已经存在的 OBJ_BITMAP_LABEL附加到已创建的 CCanvas 对象。
为了创建图形对象,CCanvas 有 CreateBitmap 和 CreateBitmapLabel 方法。 它们各自应用自己的重载选项,从而能更便捷地使用。
bool  CreateBitmap(const long chart_id, const int subwin, const string name, const datetime time, const double price, const int width, const int height, ENUM_COLOR_FORMAT clrfmt=COLOR_FORMAT_XRGB_NOALPHA);

bool  CreateBitmap(const string name, const datetime time, const double price, const int width, const int height,ENUM_COLOR_FORMAT clrfmt=COLOR_FORMAT_XRGB_NOALPHA);

bool  CreateBitmapLabel(const long chart_id, const int subwin, const string name, const int x, const int y, const int width, const int height, ENUM_COLOR_FORMAT clrfmt=COLOR_FORMAT_XRGB_NOALPHA);

bool  CreateBitmapLabel(const string name,const int x,const int y, const int width,const int height,ENUM_COLOR_FORMAT clrfmt=COLOR_FORMAT_XRGB_NOALPHA);
CreateBitmap 方法创建位图(OBJ_BITMAP 对象类型),其坐标在交易品种图表上设置为时间和价格,并包含以下参数:
- chart_id – 图表 ID (0 – 当前)
- window – 图标子窗口索引 (0 – 主窗口)
- name – 图表上创建的图形对象的名称
- time – 图表上图形对象的时间坐标
- price – 图表上图形对象的价格坐标
- width – 图表上的图形对象宽度
- height – 图表上的图形对象高度
另一个 CreateBitmap 方法选项是重载方法,它调用 CreateBitmap,且令 chart_id 和 window 参数等于 0(对应于当前图表和主窗口)。
//+------------------------------------------------------------------+
//| Create object on chart with attached dynamic resource            |
//+------------------------------------------------------------------+
bool CCanvas::CreateBitmap(const string name,const datetime time,const double price,
                           const int width,const int height,ENUM_COLOR_FORMAT clrfmt)
  {
   return(CreateBitmap(0,0,name,time,price,width,height,clrfmt));
  }
CreateBitmapLabel 方法的参数与 CreateBitmap 相同,不包括“时间”和“价格”。 我们可以看到是以 x 和 y 替代了它们。
输入:
- chart_id – 图表 ID (0 – 当前)
- window – 图标子窗口索引 (0 – 主窗口)
- name – 图表上创建的图形对象的名称
- x – 图表上图形对象的 X 坐标
- y – 图表上图形对象的 Y 坐标
- width – 创建的图形对象图像的宽度
- height – 创建的图形对象图像的高度
- clrfmt – 创建的图形对象图像的像素颜色格式
另一个 CreateBitmapLabel 方法选项是重载方法,它调用 CreateBitmapLabel,且令 chart_id 和 window 参数等于 0 (与 CreateBitmap 相同)。
//+------------------------------------------------------------------+
//| Create object on chart with attached dynamic resource            |
//+------------------------------------------------------------------+
bool CCanvas::CreateBitmapLabel(const string name,const int x,const int y,
                                const int width,const int height,ENUM_COLOR_FORMAT clrfmt)
  {
   return(CreateBitmapLabel(0,0,name,x,y,width,height,clrfmt));
  }
如果图表含有 OBJ_BITMAP_LABEL 对象,则可以调用 Attach 方法将其附加到 CCanvas 之上。 结果就是,图表对象与 CCanvas 对象的交互方式,与使用 CreateBitmap 或 CreateBitmapLabel 方法创建的图表对象的交互方式相同。
virtual bool  Attach(const long chart_id,const string objname,const int width,const int height,ENUM_COLOR_FORMAT clrfmt=COLOR_FORMAT_XRGB_NOALPHA);

virtual bool  Attach(const long chart_id,const string objname,ENUM_COLOR_FORMAT clrfmt=COLOR_FORMAT_XRGB_NOALPHA);
该方法将 CCanvas 附加到已存在的 OBJ_BITMAP_LABEL 图表对象。
输入:
- chart_id – 图表 ID (0 – 当前)
- objname – 附加图形对象的名称
- width – 附加图形对象图像的宽度
- height – 附加图形对象图像的高度
- clrfmt – 附加图形对象图像的像素颜色格式
Attach 方法的第一个选项意味着图表对象没有图形资源,并使用 objname、width、height 和 clrfmt 参数自行创建它,以及进一步处理附加填充图形对象所需的所有数据。
第二个选项意味着图形资源的存在,只需将图像像素数据读取到 m_pixels 数组当中,同时进一步处理附加填充图形对象所需的所有数据。
设置和接收字体参数的方法,以及设置和接收线条绘制样式的方法
使用 CreateBitmap 或 CreateBitmapLabel 方法创建图形对象后,或者使用 Attach 方法附加图形对象后,我们应该设置字体参数和图元绘制样式,从而得到所要的图像。 字体参数使用以下方法设置。
设置字体属性的简单方法:
bool FontNameSet(string name);  // Set the font name

bool FontSizeSet(int size);     // Set the font size

bool FontFlagsSet(uint flags);  // Set the font attributes

bool FontAngleSet(uint angle);  // Set the font slope angle
读取字体属性的简单方法:
string FontNameGet(void) const;   // Return the font name

int    FontSizeGet(void) const;   // Return the font size

uint   FontFlagsGet(void) const;  // Return the font attributes

uint   FontAngleGet(void) const;  // Return the font slope angle
设置所有字体属性的方法:
bool FontSet(const string name,const int size,const uint flags=0,const uint angle=0); // Set the font properties
输入:
- name - font name
- size - font size
- flags - font attributes
- angle - font slope angle
如我们从清单里所见,该方法根据 name、size、flags 和 angle 作为参数传递的变量值设置字体属性。
接收所有字体属性的方法
void FontGet(string &name,int &size,uint &flags,uint &angle); // Get font properties
输入:
- name - 字体名称
- size - 字号
- flags - 字体属性
- angle - 字体倾角
如我们从清单里所见,该方法将字体名称、大小、属性和文本倾斜角度写入相应的:name、size、flags 和 angle 变量,它们都是作为参数引用传递给方法的。
读取和写入图形构造线条样式的方法:
uint LineStyleGet(void) const;       // Return the specified line drawing style

void LineStyleSet(const uint style); // Set the line drawing style
输入:
- style - 线条绘制样式
绘制和显示文本的方法
我们从文本显示方法开始,因为它只是该类方法中的一种,而在 CCanvas 中,图形图元绘制方法有很多。
文本显示
void TextOut(int x,int y,string text,const uint clr,uint alignment=0); // Display text to the m_pixels array
输入:
- x - 显示文本的 X 坐标
- y - 显示文本的 Y 坐标
- text - 显示文本
- clr - 显示文本的颜色
- alignment - 显示文本的锚定方法
根据清单,该方法以指定的 clr 颜色,和 alignment 方式在 x 和 y 坐标处显示 text。
改变像素
在 CCanvas中,可以根据指定的坐标更改位于 m_pixels 数组中的像素或接收其值。
uint PixelGet(const int x,const int y) const;          // Return the pixel color value according to x and y coordinates

void PixelSet(const int x,const int y,const uint clr); // Change the pixel color value according to x and y coordinates
输入:
- x - 像素 X 坐标
- y - 像素 Y 坐标
- clr - 像素颜色
绘制图形图元
由于 CCANVAS 提供了众多图元的绘制方法,所以本文只讲述最重要的一些。 您可以在文档中找到所有其它方法。
垂直线
void LineVertical(int x,int y1,int y2,const uint clr); // Draw a vertical line according to specified coordinates and color
输入:
- x - 线的 X 坐标
- y1 - 第一个点的 Y 坐标
- y2 - 第二个点的 Y 坐标
- clr - 线的颜色
水平线
void LineHorizontal(int x1,int x2,int y,const uint clr); // Draw a horizontal line according to specified coordinates and color
输入:
- x1 - 第一个点的 X 坐标
- x2 - 第二个点的 X 坐标
- y - 线的 Y 坐标
- clr - 线的颜色
手绘线
void Line(int x1,int y1,int x2,int y2,const uint clr); // Draw a freehand line according to specified coordinates and color
输入:
- x1 - 第一个点的 X 坐标
- y1 - 第一个点的 Y 坐标
- x2 - 第二个点的 X 坐标
- y2 - 第二个点的 Y 坐标
- clr - 线的颜色
多段线
void Polyline(int &x[],int &y[],const uint clr); // Draw a polyline according to specified coordinates and color
输入:
- x - 各点的 X 坐标数组
- y - 各点的 Y 坐标数组
- clr - 线的颜色
多边形
void Polygon(int &x[],int &y[],const uint clr); // Draw a polygon according to specified coordinates and color
输入:
- x - 各点的 X 坐标数组
- y - 各点的 Y 坐标数组
- clr - 多边形颜色
矩形
void Rectangle(int x1,int y1,int x2,int y2,const uint clr); // Draw a rectangle according to specified coordinates and color
输入:
- x1 - 第一点 X 坐标
- y1 - 第一点 Y 坐标
- x2 - 第二点 X 坐标
- y2 - 第二点 Y 坐标
- clr - 矩形颜色
三角形
void Triangle(int x1,int y1,int x2,int y2,int x3,int y3,const uint clr); // Draw a triangle according to specified coordinates and color
输入:
- x1 - 第一点 X 坐标
- y1 - 第一点 Y 坐标
- x2 - 第二点 X 坐标
- y2 - 第二点 Y 坐标
- x3 - 第三点 X 坐标
- y3 - 第三 点 Y 坐标
- clr - 三角形颜色
圆形
void Circle(int x,int y,int r,const uint clr); // Draw a circle according to specified coordinates, radius and color
输入:
- x - X 坐标
- y - Y 坐标
- r - 圆半径
- clr - 圆颜色
椭圆形
void Ellipse(int x1,int y1,int x2,int y2,const uint clr); // Draw an ellipse according to specified coordinates and color
输入:
- x1 - 第一点 X 坐标
- y1 - 第一点 Y 坐标
- x2 - 第二点 X 坐标
- y2 - 第二点 Y 坐标
- clr - 三角形颜色
此处研究的方法显示简单的图元,线宽为 1 像素,普通样式为实线(STYLE_SOLID)样式。 如果您对简单的图形很在行,您就可以用它们了。
但如果您需要一些不同于 STYLE_SOLID 的东西,请选择下面描述的方法之一。
//--- Methods for drawing primitives with smoothing using antialiasing

void PixelSetAA(const double x,const double y,const uint clr);

void LineAA(const int x1,const int y1,const int x2,const int y2,const uint clr,const uint style=UINT_MAX);

void PolylineAA(int &x[],int &y[],const uint clr,const uint style=UINT_MAX);

void PolygonAA(int &x[],int &y[],const uint clr,const uint style=UINT_MAX);

void TriangleAA(const int x1,const int y1,const int x2,const int y2,const int x3,const int y3,const uint clr,const uint style=UINT_MAX);

void CircleAA(const int x,const int y,const double r,const uint clr,const uint style=UINT_MAX);

void EllipseAA(const double x1,const double y1,const double x2,const double y2,const uint clr,const uint style=UINT_MAX);

//--- Methods for drawing primitives with smoothing using Wu's algorithm

void LineWu(int x1,int y1,int x2,int y2,const uint clr,const uint style=UINT_MAX);

void PolylineWu(const int &x[],const int &y[],const uint clr,const uint style=UINT_MAX);

void PolygonWu(const int &x[],const int &y[],const uint clr,const uint style=UINT_MAX);

void TriangleWu(const int x1,const int y1,const int x2,const int y2,const int x3,const int y3,const uint clr,const uint style=UINT_MAX);

void CircleWu(const int x,const int y,const double r,const uint clr,const uint style=UINT_MAX);

void EllipseWu(const int x1,const int y1,const int x2,const int y2,const uint clr,const uint style=UINT_MAX);
所有这些方法与上面研究过的方法类似,但它们还有一个额外的 style 参数,可以从 ENUM_LINE_STYLE 枚举中选择。 它在清单中以黄色高亮显示。 如果 style 参数未设置 (等于 UINT_MAX),那么调用方法时采用 m_style 值,它是由 LineStyleSet 方法设置的默认值。 该值可经由 LineStyleGet 方法获得。
您可能已经注意到,这些方法可以设置线条样式,但无法更改线条宽度。 以下方法允许为所绘制图元设置线宽。
//--- Methods for drawing primitives with preliminarily set antialiasing filter

void LineThickVertical(const int x,const int y1,const int y2,const uint clr,const int size,const uint style,ENUM_LINE_END end_style);

void LineThickHorizontal(const int x1,const int x2,const int y,const uint clr,const int size,const uint style,ENUM_LINE_END end_style);

void LineThick(const int x1,const int y1,const int x2,const int y2,const uint clr,const int size,const uint style,ENUM_LINE_END end_style);

void PolylineThick(const int &x[],const int &y[],const uint clr,const int size,const uint style,ENUM_LINE_END end_style);

void PolygonThick(const int &x[],const int &y[],const uint clr,const int size,const uint style,ENUM_LINE_END end_style);
与上述方法类似,当前方法提供了设置 style 线条样式的功能。 它们还拥有新的参数,例如设置线宽 size - 以及可以从 ENUM_LINE_END 枚举中选择线的完成样式。
此外,CCanvas 还有运用贝塞尔(Bézier)方法绘制平滑图元的方法。 为了提高最终图像质量,利用位图平滑算法处理生成的图元。 不像之前的方法,这里的图元由贝塞尔(Bézier)曲线组成,而不是直线。 我们来研究一下这些方法。
//--- Methods for drawing a smoothed polyline and smoothed polygon

void PolylineSmooth(const int &x[],const int &y[],const uint clr,const int size,
                    ENUM_LINE_STYLE style=STYLE_SOLID,ENUM_LINE_END end_style=LINE_END_ROUND,
                    double tension=0.5,double step=10);

void PolygonSmooth(int &x[],int &y[],const uint clr,const int size,
                   ENUM_LINE_STYLE style=STYLE_SOLID,ENUM_LINE_END end_style=LINE_END_ROUND,
                   double tension=0.5,double step=10);
除了已经熟悉的 x 和 y 图元坐标点数组、clr 颜色、size 线宽、style 线条样式和 end_style 线条完成样式之外,这里我们还有两个额外的 tension 参数 - 平滑参数值和 step 近似步长。
除了上述图元绘制方法外,CCanvas 还采用了绘制填充图元的方法。
//--- Methods of drawing filled primitives

void FillRectangle(int x1,int y1,int x2,int y2,const uint clr);

void FillTriangle(int x1,int y1,int x2,int y2,int x3,int y3,const uint clr);

void FillPolygon(int &x[],int &y[],const uint clr);

void FillCircle(int x,int y,int r,const uint clr);

void FillEllipse(int x1,int y1,int x2,int y2,const uint clr);

void Fill(int x,int y,const uint clr);

void Fill(int x,int y,const uint clr,const uint threshould);
这些都是没有平滑算法的简单方法。 分配参数与我们已经研究过的方法的参数类似,包括创建类似的由线条组成的图元。
像素格式和颜色组件
我们回到上面研究的方法,并将注意力集中在 CreateBitmap 和 CreateBitmapLabel 方法中的像素格式上。 clrfmt 参数负责该格式。 该参数为创建的图形资源设置像素格式,图形资源随后关联到相应的图表对象。 在由 CreateBitmap 或 CreateBitmapLabel 方法创建画布期间,为图形资源设置的像素格式将影响终端在图表上显示图像时处理图像的方法。 为了定义图像处理方法,我们要参考 ENUM_COLOR_FORMAT。 此处我们可以从三个可能的常量值中选择一个。
ENUM_COLOR_FORMAT
- COLOR_FORMAT_XRGB_NOALPHA - XRGB 格式 (alpha 通道被忽略)
- COLOR_FORMAT_ARGB_RAW - “原始” ARGB 格式 (颜色组件不经由终端处理)
- COLOR_FORMAT_ARGB_NORMALIZE - ARGB 格式 (颜色组件经由终端处理)
现在我们来研究这些格式的颜色分量顺序。
![]()
在此,我们可以看到颜色分量 在 m_pixels 像素数组中的单元字节位置,其中 R 是红色通道,G 是绿色通道,B 是蓝色通道,a 是阿尔法通道,X 是未用到的字节。 uint 像素数据类型,4 字节。 每个通道一占个字节。 一个字节可以存储 0 到 255 之间的数字。 我们可以通过改变字节值来为像素设置颜色。 例如,为 R 通道设置 255 ,为 G 和 B 通道设置 0 时,我们会得到红色。 为 G 通道设置 255 时,剩余值设置为 0,我们得到绿色。 如果 B 通道设为 255,而其余的设置保留为 0,我们得到的是蓝色。 因此,我们可以为 RGB 通道设置各种组合值来获得不同的颜色。 把 alpha 通道值从 0(完全不可见,透明)设置为 255(完全可见,不透明),我们可以通过创建图表图像像素重叠的效果来管理像素不透明度。 这可依据 COLOR_FORMAT_ARGB_NORMALIZE 格式中正确完成。 现在我们来更换颜色,研究颜色调色板。
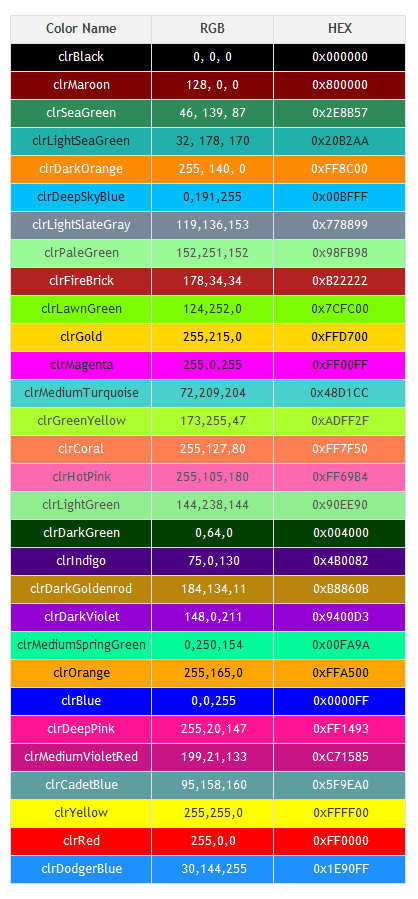
在此,我们可以清晰地看到改变 每个通道的级别组合如何影响结果颜色。 颜色以 RGB 和 HEX 格式提供。 虽然我已讲述过 RGB,但 HEX 还需要一些澄清,尤其是对于那些愿意掌握 CCanvas 的萌新程序员。 我们来研究包含 0 到 15 的十六进制数字,并将其与十进制系统(0—9)进行比较。 十进制有以下符号:0、1、2、3、4、5、6、7、8 和 9。 那么,在十六进制中,我们应该如何表示超过 9 的数字呢? 在该情况下,系统使用从 A 到 F 的拉丁字符。因此,十六进制数字系统有以下一组符号:0、1、2、3、4、5、6、7、8、9、A、B、C、D、E 和 F。现在我们可以轻松地理解包含通道值的字节在十六进制格式中的外观。 在基于 C 的编程语言中,十六进制 表示为 0x[value]。 因此,单个字节的范围看起来像是 0x00 到 0xFF 之间的值。
运用 CCanvas 创建图形的示例
我们回到像素格式,并研究运用 CCanvas 的简单应用程序示例。 此外,我们将尝试设置不同像素格式的图像颜色和 alpha 通道值,来演绎各种像素格式的值。 我们从最通用的格式开始 COLOR_FORMAT_ARGB_NORMALIZE。 我们将利用它来开发我们的第一个应用程序。
一个运用 CCanvas 的简单应用程序
创建一个脚本,并将其命名为 Erase.mq5。
#include <Canvas\Canvas.mqh>

//+------------------------------------------------------------------+
//| Script program start function                                    |
//+------------------------------------------------------------------+
void OnStart()
 {
    CCanvas canvas;
    canvas.CreateBitmapLabel("canvas", 15, 30, 300, 250, COLOR_FORMAT_ARGB_NORMALIZE);
    canvas.Erase(ColorToARGB(clrWhite, 255));
    canvas.Update(true);
    Sleep(6000);
    canvas.Destroy();
 }
在第一段代码中,我们可以看到包含了 Canvas.mqh 模块。 现在可以创建一个 CCanvas 类的对象实例,用于进一步的操作,如例所示
CCanvas canvas;
下一步,创建 Canvas 自身,设置 clrfmt 参数: COLOR_FORMAT_ARGB_NORMALIZE。
canvas.CreateBitmapLabel("canvas", 15, 30, 300, 250, COLOR_FORMAT_ARGB_NORMALIZE);
然后调用 Erase 方法填充。
canvas.Erase(ColorToARGB(clrWhite, 255));
创建画布完毕,调用 Update 方法。
canvas.Update(true); 参数 redraw: true。 这是一个可选参数,因为它是默认设置的,但为了更清晰,我建议设置它。 接下来,等待 6 秒钟,查看图表上处理应用程序的结果。
Sleep(6000);
接下来,调用Destroy方法,释放图形资源和图表对象占用的内存。
canvas.Destroy();
接下来,脚本完成其操作。结果如下图所见。
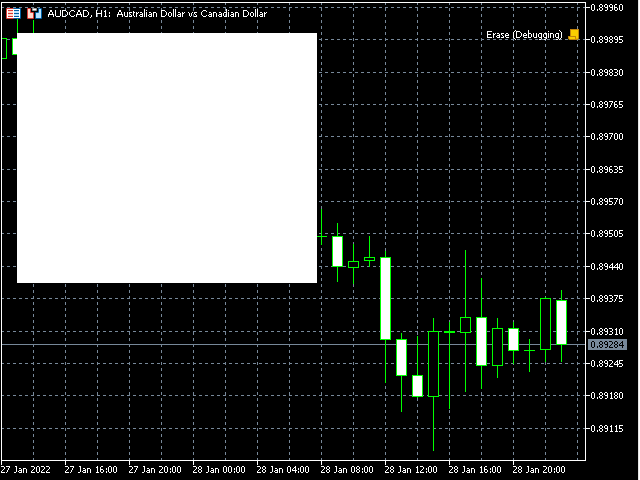
于此,我们可以看到一个填充矩形,它可以作为绘制更复杂图形结构的地基或背景。
像素格式和重叠方法
我们看一下已经研究过的示例 Erase.mq5 ,并尝试直接设置颜色,而不使用 ColorToARGB 函数。 复制示例的整个代码,并创建一个名为 ARGB_NORMALIZE.mq5 的脚本。 接下来,通过从上面提到的调色板中选择一种颜色来设置颜色,例如 clrPaleGreen。 取其十六进制格式值,并将 0xFF alpha 通道值附加于其左侧。
#include <Canvas\Canvas.mqh>

//+------------------------------------------------------------------+
//| Script program start function                                    |
//+------------------------------------------------------------------+
void OnStart()
 {
    CCanvas canvas;
    canvas.CreateBitmapLabel("canvas", 15, 30, 300, 250, COLOR_FORMAT_ARGB_NORMALIZE);
    canvas.Erase(0xFF98FB98);
    canvas.Update(true);
    Sleep(6000);
    canvas.Destroy();
 }
清单中的 RGB 组件以绿色高亮显示,A 组件以灰色高亮显示。 启动脚本并查看结果。
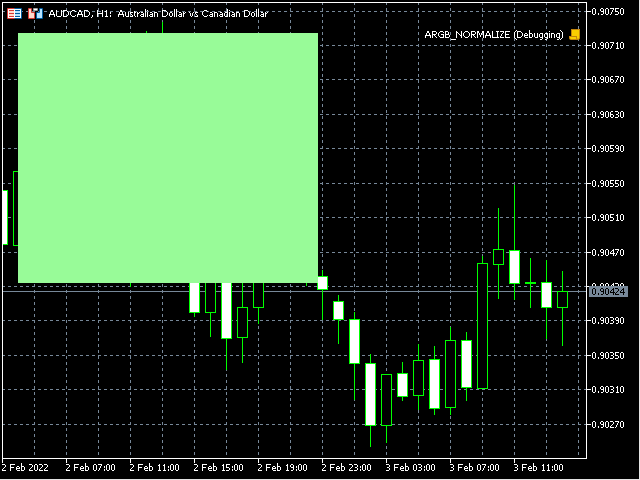
我们可以看到图像颜色是如何变化的。 现在我们尝试改变透明度。 将alpha通道值设置为 0xCC。
void OnStart()
 {
    CCanvas canvas;
    canvas.CreateBitmapLabel("canvas", 15, 30, 300, 250, COLOR_FORMAT_ARGB_NORMALIZE);
    canvas.Erase(0xCC98FB98);
    canvas.Update(true);
    Sleep(6000);
    canvas.Destroy();
 }
现在看看结果。
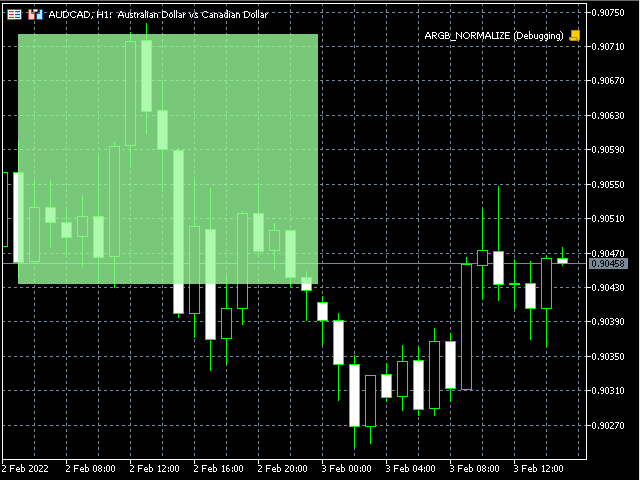
在此,我们能看到半透明区域已经被填满。
将像素格式更改为 COLOR_FORMAT_ARGB_RAW,并再次令图像完全不透明。 为此,创建一个单独的示例 ARGB_RAW.mq5。
void OnStart()
 {
    CCanvas canvas;
    canvas.CreateBitmapLabel("canvas", 15, 30, 300, 250, COLOR_FORMAT_ARGB_RAW);
    canvas.Erase(0xFF98FB98);
    canvas.Update(true);
    Sleep(6000);
    canvas.Destroy();
 }
运行示例并查看结果。
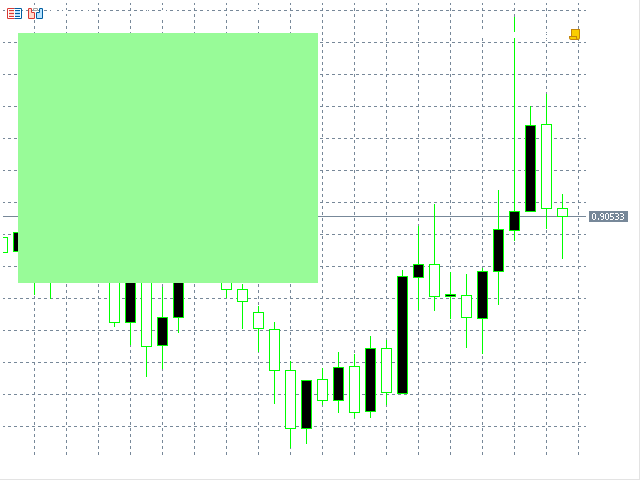
我们可以看到,结果与来自 COLOR_FORMAT_ARGB_NORMALIZE 的结果毫无二致。
将 alpha 通道设置为 0xFB,并将图表背景颜色更改为白色。
void OnStart()
 {
    ChartSetInteger(0, CHART_COLOR_BACKGROUND, clrWhite);
    CCanvas canvas;
    canvas.CreateBitmapLabel("canvas", 15, 30, 300, 250, COLOR_FORMAT_ARGB_RAW);
    canvas.Erase(0xFB98FB98);
    canvas.Update(true);
    Sleep(6000);
    canvas.Destroy();
 }
在此,我们只能看到与来自 COLOR_FORMAT_ARGB_NORMALIZE 像素格式只有细微变化,区别不大。
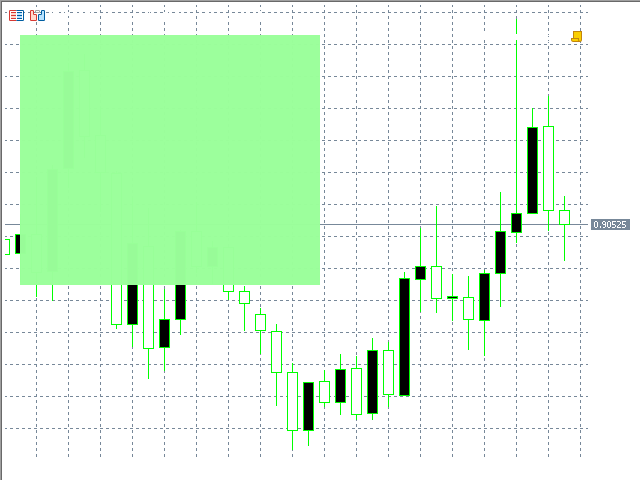
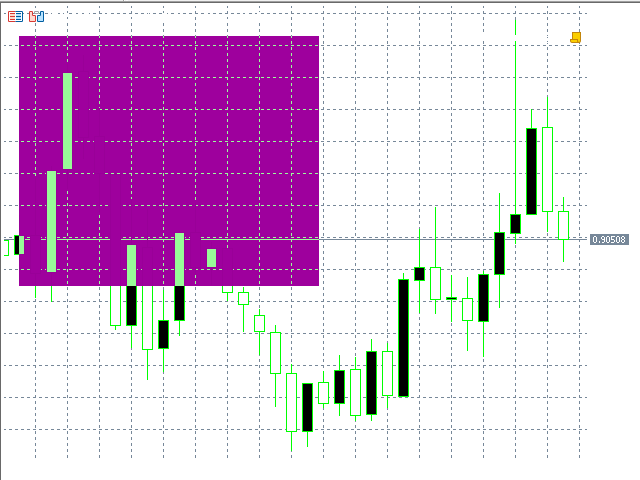
但如果我们把 alpha 通道的值减少一,
canvas.Erase(0xFA98FB98); 我们立即注意到最终图像发生了相当大的变化。
现在,我们检查一下在完全透明的情况下图像的行为。 为此,创建一个新示例,并将其命名为 ARGB_RAW-2.mq5。 复制上一个示例中的代码,并略微进行改动,以便 alpha 通道值能够以指定的间隔从 255 递减为 0。
void OnStart()
 {
  ChartSetInteger(0, CHART_COLOR_BACKGROUND, clrWhite);
  CCanvas canvas;
  canvas.CreateBitmapLabel("canvas", 15, 30, 300, 250, COLOR_FORMAT_ARGB_RAW);
  canvas.Erase(0xFF98FB98);
  for(int a = 255; a >= 0; a--)
   {
    canvas.TransparentLevelSet((uchar)a);
    canvas.Update(true);
    Sleep(100);
   }
  canvas.Destroy();
 }
正如我们在清单中所看到的,应用程序的特点是使用 for 循环,通过调用 TrancparentLevelSet 方法,并更改整个图像的透明度来更改透明度(a 是循环变量)。
canvas.TransparentLevelSet((uchar)a); 接下来,调用已经熟悉的 Update 方法。
canvas.Update(true); 接下来,调用 Sleep 函数令循环等待 100 毫秒(这样用户就有时间看到透明度的变化)。
Sleep(100); 然后应用程序移除画布
canvas.Destroy();
并结束其工作。 结果可以在下面的 GIF 动画中看到。
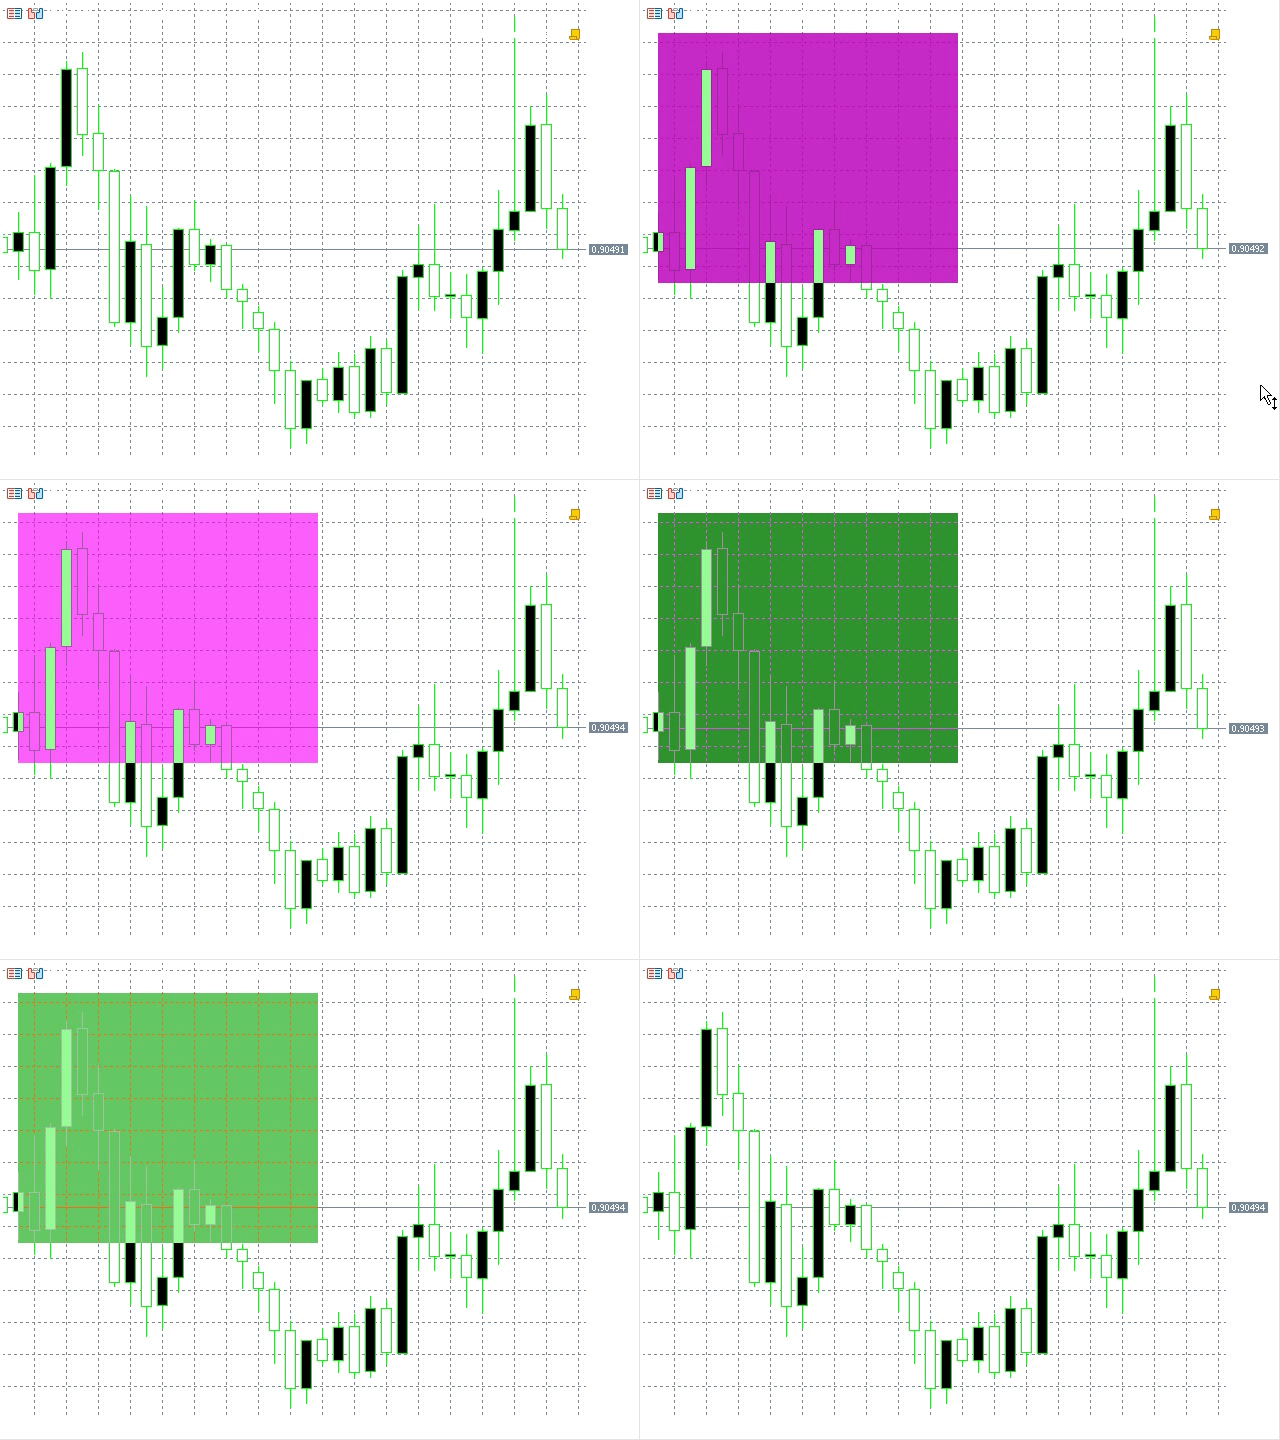
从下面的示例中,以及从所有应用 COLOR_FORMAT_ARGB_RAW FORMAT 的示例中,我们可以看到 alpha 通道值为 255 的图像显示正确。 但是如果我们减小该值,图像就会失真,因为格式没有RGB 通道值未标准化。 通道可能会被过度填充,从而产生人工制品和失真,因为超过 255 的过度填充值会被简单地丢弃。 另一方面,与 COLOR_FORMAT_ARGB_NORMALIZE 相比,使用此格式可以加快图像的显示速度。
我们回到自己的示例 ARGB_RAW.mq5 中,关于 COLOR_FORMAT_ARGB_RAW 像素格式的使用。 创建名为 XRGB_NOALPHA.mq5 的脚本,并从 ARGB_RAW.mq5 复制代码,将像素格式设置为 COLOR_FORMAT_XRGB_NOALPHA。 另外,在 Erase 方法中将 alpha 通道值设置为零。
void OnStart()
 {
    CCanvas canvas;
    canvas.CreateBitmapLabel("canvas", 15, 30, 300, 250, COLOR_FORMAT_XRGB_NOALPHA);
    canvas.Erase(0x0098FB98);
    canvas.Update(true);
    Sleep(6000);
    canvas.Destroy();
 }
启动脚本来查看结果。
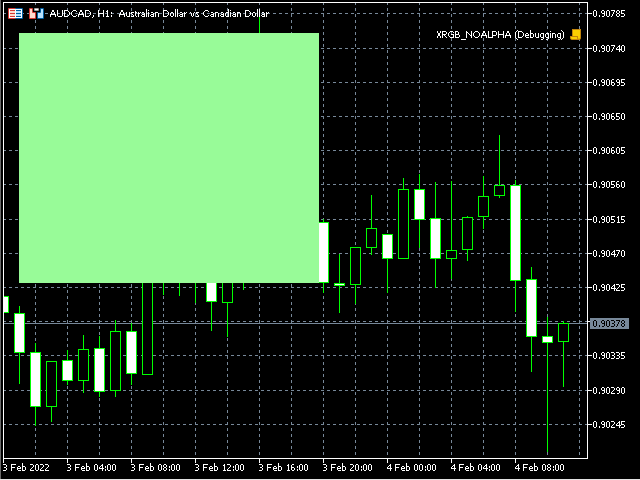
正如我们所见,结果与 Erase 方法中具有最大 alpha 通道值(0xFF)的 COLOR_FORMAT_ARGB_NORMALIZE 和 COLOR_FORMAT_ARGB_RAW 格式没有区别。 因此,我们可以看到,在这种格式中,alpha 通道值被完全忽略,图像简单地被叠加到图表图像上。
文本显示
我们知道,CCanvas 具有显示文本的方法 TextOut。 我们尝试显示文本。 创建脚本并将其命名为 TextOut.mq5。 我们用上面研究的 Erase.mq5 作为复制代码的基础。 添加设置 FontSet 字体参数的方法,并设置必要的值,字体 “Calibri”和字号 - 210。
为了以像素设置字号,FontSet 和 FontSizeSet 方法中 size 值应乘以 - 10。 因此,在字号为 21 的情况下,size 像素等于 - 210。
其余参数默认保留,接下来,添加TextOut方法,参数 text 为: “Text” 。 示例操作所需的所有其它代码都在复制的代码中予以保留。
void OnStart()
 {
    CCanvas canvas;
    canvas.CreateBitmapLabel("canvas", 15, 30, 300, 250, COLOR_FORMAT_ARGB_NORMALIZE);
    canvas.Erase(ColorToARGB(clrWhite, 255));
    canvas.FontSet("Calibri", -210);
    canvas.TextOut(15, 15, "Text", ColorToARGB(clrLightSlateGray, 255));
    canvas.Update(true);
    Sleep(6000);
    canvas.Destroy();
 }
我们看看脚本操作的结果。
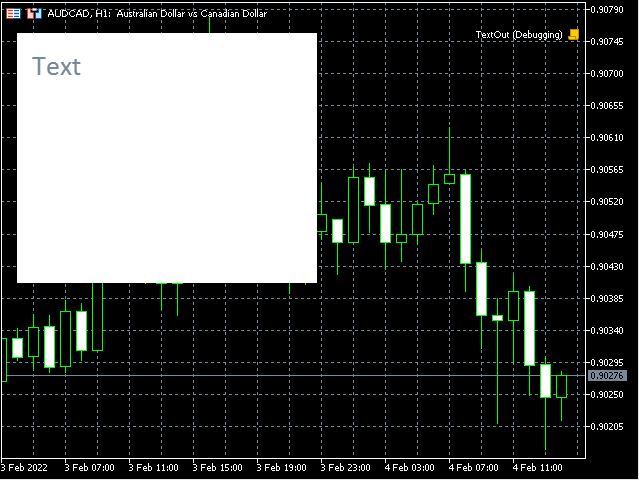
文本显示在图像上。
我们修改示例,令图像正好显示在图表的中心,并提醒标签对象(OBJ_Label)。 基于脚本创建一个新示例,并将其命名为 TextOut-2.mq5。
void OnStart()
 {
  string text = "Text";
  int width, height;
  const int textXDist = 10, textYDist = 5;
  int canvasX, canvasY;
  CCanvas canvas;

  canvas.FontSet("Calibri", -210);
  canvas.TextSize(text, width, height);

  canvasX = (int)ChartGetInteger(0, CHART_WIDTH_IN_PIXELS, 0) / 2 - width / 2;
  canvasY = (int)ChartGetInteger(0, CHART_HEIGHT_IN_PIXELS, 0) / 2 - height / 2;

  canvas.CreateBitmapLabel("canvas", canvasX, canvasY,
                           width + textXDist * 2, height + textYDist * 2,
                           COLOR_FORMAT_ARGB_NORMALIZE);
  canvas.Erase(ColorToARGB(clrWhite, 255));
  canvas.TextOut(textXDist, textYDist, text, ColorToARGB(clrLightSlateGray, 255));
  canvas.Update(true);
  Sleep(6000);
  canvas.Destroy();
 }
根据清单,显示的文本被设置到 text变量里(因为它在脚本代码中被访问两次)。
string text = "Text"; 已声明的 width 和 height 变量,用于保存显示的文本大小。
int width, height; 声明的两个常量 textXDist 和 textYDist 分别保存图像右边缘和上边缘显示文本的缩进。
const int textXDist = 10, textYDist = 5; 接下来,有两个声明变量 canvasX 和 canvasY,用于存储图像坐标计算的结果。
int canvasX, canvasY; 接下来是定义字体参数的 FontSet 方法(预先设置)。
canvas.FontSet("Calibri", -210);
TextSize 方法允许定义保存到 width 和 height 变量的所显示文本的大小(以便定义图像大小)。
canvas.TextSize(text, width, height); 接下来,我们计算用于在图表中心显示图像的图像坐标。
canvasX = (int)ChartGetInteger(0, CHART_WIDTH_IN_PIXELS, 0) / 2 - width / 2;
canvasY = (int)ChartGetInteger(0, CHART_HEIGHT_IN_PIXELS, 0) / 2 - height / 2;
接下来,我们调用 CreateBitmapLabel 创建图像,其中设置了之前计算的坐标。
canvas.CreateBitmapLabel("canvas", canvasX, canvasY,
                           width + textXDist * 2, height + textYDist * 2,
                           COLOR_FORMAT_ARGB_NORMALIZE);
于此之后,图像将由 Erase 方法填充颜色。
canvas.Erase(ColorToARGB(clrWhite, 255));
接下来,遵照之前设置的 textXDist 和 textYDist 坐标,调用 TextOut 方法显示文本(text)。
canvas.TextOut(textXDist, textYDist, text, ColorToARGB(clrLightSlateGray, 255)); 接下来,我们有一些已经很熟悉的代码,它们不需要解释。 我们启动脚本并查看结果。
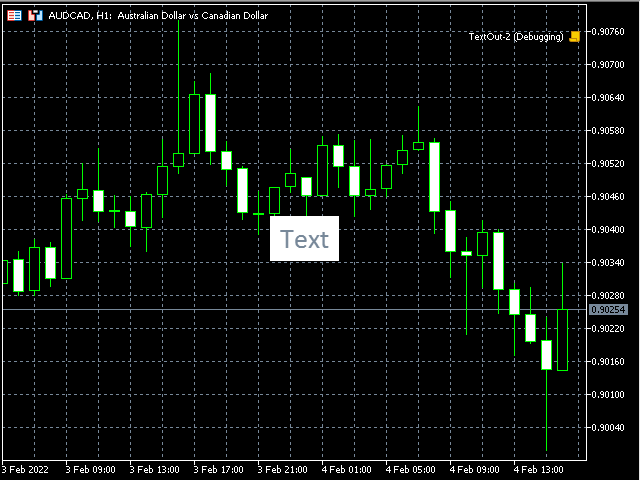
该图像显示一个类似于文本标签的对象。 但它缺乏透明的背景。 背景可以设置为我们当前的像素格式 COLOR_FORMAT_ARGB_NORMALIZE。 但我会走另一条路。 我们为画布设置 COLOR_FORMAT_ARGB_RAW 像素格式,因为在这种情况下,我们不需要混合颜色,而在格式中,只有 alpha 通道 0 和 255 时颜色显示才不会失真。 alpha 通道值为 0 时颜色不会影响最终图像。 基于上一个示例,复制 LabelExample.mq5 脚本。
void OnStart()
 {
  string text = "Text";
  int width, height;
  const int textXDist = 10, textYDist = 5;
  int canvasX, canvasY;
  CCanvas canvas;

  canvas.FontSet("Calibri", -210);
  canvas.TextSize(text, width, height);

  canvasX = (int)ChartGetInteger(0, CHART_WIDTH_IN_PIXELS, 0) / 2 - width / 2;
  canvasY = (int)ChartGetInteger(0, CHART_HEIGHT_IN_PIXELS, 0) / 2 - height / 2;

  canvas.CreateBitmapLabel("canvas", canvasX, canvasY,
                           width + textXDist * 2, height + textYDist * 2,
                           COLOR_FORMAT_ARGB_RAW);
  canvas.Erase(ColorToARGB(clrWhite, 255));
  canvas.FontSet("Calibri", -210);
  canvas.TextOut(textXDist, textYDist, text, ColorToARGB(clrLightSlateGray, 255));
  canvas.Update(true);
  Sleep(6000);
  canvas.Destroy();
 }
alpha 通道保持不变,因此我们能够确保值为 255 的 alpha 通道彻底重绘图表像素。
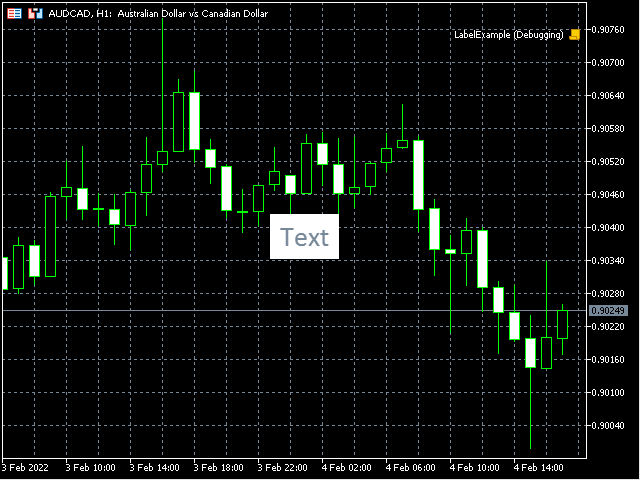
现在,我们将 alpha 通道值设置为 0。
void OnStart()
 {
  string text = "Text";
  int width, height;
  const int textXDist = 10, textYDist = 5;
  int canvasX, canvasY;
  CCanvas canvas;

  canvas.FontSet("Calibri", -210);
  canvas.TextSize(text, width, height);

  canvasX = (int)ChartGetInteger(0, CHART_WIDTH_IN_PIXELS, 0) / 2 - width / 2;
  canvasY = (int)ChartGetInteger(0, CHART_HEIGHT_IN_PIXELS, 0) / 2 - height / 2;

  canvas.CreateBitmapLabel("canvas", canvasX, canvasY,
                           width + textXDist * 2, height + textYDist * 2,
                           COLOR_FORMAT_ARGB_RAW);
  canvas.Erase(ColorToARGB(clrWhite, 0));
  canvas.FontSet("Calibri", -210);
  canvas.TextOut(textXDist, textYDist, text, ColorToARGB(clrLightSlateGray, 255));
  canvas.Update(true);
  Sleep(6000);
  canvas.Destroy();
 }
运行脚本并查看结果。
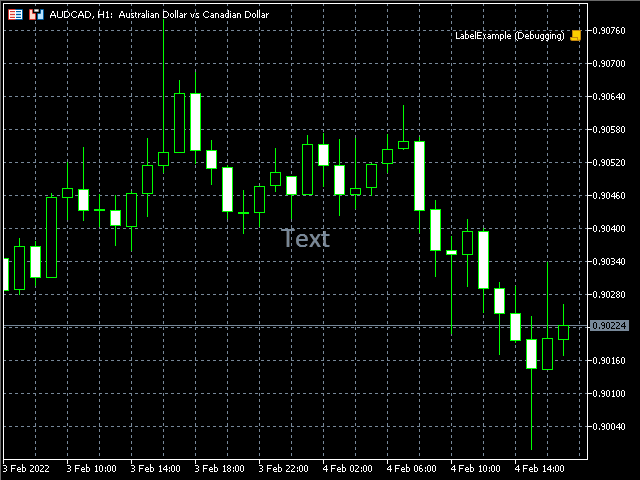
我们可以看到文本标签模拟(OBJ_LABEL)。 因此,我们能够在图像上方显示文本,而无需完全重新绘制它们。 这在各种 UI 中广泛用于高亮显示控件,和显示文本数据。
无需平滑即可绘制简单图元
我们来研究 DrawPrimitives.mq5,了解如何在 CCanvas 中绘制图元。
void OnStart()
 {
  CCanvas canvas;
  int w, h;
  int minSize, point;
  uint color_ = ColorToARGB(clrDodgerBlue, 255);
  uint fillColor = ColorToARGB(clrRed, 255);
  int plX[] = {6, 8, 9, 11, 12, 14}, plY[] = {14, 12, 13, 11, 12, 10};
  int pgX[] = {15, 14, 15, 17, 18, 17}, pgY[] = {9, 7, 5, 5, 7, 9};
  w = (int)ChartGetInteger(0, CHART_WIDTH_IN_PIXELS, 0);
  h = (int)ChartGetInteger(0, CHART_HEIGHT_IN_PIXELS, 0);
  minSize = (int)fmin(w, h);
  point = minSize / 15;
  canvas.CreateBitmapLabel("canvas", 0, 0, w, h, COLOR_FORMAT_XRGB_NOALPHA);
  canvas.Erase(ColorToARGB(clrWhite, 255));
  canvas.LineHorizontal(point, w - point, h - point, color_);
  canvas.LineVertical(point, point, h - point, color_);
  canvas.Line(point * 2, point * 13, point * 8, point * 9, color_);
  for (int i = 0; i < (int)plX.Size(); i++)
    plX[i] *= point;
  for (int i = 0; i < (int)plY.Size(); i++)
    plY[i] *= point;
  canvas.Polyline(plX, plY, color_);
  for (int i = 0; i < (int)pgX.Size(); i++)
    pgX[i] *= point;
  for (int i = 0; i < (int)pgY.Size(); i++)
    pgY[i] *= point;
  canvas.Polygon(pgX, pgY, color_);
  canvas.Rectangle(point * 2, point * 5, point * 7, point, color_);
  canvas.Triangle(point * 2, point * 11, point * 2, point * 6, point * 7, point * 6, color_);
  canvas.Circle(point * 10, point * 3, point * 2, color_);
  canvas.Ellipse(point * 8, point * 9, point * 12, point * 6, color_);
  canvas.Arc(point * 15, point * 2, point * 2, point, 45.0 * M_PI / 180, 180.0 * M_PI / 180, color_);
  canvas.Pie(point * 16, point * 3, point * 2, point, 180.0 * M_PI / 180, 402.5 * M_PI / 180, color_, fillColor);
  canvas.Update(true);
  Sleep(6000);
  canvas.Destroy();
 }
所有图元都可以便捷地沿着正方形绘制。 它们的坐标和其余参数可用相同的方法予以设置。 因此,我决定通过将 CCanvas 图像划分为具有相同宽度和高度的部分来简化任务,这样就可以设置正方形坐标,并通过将正方形坐标乘以单个正方形的大小将其转换为像素。 为了达此目的,我将图表大小取为 CCanvas 图像大小,并将最小大小值除以 15。
  CCanvas canvas;
  int w, h;
  int minSize, point;
  uint color_ = ColorToARGB(clrDodgerBlue, 255);
  uint fillColor = ColorToARGB(clrRed, 255);
  int plX[] = {6, 8, 9, 11, 12, 14}, plY[] = {14, 12, 13, 11, 12, 10};
  int pgX[] = {15, 14, 15, 17, 18, 17}, pgY[] = {9, 7, 5, 5, 7, 9};
  w = (int)ChartGetInteger(0, CHART_WIDTH_IN_PIXELS, 0);
  h = (int)ChartGetInteger(0, CHART_HEIGHT_IN_PIXELS, 0);
  minSize = (int)fmin(w, h);
  point = minSize / 15;
代码在清单中以黄色高亮显示。 既然我们知道了一个正方形的大小(point 变量),我们就可以将以正方形为单位设置的坐标转换成以像素为单位的实际大小。 在创建示例之前,我将图表图像划分为正方形,并用它们设置脚本中所有图元的坐标。
int plX[] = {6, 8, 9, 11, 12, 14}, plY[] = {14, 12, 13, 11, 12, 10};
int pgX[] = {15, 14, 15, 17, 18, 17}, pgY[] = {9, 7, 5, 5, 7, 9};
在此我为数组中的多段线(Polyline)和多边形(Polygon)设置坐标。 然后我把它们转换成像素,在循环中逐一选择数组,然后画一条多段线和一个多边形。
  for (int i = 0; i < (int)plX.Size(); i++)
    plX[i] *= point;
  for (int i = 0; i < (int)plY.Size(); i++)
    plY[i] *= point;
  canvas.Polyline(plX, plY, color_);
  for (int i = 0; i < (int)pgX.Size(); i++)
    pgX[i] *= point;
  for (int i = 0; i < (int)pgY.Size(); i++)
    pgY[i] *= point;
  canvas.Polygon(pgX, pgY, color_);
调用基本绘图方法的代码以黄色高亮显示。 其余的图元按以下方式显示。
  canvas.Polygon(pgX, pgY, color_);
  canvas.Rectangle(point * 2, point * 5, point * 7, point, color_);
  canvas.Triangle(point * 2, point * 11, point * 2, point * 6, point * 7, point * 6, color_);
  canvas.Circle(point * 10, point * 3, point * 2, color_);
  canvas.Ellipse(point * 8, point * 9, point * 12, point * 6, color_);
  canvas.Arc(point * 15, point * 2, point * 2, point, 45.0 * M_PI / 180, 180.0 * M_PI / 180, color_);
  canvas.Pie(point * 16, point * 3, point * 2, point, 180.0 * M_PI / 180, 402.5 * M_PI / 180, color_, fillColor);
正如我们从清单所见,所有坐标都乘以 point 变量的值,从而转换为像素。 我们来考察脚本结果。
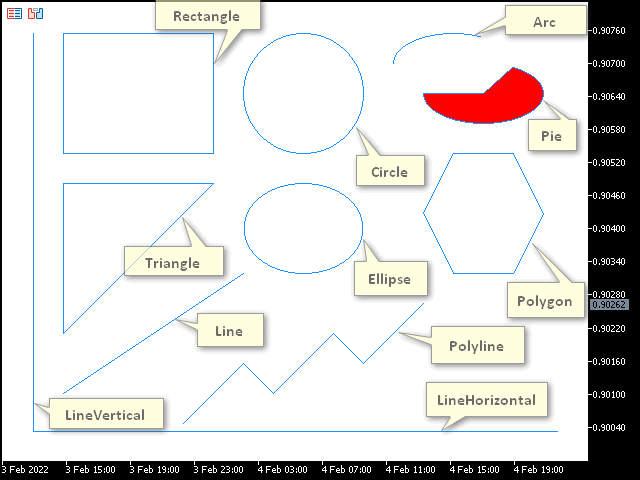
我们可以看到配以简单线条绘制样式(STYLE_SOLID)的图元,其无法被更改。
绘制配以平滑和可变样式的图元
若要允许更改线条样式,需使用整理算法应用抗锯齿(AA)的方法。 创建脚本 DrawPrimitivesAA.mq5,并将上一个示例中的代码复制到其中。 CCanvas 类中所有带有 AA 前缀(LineAA、PolylineAA、polygona、TriangleAA、CircleAA 和 EllipseAA)的方法都是完全兼容的。 其它方法被删除。 由于与上一个示例相比,我们现在的图元更少,因此可以更改它们的位置。
void OnStart()
 {
  CCanvas canvas;
  int w, h;
  int minSize, point;
  uint color_ = ColorToARGB(clrDodgerBlue, 255);
  uint fillColor = ColorToARGB(clrRed, 255);
  int plX[] = {6, 8, 9, 11, 12, 14}, plY[] = {13, 11, 12, 10, 11, 9};
  int pgX[] = {15, 14, 15, 17, 18, 17}, pgY[] = {7, 5, 3, 3, 5, 7};
  ENUM_LINE_STYLE lineStyle = STYLE_SOLID;
  w = (int)ChartGetInteger(0, CHART_WIDTH_IN_PIXELS, 0);
  h = (int)ChartGetInteger(0, CHART_HEIGHT_IN_PIXELS, 0);
  minSize = (int)fmin(w, h);
  point = minSize / 15;
  canvas.CreateBitmapLabel("canvas", 0, 0, w, h, COLOR_FORMAT_XRGB_NOALPHA);
  canvas.Erase(ColorToARGB(clrWhite, 255));
  canvas.LineStyleSet(lineStyle);
  canvas.LineAA(point * 2, point * 12, point * 8, point * 8, color_);
  for (int i = 0; i < (int)plX.Size(); i++)
    plX[i] *= point;
  for (int i = 0; i < (int)plY.Size(); i++)
    plY[i] *= point;
  canvas.PolylineAA(plX, plY, color_);
  for (int i = 0; i < (int)pgX.Size(); i++)
    pgX[i] *= point;
  for (int i = 0; i < (int)pgY.Size(); i++)
    pgY[i] *= point;
  canvas.PolygonAA(pgX, pgY, color_);
  canvas.TriangleAA(point * 2, point * 9, point * 2, point * 4, point * 7, point * 4, color_);
  canvas.CircleAA(point * 16, point * 11, point * 2, color_);
  canvas.EllipseAA(point * 8, point * 4, point * 12, point * 7, color_);
  canvas.Update(true);
  Sleep(6000);
  canvas.Destroy();
 }
更改的代码以黄色高亮显示。 现在,我们启动脚本并查看结果。
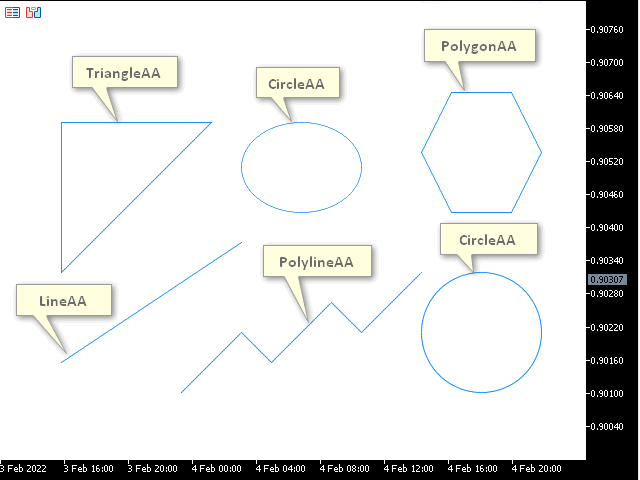
该图像显示了使用抗锯齿的方法的结果。 与前面涉及简单图元的示例相比,这些线看起来更平滑。
然而,这里的线条样式仍然是 STYLE_SOLID。 为解决这个问题,我们创建脚本 DrawPrimitivesAA-2.mq5,并在其中插入上一个示例的代码。 设置 sleep 作为输入参数,设置更改线条样式,和显示图元后的延迟。
#property script_show_inputs

//--- input parameters
input int sleep = 1000;
所有绘图方法都在宏定义中设置。
#define drawPrimitives canvas.Erase(ColorToARGB(clrWhite, 255));                               \
  canvas.LineAA(point * 2, point * 12, point * 8, point * 8, color_);                          \
  canvas.PolylineAA(plX, plY, color_);                                                         \
  canvas.PolygonAA(pgX, pgY, color_);                                                          \
  canvas.TriangleAA(point * 2, point * 9, point * 2, point * 4, point * 7, point * 4, color_); \
  canvas.CircleAA(point * 16, point * 11, point * 2, color_);                                  \
  canvas.EllipseAA(point * 8, point * 4, point * 12, point * 7, color_);                       \
  canvas.Update(true);                                                                         \
  Sleep(sleep);
接下来,调用 LineStyleSet 方法并显示图元,逐个更改线条绘制样式。 我们看看这个示例。
#property script_show_inputs

//--- input parameters
input int sleep = 1000;

//+------------------------------------------------------------------+
//|                                                                  |
//+------------------------------------------------------------------+
#include <Canvas\Canvas.mqh>

//+------------------------------------------------------------------+
//|                                                                  |
//+------------------------------------------------------------------+
#define drawPrimitives canvas.Erase(ColorToARGB(clrWhite, 255));                               \
  canvas.LineAA(point * 2, point * 12, point * 8, point * 8, color_);                          \
  canvas.PolylineAA(plX, plY, color_);                                                         \
  canvas.PolygonAA(pgX, pgY, color_);                                                          \
  canvas.TriangleAA(point * 2, point * 9, point * 2, point * 4, point * 7, point * 4, color_); \
  canvas.CircleAA(point * 16, point * 11, point * 2, color_);                                  \
  canvas.EllipseAA(point * 8, point * 4, point * 12, point * 7, color_);                       \
  canvas.Update(true);                                                                         \
  Sleep(sleep);

//+------------------------------------------------------------------+
//| Script program start function                                    |
//+------------------------------------------------------------------+
void OnStart()
 {
  CCanvas canvas;
  int w, h;
  int minSize, point;
  uint color_ = ColorToARGB(clrDodgerBlue, 255);
  uint fillColor = ColorToARGB(clrRed, 255);
  int plX[] = {6, 8, 9, 11, 12, 14}, plY[] = {13, 11, 12, 10, 11, 9};
  int pgX[] = {15, 14, 15, 17, 18, 17}, pgY[] = {7, 5, 3, 3, 5, 7};
  //ENUM_LINE_STYLE lineStyle;
  w = (int)ChartGetInteger(0, CHART_WIDTH_IN_PIXELS, 0);
  h = (int)ChartGetInteger(0, CHART_HEIGHT_IN_PIXELS, 0);
  minSize = (int)fmin(w, h);
  point = minSize / 15;
  canvas.CreateBitmapLabel("canvas", 0, 0, w, h, COLOR_FORMAT_XRGB_NOALPHA);

  for (int i = 0; i < (int)plX.Size(); i++)
    plX[i] *= point;
  for (int i = 0; i < (int)plY.Size(); i++)
    plY[i] *= point;
  for (int i = 0; i < (int)pgX.Size(); i++)
    pgX[i] *= point;
  for (int i = 0; i < (int)pgY.Size(); i++)
    pgY[i] *= point;

  canvas.LineStyleSet(STYLE_SOLID);
  drawPrimitives
  canvas.LineStyleSet(STYLE_DOT);
  drawPrimitives
  canvas.LineStyleSet(STYLE_DASH);
  drawPrimitives
  canvas.LineStyleSet(STYLE_DASHDOTDOT);
  drawPrimitives

  Sleep(6000);
  canvas.Destroy();
 }
高亮显示的代码片段演示了如何更改样式,并调用绘图方法。 我们看看脚本操作的结果。
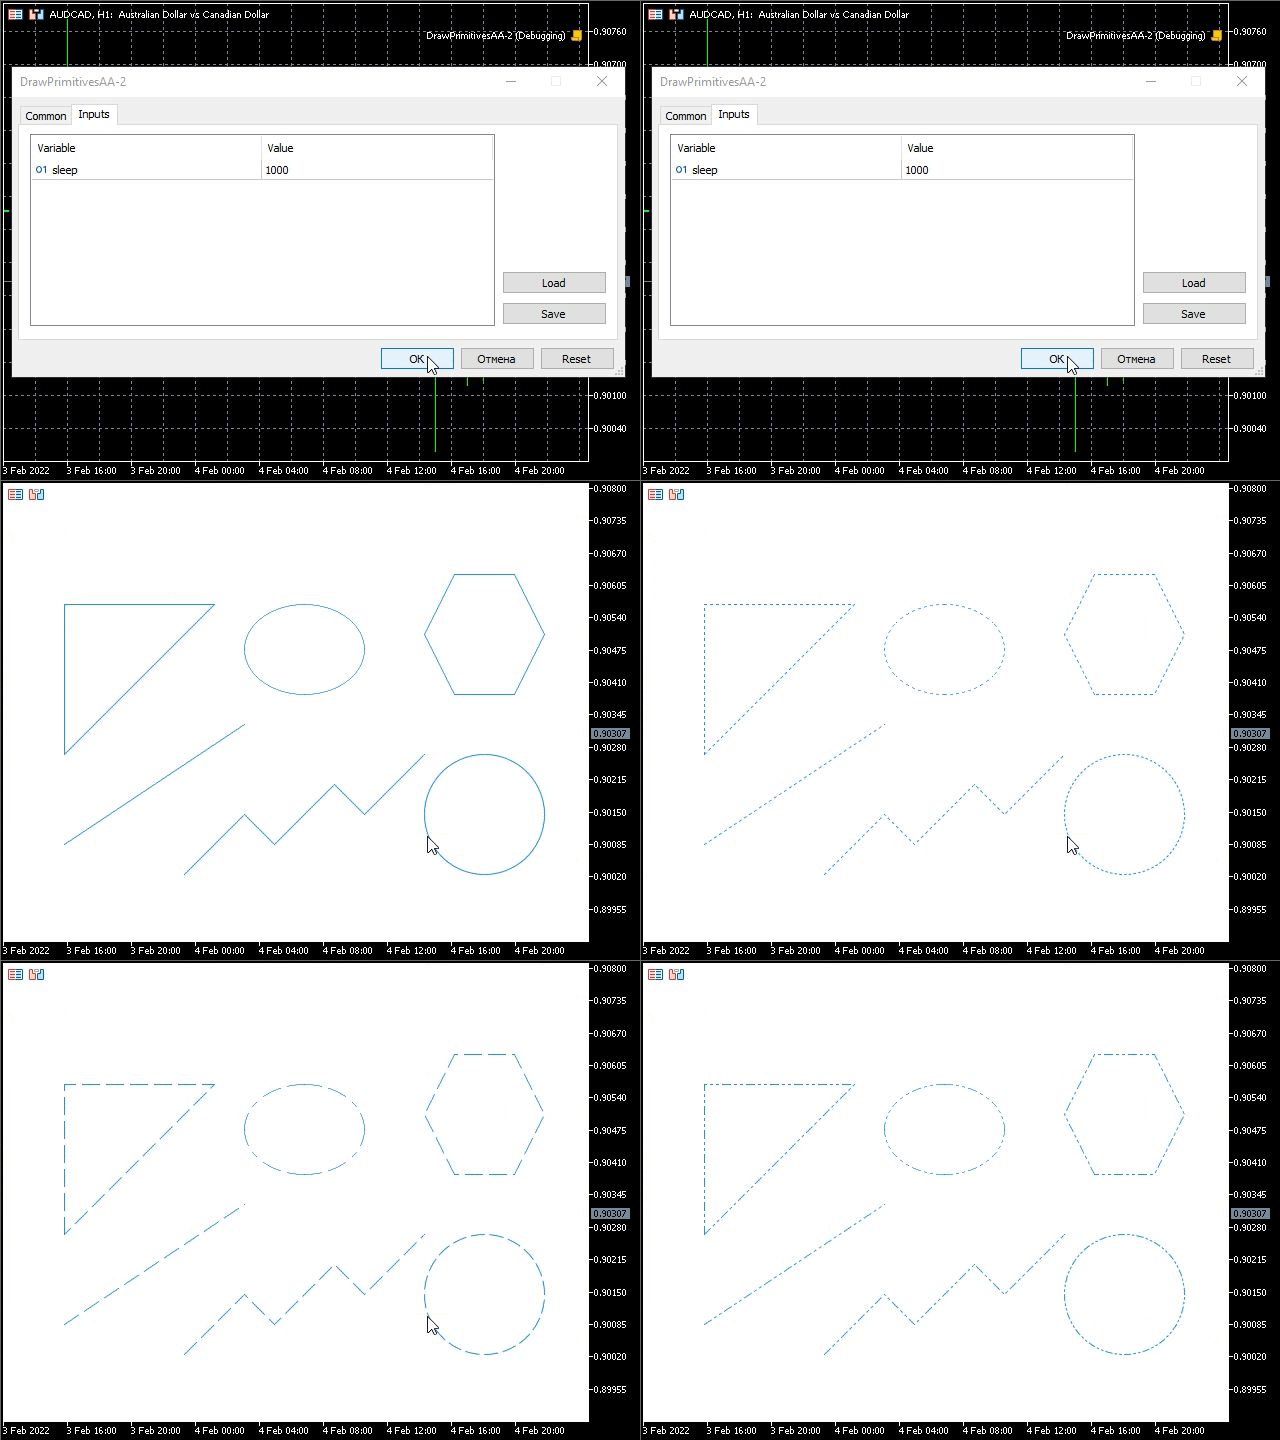
GIF 动画以指定的 sleep 间隔显示图元线条样式的变化。
现在,我建议使用 Wu 算法创建一个绘制图元的示例。 基于上一个示例,创建 DrawPrimitivesWu.mq5 脚本。 将 AA 符号组合替换为 Wu,并注释掉清单中所示的字符串。
#property script_show_inputs

//--- input parameters
input int sleep = 1000;

//+------------------------------------------------------------------+
//|                                                                  |
//+------------------------------------------------------------------+
#include <Canvas\Canvas.mqh>

//+------------------------------------------------------------------+
//|                                                                  |
//+------------------------------------------------------------------+
#define drawPrimitives canvas.Erase(ColorToARGB(clrWhite, 255));                               \
  canvas.LineWu(point * 2, point * 12, point * 8, point * 8, color_);                          \
  canvas.PolylineWu(plX, plY, color_);                                                         \
  canvas.PolygonWu(pgX, pgY, color_);                                                          \
  canvas.TriangleWu(point * 2, point * 9, point * 2, point * 4, point * 7, point * 4, color_); \
  canvas.CircleWu(point * 16, point * 11, point * 2, color_);                                  \
  canvas.EllipseWu(point * 8, point * 4, point * 12, point * 7, color_);                       \
  canvas.Update(true);                                                                         \
  Sleep(sleep);

//+------------------------------------------------------------------+
//| Script program start function                                    |
//+------------------------------------------------------------------+
void OnStart()
 {
  CCanvas canvas;
  int w, h;
  int minSize, point;
  uint color_ = ColorToARGB(clrDodgerBlue, 255);
  uint fillColor = ColorToARGB(clrRed, 255);
  int plX[] = {6, 8, 9, 11, 12, 14}, plY[] = {13, 11, 12, 10, 11, 9};
  int pgX[] = {15, 14, 15, 17, 18, 17}, pgY[] = {7, 5, 3, 3, 5, 7};
  //ENUM_LINE_STYLE lineStyle;
  w = (int)ChartGetInteger(0, CHART_WIDTH_IN_PIXELS, 0);
  h = (int)ChartGetInteger(0, CHART_HEIGHT_IN_PIXELS, 0);
  minSize = (int)fmin(w, h);
  point = minSize / 15;

  canvas.CreateBitmapLabel("canvas", 0, 0, w, h, COLOR_FORMAT_XRGB_NOALPHA);

  for (int i = 0; i < (int)plX.Size(); i++)
    plX[i] *= point;
  for (int i = 0; i < (int)plY.Size(); i++)
    plY[i] *= point;
  for (int i = 0; i < (int)pgX.Size(); i++)
    pgX[i] *= point;
  for (int i = 0; i < (int)pgY.Size(); i++)
    pgY[i] *= point;

  canvas.LineStyleSet(STYLE_SOLID);
  drawPrimitives
  //canvas.LineStyleSet(STYLE_DOT);
  //drawPrimitives
  //canvas.LineStyleSet(STYLE_DASH);
  //drawPrimitives
  //canvas.LineStyleSet(STYLE_DASHDOTDOT);
  //drawPrimitives

  Sleep(6000);
  canvas.Destroy();
 }
所有添加的方法都以黄色高亮显示。 运行示例查看结果。
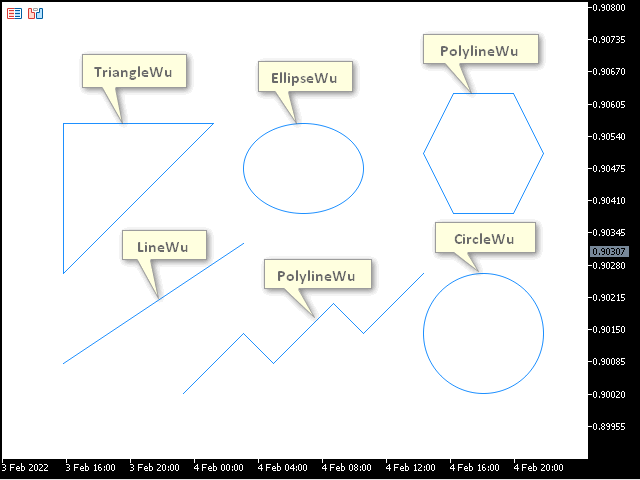
如我们所见,由于运用 Wu 算法进行平滑处理,绘图质量再次提高。 现在,取消脚本中的代码注释,并再次启动它。
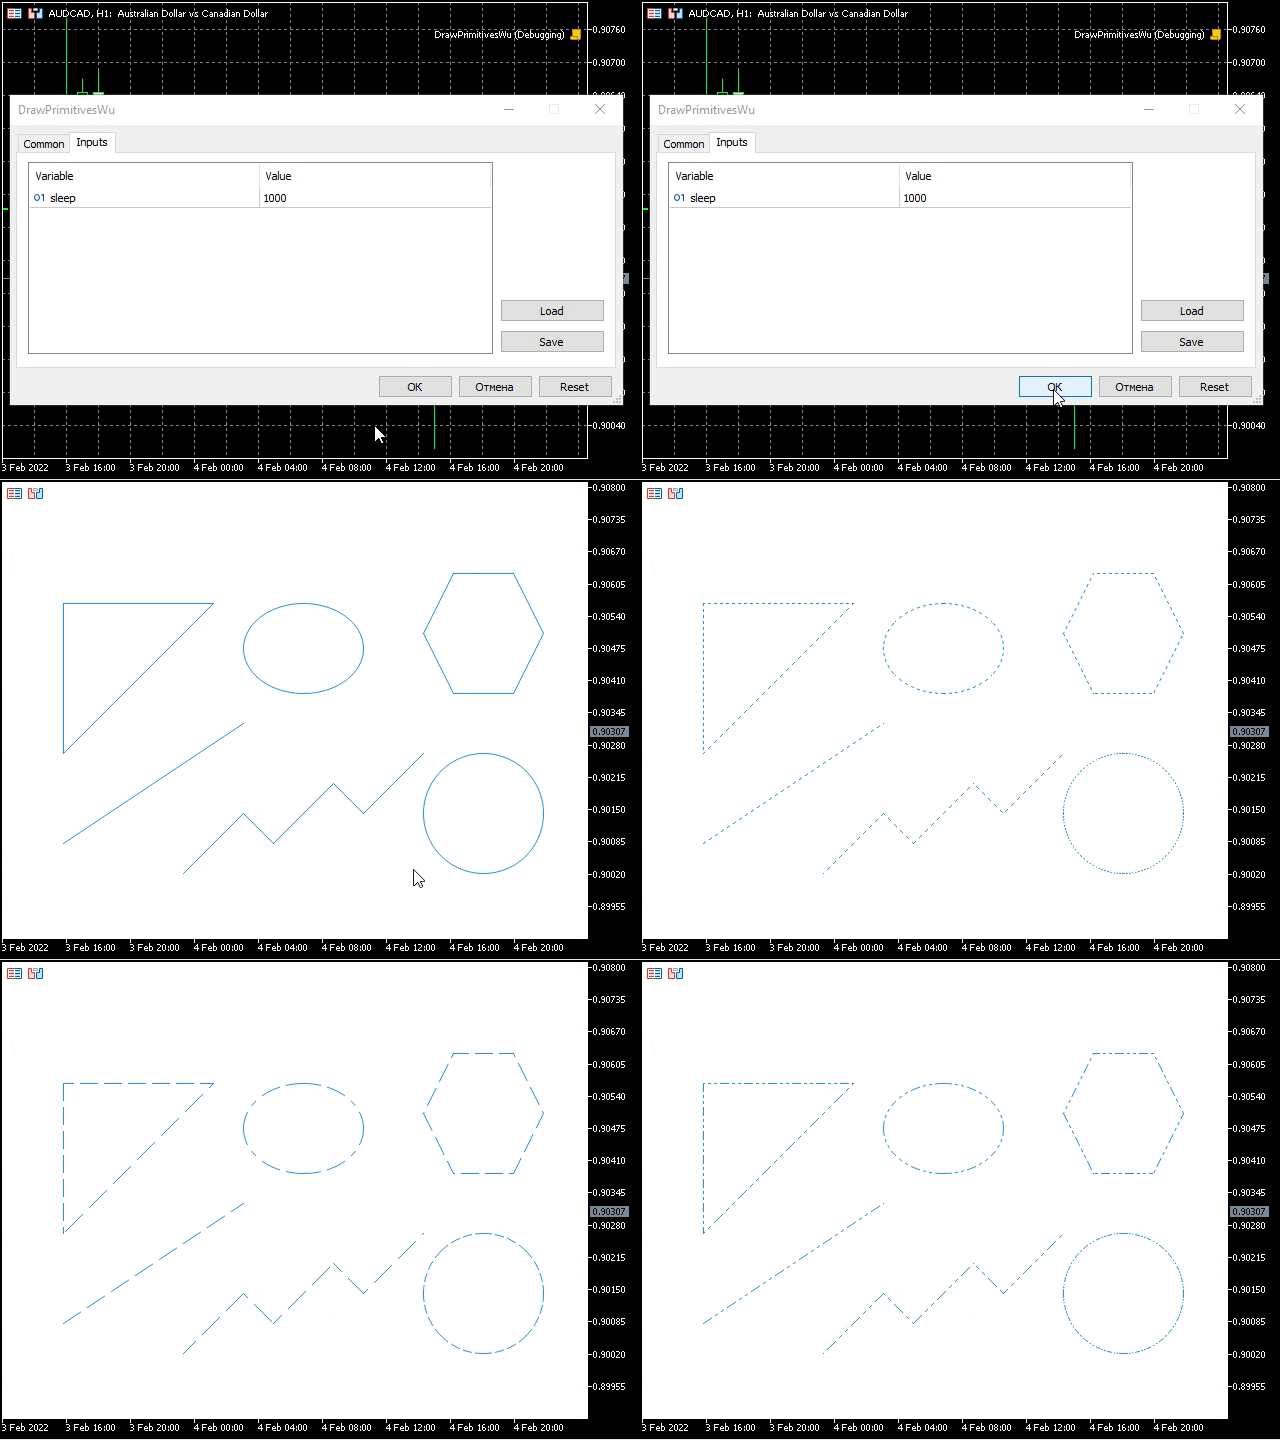
线条样式的变化与上一个示例相同,但平滑的图元图像质量更高。
绘制可变线宽的图元
基于上一个示例创建的脚本,并将其命名为 DrawPrimitivesThick.mq5。 将现有的图元绘图方法替换为含有 “Thick” 前缀的方法,并删除与清单里没有相似之处的方法。 注释掉不必要的代码,如前一个示例中所示。
#property script_show_inputs

//--- input parameters
input int sleep = 1000;

//+------------------------------------------------------------------+
//|                                                                  |
//+------------------------------------------------------------------+
#include <Canvas\Canvas.mqh>

//+------------------------------------------------------------------+
//|                                                                  |
//+------------------------------------------------------------------+
#define drawPrimitives canvas.Erase(ColorToARGB(clrWhite, 255));                                      \
  canvas.LineThickVertical(point, point, h - point, color_, size, lineStyle, endStyle);               \
  canvas.LineThickHorizontal(point, w - point, h - point, color_, size, lineStyle, endStyle);         \
  canvas.LineThick(point * 2, point * 12, point * 8, point * 8, color_, size, lineStyle, endStyle);   \
  canvas.PolylineThick(plX, plY, color_, size, lineStyle, endStyle);                                  \
  canvas.PolygonThick(pgX, pgY, color_, size, lineStyle, endStyle);                                   \
  canvas.Update(true);                                                                                \
  Sleep(sleep);

//+------------------------------------------------------------------+
//| Script program start function                                    |
//+------------------------------------------------------------------+
void OnStart()
 {
  CCanvas canvas;
  int w, h;
  int minSize, point;
  uint color_ = ColorToARGB(clrDodgerBlue, 255);
  uint fillColor = ColorToARGB(clrRed, 255);
  int plX[] = {6, 8, 9, 11, 12, 14}, plY[] = {13, 11, 12, 10, 11, 9};
  int pgX[] = {17, 18, 17, 15, 14, 15, 17}, pgY[] = {7, 5, 3, 3, 5, 7, 7};
  ENUM_LINE_STYLE lineStyle = STYLE_SOLID;
  int size = 3;
  ENUM_LINE_END endStyle = LINE_END_ROUND;
  w = (int)ChartGetInteger(0, CHART_WIDTH_IN_PIXELS, 0);
  h = (int)ChartGetInteger(0, CHART_HEIGHT_IN_PIXELS, 0);
  minSize = (int)fmin(w, h);
  point = minSize / 15;
  canvas.CreateBitmapLabel("canvas", 0, 0, w, h, COLOR_FORMAT_XRGB_NOALPHA);

  for (int i = 0; i < (int)plX.Size(); i++)
    plX[i] *= point;
  for (int i = 0; i < (int)plY.Size(); i++)
    plY[i] *= point;
  for (int i = 0; i < (int)pgX.Size(); i++)
    pgX[i] *= point;
  for (int i = 0; i < (int)pgY.Size(); i++)
    pgY[i] *= point;

  canvas.LineStyleSet(STYLE_SOLID);
  drawPrimitives
  //canvas.LineStyleSet(STYLE_DOT);
  //drawPrimitives
  //canvas.LineStyleSet(STYLE_DASH);
  //drawPrimitives
  //canvas.LineStyleSet(STYLE_DASHDOTDOT);
  drawPrimitives

  Sleep(6000);
  canvas.Destroy();
 }
添加的方法以黄色高亮显示。 正如您可能已经注意到的,我们所研究的方法拥有两个附加参数: size - 线宽;和 end_style - 线条完成样式。 运行脚本并查看结果。
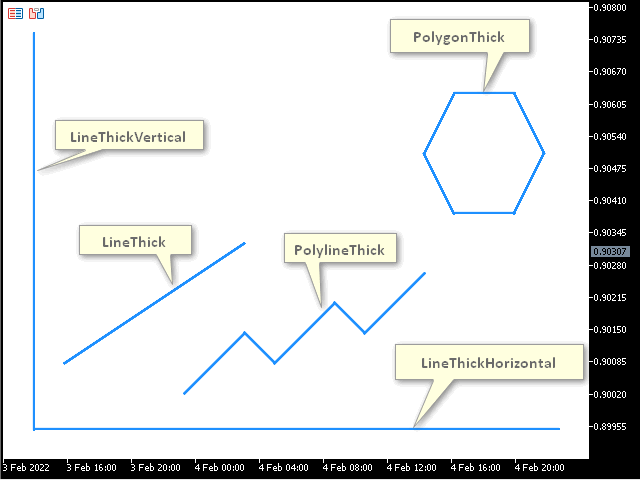
该图像显示粗线条的图元,其宽度可以如上所述进行更改。 基于上一个脚本创建脚本,并将其命名为 DrawPrimitivesThick-2.mq5 。 它将允许我们看到所有可能的线条宽度、线条样式和线条完成样式的组合。 若要实现这一点,取消对之前代码的注释,并将它们添加到 method1 的宏替换中,我们将在其中更改线条完成样式,并在每次更改后调用 method0 宏替换。 我们将在method00宏替换中调用图元绘制方法。 在 drawPrimitives 宏替换里,我们将更改线条样式,并在每次线条样式更改后调用 method1。 循环中调用 drawPrimitives 宏替换,在指定范围内更改线宽。
#property script_show_inputs

//--- input parameters
input int sleep = 1000;
input int beginSize = 1;
input int endSize = 4;

//+------------------------------------------------------------------+
//|                                                                  |
//+------------------------------------------------------------------+
#include <Canvas\Canvas.mqh>

//+------------------------------------------------------------------+
//|                                                                  |
//+------------------------------------------------------------------+
#define drawPrimitives lineStyle = STYLE_SOLID; \
  method1                                       \
  lineStyle = STYLE_DOT;                        \
  method1                                       \
  lineStyle = STYLE_DASH;                       \
  method1                                       \
  lineStyle = STYLE_DASHDOTDOT;                 \
  method1

#define method1 endStyle = LINE_END_ROUND; \
  method0                                  \
  endStyle = LINE_END_BUTT;                \
  method0                                  \
  endStyle = LINE_END_SQUARE;              \
  method0

#define method0 canvas.Erase(ColorToARGB(clrWhite, 255));                                                                                                      \
  canvas.LineThickVertical(point, point, h - point, color_, size, lineStyle, endStyle);                                                                        \
  canvas.LineThickHorizontal(point, w - point, h - point, color_, size, lineStyle, endStyle);                                                                  \
  canvas.LineThick(point * 2, point * 12, point * 8, point * 8, color_, size, lineStyle, endStyle);                                                            \
  canvas.PolylineThick(plX, plY, color_, size, lineStyle, endStyle);                                                                                           \
  canvas.PolygonThick(pgX, pgY, color_, size, lineStyle, endStyle);                                                                                            \
  canvas.TextOut(point * 2, point, "Size: " + (string)size + "; Style: " + EnumToString(lineStyle) + "; End Style: " + EnumToString(endStyle) + ";", color_);  \
  canvas.Update(true);                                                                                                                                         \
  Sleep(sleep);

//+------------------------------------------------------------------+
//| Script program start function                                    |
//+------------------------------------------------------------------+
void OnStart()
 {
  CCanvas canvas;
  int w, h;
  int minSize, point;
  uint color_ = ColorToARGB(clrDodgerBlue, 255);
  uint fillColor = ColorToARGB(clrRed, 255);
  int plX[] = {6, 8, 9, 11, 12, 14}, plY[] = {13, 11, 12, 10, 11, 9};
  int pgX[] = {17, 18, 17, 15, 14, 15, 17}, pgY[] = {7, 5, 3, 3, 5, 7, 7};
  ENUM_LINE_STYLE lineStyle = STYLE_SOLID;
  int size = 3;
  ENUM_LINE_END endStyle = LINE_END_ROUND;
  w = (int)ChartGetInteger(0, CHART_WIDTH_IN_PIXELS, 0);
  h = (int)ChartGetInteger(0, CHART_HEIGHT_IN_PIXELS, 0);
  minSize = (int)fmin(w, h);
  point = minSize / 15;
  canvas.CreateBitmapLabel("canvas", 0, 0, w, h, COLOR_FORMAT_XRGB_NOALPHA);
  canvas.FontSet("Calibri", -120);

  for (int i = 0; i < (int)plX.Size(); i++)
    plX[i] *= point;
  for (int i = 0; i < (int)plY.Size(); i++)
    plY[i] *= point;
  for (int i = 0; i < (int)pgX.Size(); i++)
    pgX[i] *= point;
  for (int i = 0; i < (int)pgY.Size(); i++)
    pgY[i] *= point;

  for (int i = beginSize; i <= endSize; i++) {
    size = i;
    drawPrimitives
  }

  Sleep(6000);
  canvas.Destroy();
 }
//+------------------------------------------------------------------+
所有代码变更都以黄色高亮显示。 生成的脚本从 beginSize 和 endSize 输入参数中获取线宽范围,并以宏替换沿所有可能的线条样式和完成组合选项移动。 结果就是,我们可以列举所有可能的线条图元参数,这些参数的组合可以经由运行脚本看到。 下面的 GIF 动画展示了脚本操作的结果。
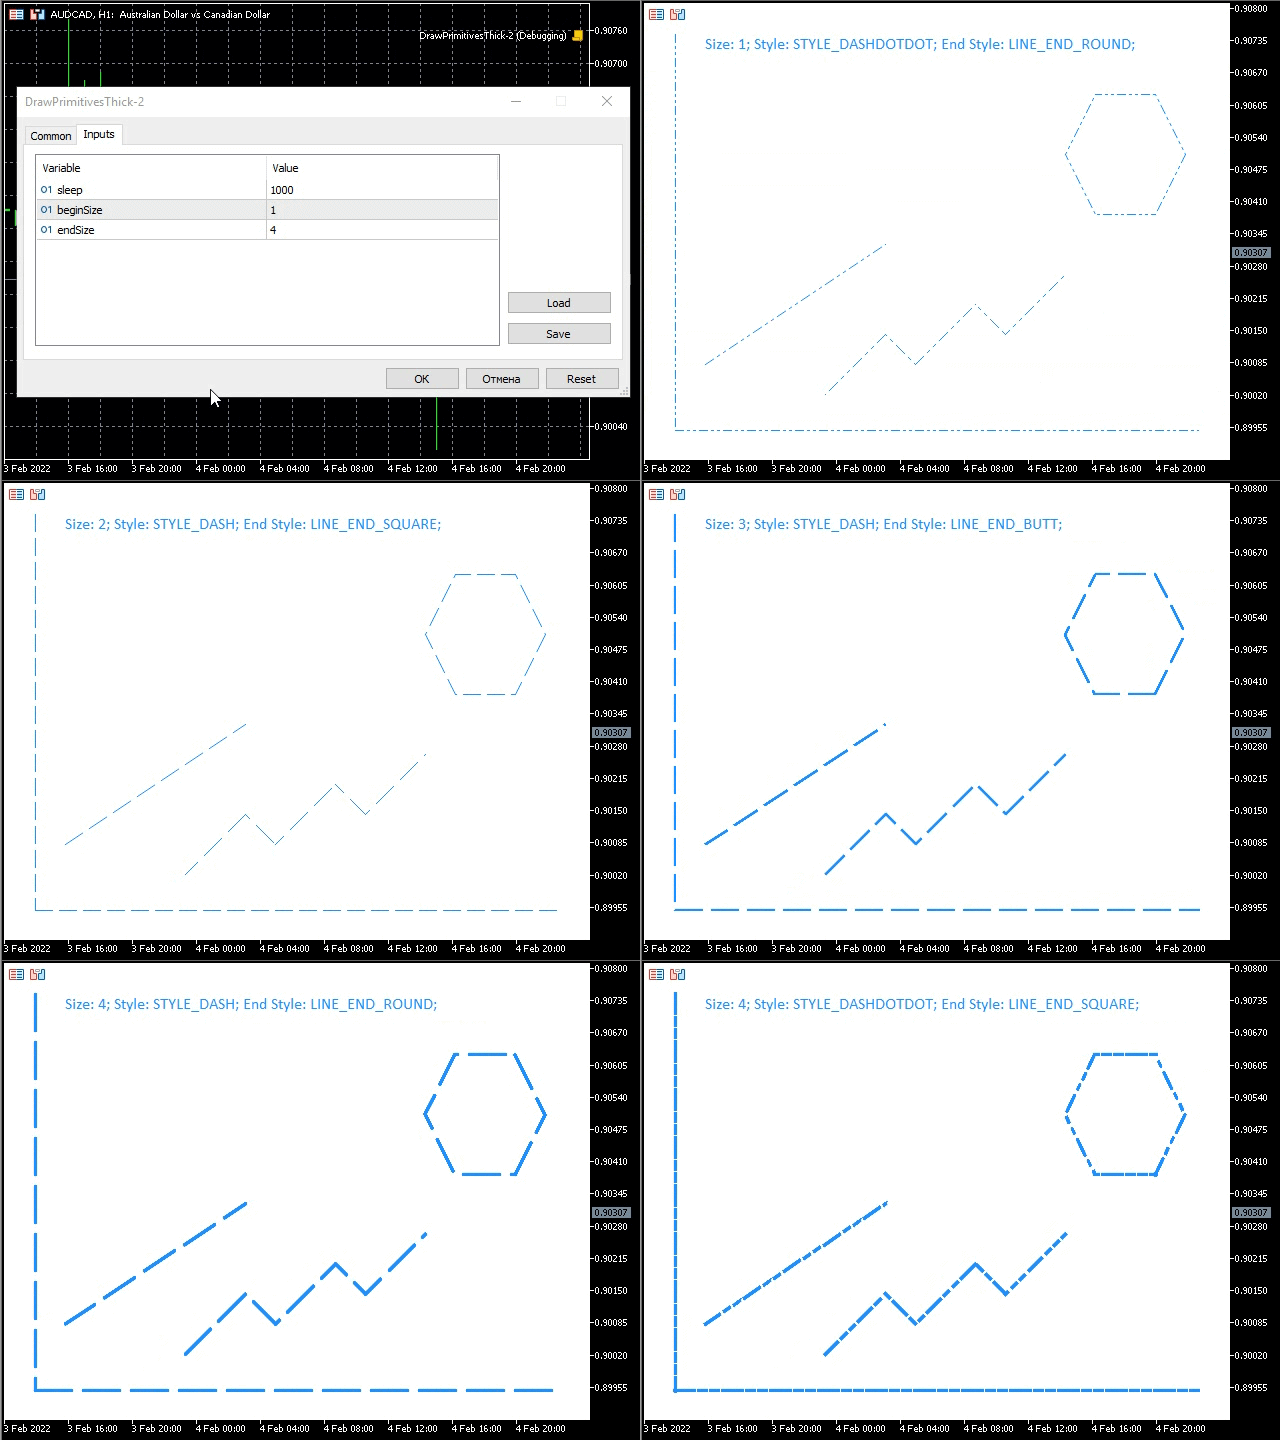
动画展示线条宽度、线条样式和线条完成样式的变化。 所有这些参数都显示在画布上,我们也可以看到它们。
根据可变线宽的 Bézier 算法绘制平滑图元
我们借用前面的一个示例 DrawPrimitivesThick.mq5,并在此基础上创建一个脚本 DrawPrimitivesSmooth.mq5。 将脚本中的 PolylineHick 和 PolygonThick 替换为 PolylineSmooth 和 PolygontSmooth。 将多段线和多边形的坐标向左移动二的平方,从而令图元大致显示在中心。
void OnStart()
 {
  CCanvas canvas;
  int w, h;
  int minSize, point;
  uint color_ = ColorToARGB(clrDodgerBlue, 255);
  uint fillColor = ColorToARGB(clrRed, 255);
  int plX[] = {3, 5, 6, 8, 9, 11}, plY[] = {13, 11, 12, 10, 11, 9};
  int pgX[] = {14, 15, 14, 12, 11, 12}, pgY[] = {7, 5, 3, 3, 5, 7};
清单中高亮显示了更改后的值。 得到的脚本应该如下所示。
#property script_show_inputs

//--- input parameters
input int sleep = 1000;

//+------------------------------------------------------------------+
//|                                                                  |
//+------------------------------------------------------------------+
#include <Canvas\Canvas.mqh>

//+------------------------------------------------------------------+
//|                                                                  |
//+------------------------------------------------------------------+
#define drawPrimitives canvas.Erase(ColorToARGB(clrWhite, 255));                                      \
  canvas.PolylineSmooth(plX, plY, color_, size, lineStyle, endStyle);                                 \
  canvas.PolygonSmooth(pgX, pgY, color_, size, lineStyle, endStyle);                                  \
  canvas.Update(true);                                                                                \
  Sleep(sleep);

//+------------------------------------------------------------------+
//| Script program start function                                    |
//+------------------------------------------------------------------+
void OnStart()
 {
  CCanvas canvas;
  int w, h;
  int minSize, point;
  uint color_ = ColorToARGB(clrDodgerBlue, 255);
  uint fillColor = ColorToARGB(clrRed, 255);
  int plX[] = {3, 5, 6, 8, 9, 11}, plY[] = {13, 11, 12, 10, 11, 9};
  int pgX[] = {14, 15, 14, 12, 11, 12}, pgY[] = {7, 5, 3, 3, 5, 7};
  ENUM_LINE_STYLE lineStyle = STYLE_SOLID;
  int size = 3;
  ENUM_LINE_END endStyle = LINE_END_BUTT;
  w = (int)ChartGetInteger(0, CHART_WIDTH_IN_PIXELS, 0);
  h = (int)ChartGetInteger(0, CHART_HEIGHT_IN_PIXELS, 0);
  minSize = (int)fmin(w, h);
  point = minSize / 15;
  canvas.CreateBitmapLabel("canvas", 0, 0, w, h, COLOR_FORMAT_XRGB_NOALPHA);

  for (int i = 0; i < (int)plX.Size(); i++)
    plX[i] *= point;
  for (int i = 0; i < (int)plY.Size(); i++)
    plY[i] *= point;
  for (int i = 0; i < (int)pgX.Size(); i++)
    pgX[i] *= point;
  for (int i = 0; i < (int)pgY.Size(); i++)
    pgY[i] *= point;

  canvas.LineStyleSet(STYLE_SOLID);
  drawPrimitives

  Sleep(6000);
  canvas.Destroy();
 }
运行示例,并检查结果。
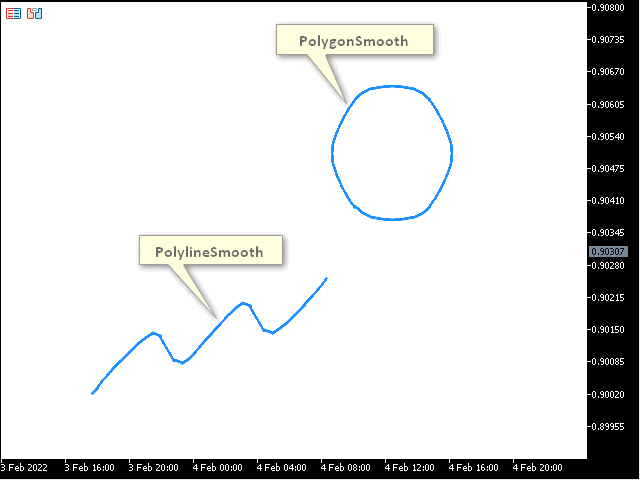
我们可以看到运用 Bézier 曲线构建的多段线和多边形。 PolylineSmooth 和 PolygonSmooth 方法提供了 tension参数 - 平滑和 step - 基于贝塞尔曲线近似步骤。 我们来创建一个示例,在这个示例中,这些参数在指定的时间间隔后变更,屏幕显示这些变更的结果。 我们基于 DrawPrimitivesThick-2.mq5 示例脚本,来创建 DrawPrimitivesSmooth-2.mq5。 我们看看结果。
#property script_show_inputs

//+------------------------------------------------------------------+
//|                                                                  |
//+------------------------------------------------------------------+
#include <Canvas\Canvas.mqh>

//--- input parameters
input int sleep = 1000;
input int lineSize = 3;
input ENUM_LINE_STYLE lineStyle = STYLE_SOLID;
input ENUM_LINE_END lineEndStyle = LINE_END_BUTT;
input double minTension = 0.0;
input double stepTension = 0.1;
input double maxTension = 1.0;
input double minStep = 1.0;
input double stepStep = 5.0;
input double maxStep = 21.0;

//+------------------------------------------------------------------+
//| Script program start function                                    |
//+------------------------------------------------------------------+
void OnStart()
 {
  CCanvas canvas;
  int w, h;
  int minSize, point;
  uint color_ = ColorToARGB(clrDodgerBlue, 255);
  uint fillColor = ColorToARGB(clrRed, 255);
  int plX[] = {3, 5, 6, 8, 9, 11}, plY[] = {13, 11, 12, 10, 11, 9};
  int pgX[] = {14, 15, 14, 12, 11, 12}, pgY[] = {7, 5, 3, 3, 5, 7};
  ENUM_LINE_STYLE style = lineStyle;
  int size = lineSize;
  ENUM_LINE_END endStyle = lineEndStyle;
  w = (int)ChartGetInteger(0, CHART_WIDTH_IN_PIXELS, 0);
  h = (int)ChartGetInteger(0, CHART_HEIGHT_IN_PIXELS, 0);
  minSize = (int)fmin(w, h);
  point = minSize / 15;
  canvas.CreateBitmapLabel("canvas", 0, 0, w, h, COLOR_FORMAT_XRGB_NOALPHA);
  canvas.FontSet("Calibri", -120);

  for (int i = 0; i < (int)plX.Size(); i++)
    plX[i] *= point;
  for (int i = 0; i < (int)plY.Size(); i++)
    plY[i] *= point;
  for (int i = 0; i < (int)pgX.Size(); i++)
    pgX[i] *= point;
  for (int i = 0; i < (int)pgY.Size(); i++)
    pgY[i] *= point;

  for (double tension = minTension; tension <= maxTension; tension += stepTension)
    for (double step = minStep; step <= maxStep; step += stepStep)
     {
       canvas.Erase(ColorToARGB(clrWhite, 255));
       canvas.PolylineSmooth(plX, plY, color_, size, style, endStyle, tension, step);
       canvas.PolygonSmooth(pgX, pgY, color_, size, style, endStyle, tension, step);
       canvas.TextOut(point * 2, point, "Size: " + (string)size + "; Style: " + EnumToString(style) + "; End Style: " + EnumToString(endStyle) + ";", color_);
       canvas.TextOut(point * 2, point * 2, "Tension: " + DoubleToString(tension, 2) + ";" + " Step: " + DoubleToString(step, 2) + ";", color_);
       canvas.Update(true);
       Sleep(sleep);
     }

  canvas.Destroy();
 }
正如我们所见,代码几乎完全改变了。 以下设置出现在输入参数中:lineSize - 线条宽度;lineStyle - 线条样式;和 lineEndStyle - 线条完成样式(现在它们不参与循环)。 此外,还有用于设置 Bézier 曲线绘制参数的输入参数:minTension、maxTension 和 stepTension(tension 平滑参数范围和数值步长),以及 minStep、maxStep 和 stepStep(step 近似步长范围和数值步长)。 此外,这些参数还在循环中起作用,根据指定的 stepTension 和 stepStep,相应地设置所有可能的 tension 和 step 参数组合。 运行示例并查看结果。
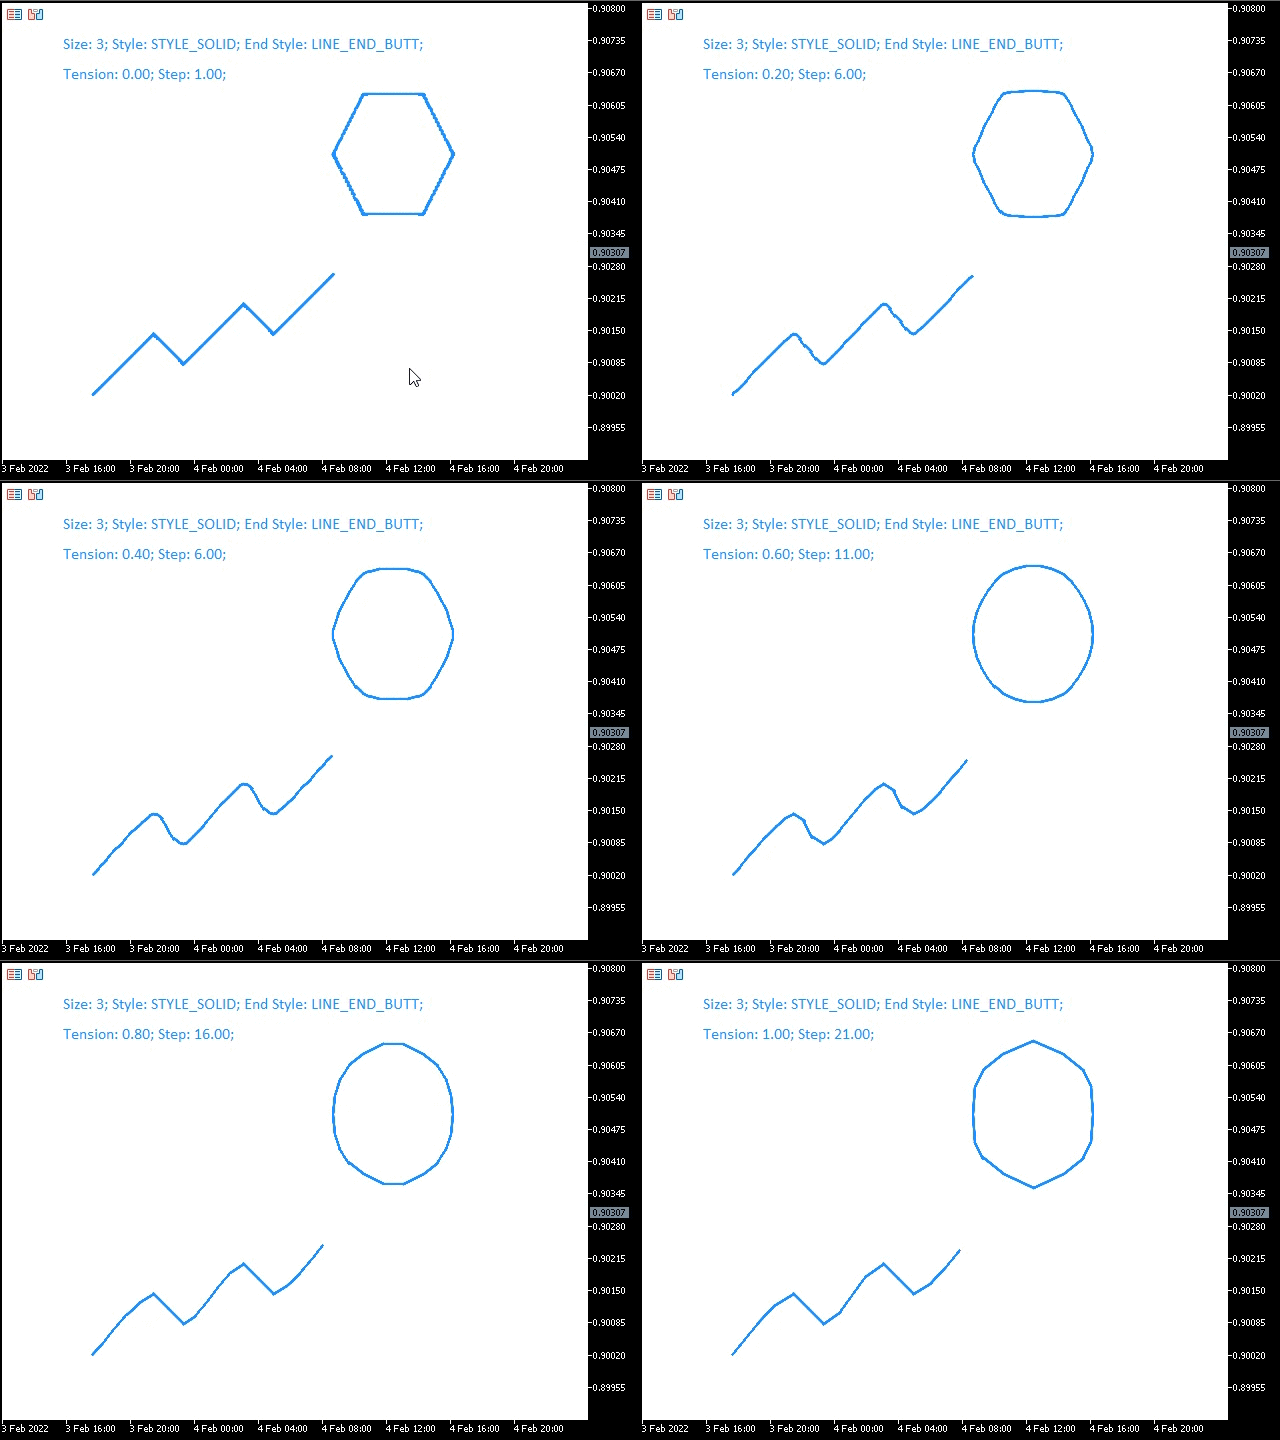
GIF 动画展示拥有可变平滑参数的平滑图元,其值在图像的第二行中显示。
绘制填充图元
在开发图形应用程序时,可能需要填充图元。 CCanvas 类的特性是,对于这种情况,方法的前缀为 Fill。 这些方法以统一的颜色绘制相应的图元。 我们基于上一个示例 DrawPrimitivesWu.mq5 创建脚本DrawPrimitivesFill.mq5,图元拥有所有必要的坐标,因此我们只需插入相应的方法,并设置填充颜色。 插入 FillPolygon、FillTriangle、FillCircle 和 FillEllipse 方法。 Fill 方法如下所述(考虑到正在填充)。 我们来看看结果代码。
void OnStart()
 {
  CCanvas canvas;
  int w, h;
  int minSize, point;
  uint fillColor = ColorToARGB(clrRed, 255);
  int pgX[] = {4, 5, 7, 8, 7, 5}, pgY[] = {12, 10, 10, 12, 14, 14};
  w = (int)ChartGetInteger(0, CHART_WIDTH_IN_PIXELS, 0);
  h = (int)ChartGetInteger(0, CHART_HEIGHT_IN_PIXELS, 0);
  minSize = (int)fmin(w, h);
  point = minSize / 15;
  canvas.CreateBitmapLabel("canvas", 0, 0, w, h, COLOR_FORMAT_XRGB_NOALPHA);

  for (int i = 0; i < (int)pgX.Size(); i++)
    pgX[i] *= point;
  for (int i = 0; i < (int)pgY.Size(); i++)
    pgY[i] *= point;

  canvas.Erase(ColorToARGB(clrWhite, 255));
  canvas.FillPolygon(pgX, pgY, fillColor);
  canvas.FillTriangle(point * 4, point * 8, point * 4, point * 3, point * 9, point * 3, fillColor);
  canvas.FillCircle(point * 13, point * 12, point * 2, fillColor);
  canvas.FillEllipse(point * 11, point * 3, point * 15, point * 6, fillColor);
  canvas.Update(true);

  Sleep(6000);
  canvas.Destroy();
 }
所有更改和添加的代码都以黄色高亮显示。 启动脚本来查看结果。
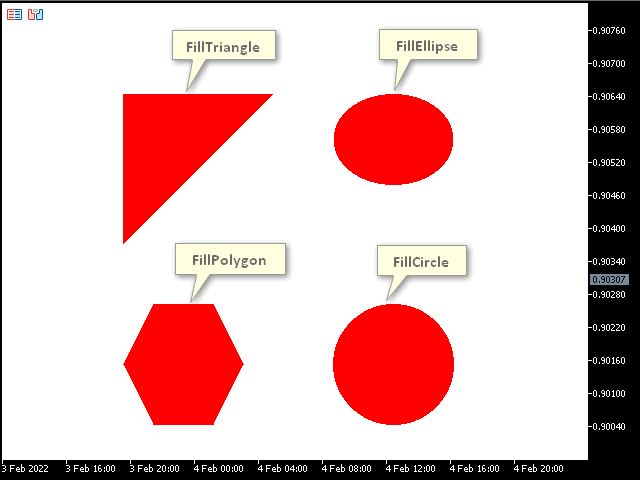
该图像显示以统一颜色填充图元。 在它们上面,我们可以绘制普通的图元作为边框,也可以绘制拥有上述可编辑线条样式的图元。
填充
如果您曾经在图形编辑器中使用过填充工具,您可能已经知道我要说什么了。 是时候看看我上面提到的 Fill 方法了。 该方法允许我们用另一种颜色填充特定区域的图像。 我们创建一个新的示例作为指标(因为与脚本对比,它能处理图表事件 OnChartEvent)。 您可能会问,为什么我们需要在这里处理图表事件? 我们将创建一个示例,允许您选择填充颜色,并在任何图像上单击,然后用所选颜色填充。 创建一个新指标,并将其命名为 Filling.mq5。 我们看看指标的代码。
#property indicator_chart_window
#property indicator_plots 0

//+------------------------------------------------------------------+
//|                                                                  |
//+------------------------------------------------------------------+
#include <Canvas\Canvas.mqh>
#include <ChartObjects\ChartObjectsTxtControls.mqh>

//+------------------------------------------------------------------+
//|                                                                  |
//+------------------------------------------------------------------+
CCanvas canvas;
CChartObjectButton colors[14];
CChartObjectButton * oldSelected = NULL;
uint fillColor = 0;

//+------------------------------------------------------------------+
//| Custom indicator initialization function                         |
//+------------------------------------------------------------------+
int OnInit()
 {
  int w, h;
  int minSize, point;
  uint Color1 = ColorToARGB(clrDodgerBlue, 255);
  uint Color2 = ColorToARGB(clrRed, 255);
  int pgX[] = {4, 5, 7, 8, 7, 5}, pgY[] = {12, 10, 10, 12, 14, 14};
  w = (int)ChartGetInteger(0, CHART_WIDTH_IN_PIXELS, 0);
  h = (int)ChartGetInteger(0, CHART_HEIGHT_IN_PIXELS, 0);
  minSize = (int)fmin(w, h);
  point = minSize / 15;

  canvas.CreateBitmapLabel("canvas", 0, 0, w, h, COLOR_FORMAT_XRGB_NOALPHA);

  canvas.FontSet("Calibri", -120);

  for (int i = 0; i < (int)pgX.Size(); i++)
    pgX[i] *= point;
  for (int i = 0; i < (int)pgY.Size(); i++)
    pgY[i] *= point;

  canvas.Erase(ColorToARGB(clrWhite, 255));
  canvas.Polygon(pgX, pgY, Color1);
  canvas.FillTriangle(point * 4, point * 8, point * 4, point * 3, point * 9, point * 3, Color2);
  canvas.FillCircle(point * 13, point * 12, point * 2, Color2);
  canvas.Ellipse(point * 11, point * 3, point * 15, point * 6, Color1);
  canvas.Update(true);

  ChartSetInteger(0, CHART_EVENT_MOUSE_MOVE, true);

  for (int i = 0; i < (int)colors.Size(); i++)
   {
    colors[i].Create(0, "color-"+(string)i, 0, (int)((i + 2.8) * point), point, 21, 21);
    colors[i].SetInteger(OBJPROP_BGCOLOR, ColorToARGB(CCanvas::GetDefaultColor(i), 0));
   }

  if ((oldSelected = GetPointer(colors[(int)colors.Size()-1])) == NULL)
    return(INIT_FAILED);
  oldSelected.State(1);
  fillColor = ColorToARGB((color)oldSelected.GetInteger(OBJPROP_BGCOLOR), 255);

  return(INIT_SUCCEEDED);
 }

//+------------------------------------------------------------------+
//| Custom indicator deinitialization function                       |
//+------------------------------------------------------------------+
void OnDeinit(const int reason)
 {
  canvas.Destroy();
 }

//+------------------------------------------------------------------+
//| Custom indicator iteration function                              |
//+------------------------------------------------------------------+
int OnCalculate(const int rates_total,
                const int prev_calculated,
                const int begin,
                const double &price[])
 {
//---
//--- return value of prev_calculated for next call
  return(rates_total);
 }
//+------------------------------------------------------------------+
//| ChartEvent function                                              |
//+------------------------------------------------------------------+
void OnChartEvent(const int id,
                  const long &lparam,
                  const double &dparam,
                  const string &sparam)
 {
  uint mouseState = (uint)sparam;
  int x = (int)lparam, y = (int)dparam;
  CChartObjectButton * colorBtn;
  int left, right, bottom, top;

  if (id == CHARTEVENT_MOUSE_MOVE)
    if ((mouseState & 1) == 1)
     {
      for (int i = 0; i < (int)colors.Size(); i++)
       {
        if ((colorBtn = GetPointer(colors[i])) == NULL)
          return;
        left = colorBtn.X_Distance();
        top = colorBtn.Y_Distance();
        right = left + colorBtn.X_Size() - 1;
        bottom = top + colorBtn.Y_Size() - 1;
        if (x >= left && x <= right && y >= top && y <= bottom) {
          fillColor = ColorToARGB((color)colorBtn.GetInteger(OBJPROP_BGCOLOR), 255);
          if (oldSelected == NULL)
            return;
          oldSelected.State(0);
          oldSelected = GetPointer(colorBtn);
          ChartRedraw();
          return;
        }
       }
      canvas.Fill(x, y, fillColor);
      canvas.Update(true);
     }

 }
这个示例是如何工作的? 首先,在全局级别上指定了 canvas 变量,从而能在整个指标操作期间访问它。
CCanvas canvas;
14 个按钮组成的数组允许选择颜色。 按下其中一个按钮可定义填充颜色。
CChartObjectButton colors[14]; 接下来,声明了 oldSelected 指针。
CChartObjectButton * oldSelected = NULL; 以下参数用于保存按压的按钮,将其返回到起始位置、或保存填充颜色。
uint fillColor = 0;
接下来,在 OnInit 处理程序中,我们可以看到已经很熟悉的代码,它创建画布,并在画布上绘制图元。
int OnInit()
 {
  int w, h;
  int minSize, point;
  uint Color1 = ColorToARGB(clrDodgerBlue, 255);
  uint Color2 = ColorToARGB(clrRed, 255);
  int pgX[] = {4, 5, 7, 8, 7, 5}, pgY[] = {12, 10, 10, 12, 14, 14};
  w = (int)ChartGetInteger(0, CHART_WIDTH_IN_PIXELS, 0);
  h = (int)ChartGetInteger(0, CHART_HEIGHT_IN_PIXELS, 0);
  minSize = (int)fmin(w, h);
  point = minSize / 15;
  canvas.CreateBitmapLabel("canvas", 0, 0, w, h, COLOR_FORMAT_XRGB_NOALPHA);

  canvas.FontSet("Calibri", -120);

  for (int i = 0; i < (int)pgX.Size(); i++)
    pgX[i] *= point;
  for (int i = 0; i < (int)pgY.Size(); i++)
    pgY[i] *= point;

  canvas.Erase(ColorToARGB(clrWhite, 255));
  canvas.Polygon(pgX, pgY, Color1);
  canvas.FillTriangle(point * 4, point * 8, point * 4, point * 3, point * 9, point * 3, Color2);
  canvas.FillCircle(point * 13, point * 12, point * 2, Color2);
  canvas.Ellipse(point * 11, point * 3, point * 15, point * 6, Color1);
  canvas.Update(true);
...
之后,启用处理鼠标事件。
ChartSetInteger(0, CHART_EVENT_MOUSE_MOVE, true);
接下来,创建不同颜色的按钮(以便选择填充颜色)。
  for (int i = 0; i < (int)colors.Size(); i++)
   {
    colors[i].Create(0, "color-"+(string)i, 0, (int)((i + 2.8) * point), point, 21, 21);
    colors[i].SetInteger(OBJPROP_BGCOLOR, ColorToARGB(CCanvas::GetDefaultColor(i), 0));
   }
注意按钮颜色的来源。 代码片段以黄色高亮显示。 我们可以看到 CCanvas::GetDefaultColor 统计方法。 通过从 0 开始设置 i 参数,我们可以获得调色板。
下一步,我们初始化获取 oldSelected 按钮的连接,复位到起始位置。
  if ((oldSelected = GetPointer(colors[(int)colors.Size()-1])) == NULL)
    return(INIT_FAILED);
  oldSelected.State(1);
初始化 fillColor 填充颜色。
fillColor = ColorToARGB((color)oldSelected.GetInteger(OBJPROP_BGCOLOR), 255);
下一步,在 OnChartEvent 中处理图表事件。 其中声明了用于接收和存储鼠标参数的变量。
void OnChartEvent(const int id,
                  const long &lparam,
                  const double &dparam,
                  const string &sparam)
 {
  uint mouseState = (uint)sparam;
  int x = (int)lparam, y = (int)dparam;
...
接下来,声明存储按下按钮的指针变量,
CChartObjectButton * colorBtn;
其定义是依据单击鼠标左键时,位于光标输入处按钮边缘的坐标。 边侧坐标存储在以下变量之中。
int left, right, bottom, top; 接下来,跟踪 CHARTEVENT_MOUSE_MOVE 事件,以及单击鼠标左键。
  if (id == CHARTEVENT_MOUSE_MOVE)
    if ((mouseState & 1) == 1)
     {
      ...
     }
这段代码,就是执行颜色选择和图像填充。 在此,循环检测用户按下的按钮,逐一遍历 colors 数组,并于所传递按钮比较,将按钮选择的颜色保存到 fillColor 变量,并将之前按下的按钮 oldSelected 复位到起始位置。 接下来,我们退出处理程序(return),因为点击的是颜色选择按钮,而不是要填充的图像。 如果点击图像,而不是点击颜色按钮之一,则控制会进一步传递,并调用 Fill 方法和选定的 fillColor 颜色,顺序更新图像(Update 方法)执行填充。
  if (id == CHARTEVENT_MOUSE_MOVE)
    if ((mouseState & 1) == 1)
     {
      for (int i = 0; i < (int)colors.Size(); i++)
       {
        if ((colorBtn = GetPointer(colors[i])) == NULL)
          return;
        left = colorBtn.X_Distance();
        top = colorBtn.Y_Distance();
        right = left + colorBtn.X_Size() - 1;
        bottom = top + colorBtn.Y_Size() - 1;
        if (x >= left && x <= right && y >= top && y <= bottom) {
          fillColor = ColorToARGB((color)colorBtn.GetInteger(OBJPROP_BGCOLOR), 255);
          if (oldSelected == NULL)
            return;
          oldSelected.State(0);
          oldSelected = GetPointer(colorBtn);
          ChartRedraw();
          return;
        }
       }
      canvas.Fill(x, y, fillColor);
      canvas.Update(true);
     }
我们运行生成的示例,并尝试执行填充。
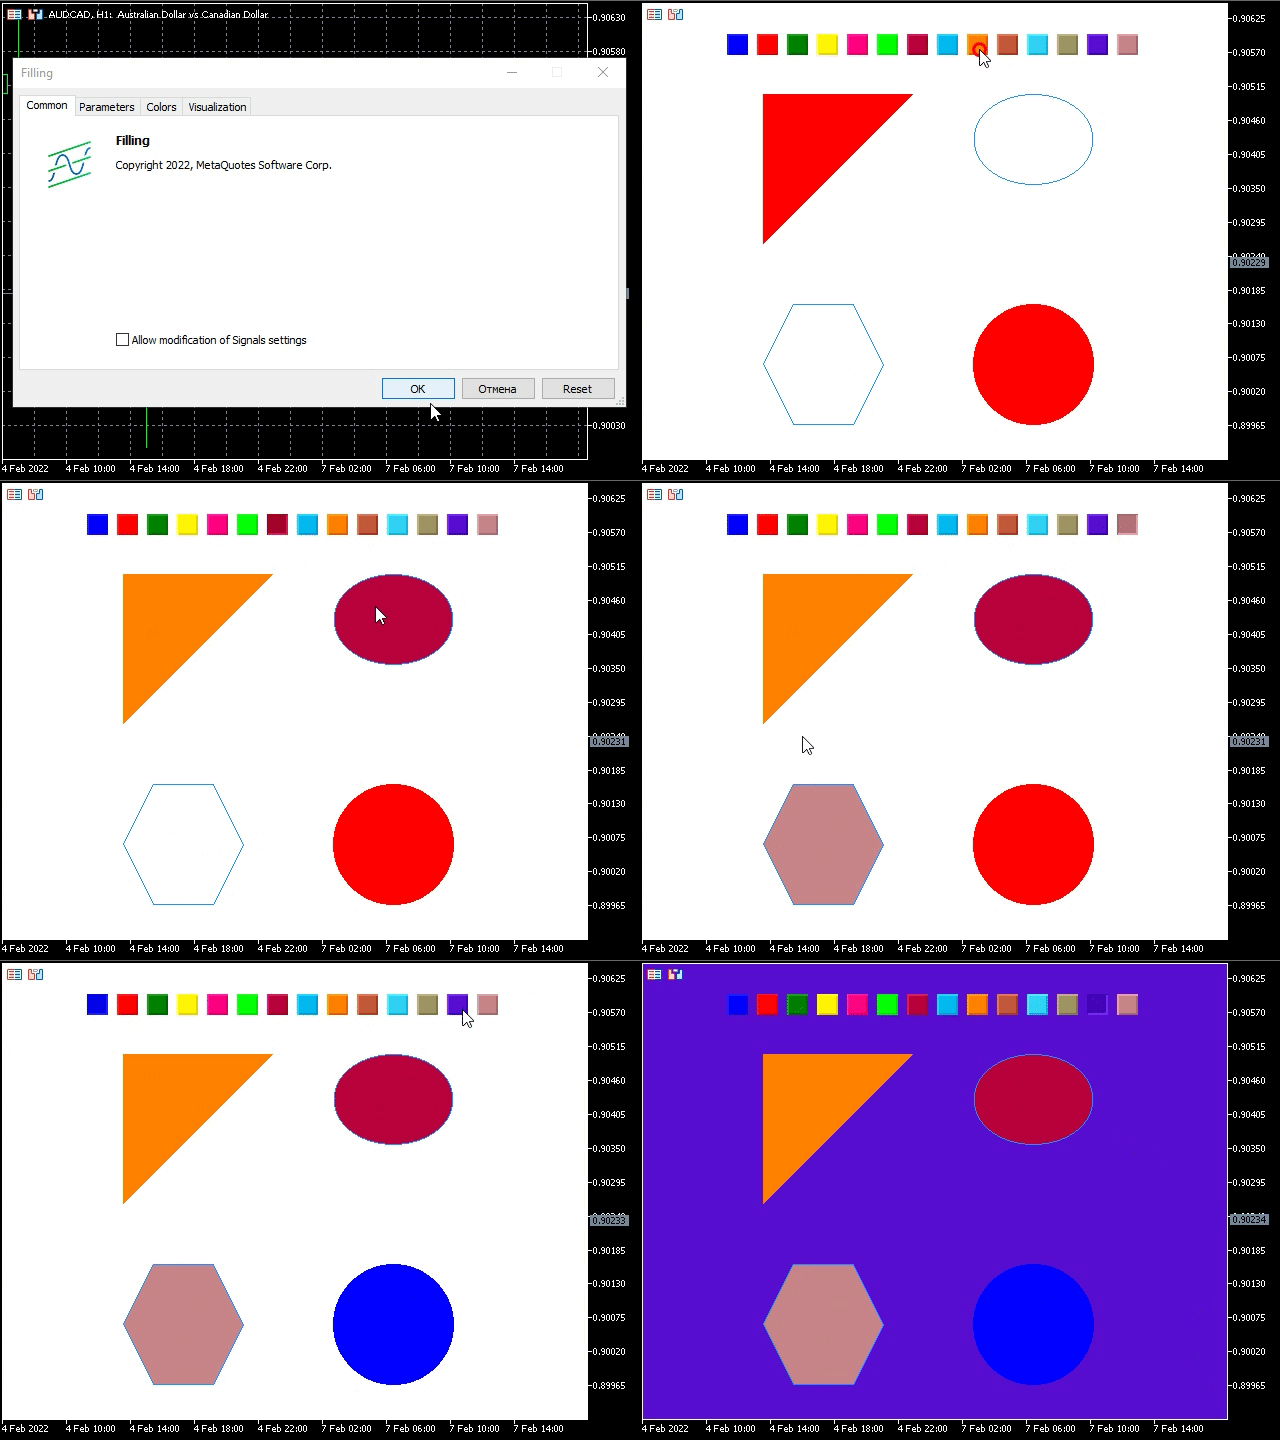
根据 GIF 动画,我们运用 CCanvas,创建了与图形编辑器中的填充工具类似的 Fill 工具。
结束语
本文探讨了 CCanvas 类,并讲述了其方法,以便用户能充分了解该类的操作原理。 所提供的示例解释了处理 CCanvas 类的原则,同时澄清了一些难以掌握的理论知识。
本文由MetaQuotes Ltd译自俄文
原文地址: https://www.mql5.com/ru/articles/10361
注意: MetaQuotes Ltd.将保留所有关于这些材料的权利。全部或部分复制或者转载这些材料将被禁止。
本文由网站的一位用户撰写,反映了他们的个人观点。MetaQuotes Ltd 不对所提供信息的准确性负责,也不对因使用所述解决方案、策略或建议而产生的任何后果负责。
 学习如何设计一款布林带(Bollinger Bands)交易系统
 MVC 设计范式及其应用(第 2 部分):三个组件之间相互作用示意图
 在一张图表上的多个指标(第 01 部分):理解概念

感谢您分享这篇文章!我想了解更多有关画布的信息,我有很多项目 要 做!
致敬