YouTube'dan Mağaza ile ilgili eğitici videoları izleyin
Bir ticaret robotu veya gösterge nasıl satın alınır?
Uzman Danışmanınızı
sanal sunucuda çalıştırın
sanal sunucuda çalıştırın
Satın almadan önce göstergeyi/ticaret robotunu test edin
Mağazada kazanç sağlamak ister misiniz?
Satış için bir ürün nasıl sunulur?
MetaTrader 5 için Uzman Danışmanlar ve göstergeler - 45

This utility provides the ability to use hot keys in manual trading instantly responding to the current market situation. You can assign hot keys to open/close positions by their type, open/close all positions on the current chart and remove all orders on the current chart. You can also assign hot keys for five predefined trade volumes and switch between them if necessary with no need to change the volume manually from time to time. It is also possible to set the auto calculation of a trade volu

50% off. Original price: $60 Triangle Finder is a multi symbol multi timeframe dashboard that finds symmetrical triangle pattern in 28 symbols and 9 timeframes with a deep scan feature to scan all market watch symbols (up to 1000 instruments!).
Download Demo here (Scans only M1, M5 and M10) Settings description here MT4 version here
Triangle Finder features: Realtime monitoring of 28 customizable instruments and 9 timeframes at the same time. Deep scan mode to scan all market watch sym
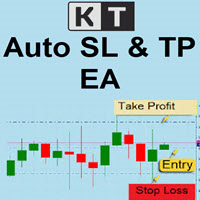
KT Auto SL TP automatically sets the stop-loss and take-profit as soon as it detects manually placed orders on the chart. It can effortlessly place the stop-loss and take profit for the market, limit and stop orders simultaneously.
Features
It can set the stop-loss and take-profit for all the active symbols from a single chart. Equipped with trailing stop-loss with steps. Seamlessly works for the market and pending orders. Shows the informational text information on the chart.
Inputs Cur

Gamma Bands This indcator shows the trend with the color histogram. It is simple and easy to use. Usage: If the histogram changes from the aqua to the fuchsia, which means the trend is up. If the histogram changes from the fuchsia to the aqua,which means the trend is down. Inputs: MaPeriods: the periods of moving average. f1: the multiplier of inner bands f2: the multiplier of outer bands Popup Window Alert Email Alert Mobile Push Alert Alerts When the trend changes for the long trend to the

KT Auto Fibo draws Fibonacci retracement levels based on the ongoing trend direction. The Highs and Lows are automatically selected using the Maximum and Minimum points available on the chart. You can zoom in/out and scroll to adjust the Fibonacci levels accordingly.
Modes
Auto: It draws the Fibonacci levels automatically based on the chart area. Manual: It draws the Fibonacci levels only one time. After that, you can change the anchor points manually.
Usage: Helps to predict the future p

This indicator accurately identifies and informs market reversals and continuation patterns by analyzing and signaling the Three White Soldiers / Three Black Crows pattern. It also offers a "real-time backtesting" panel in the indicator itself in a way that every change made on the indicator parameters will immediately show the user how many signals are occurred, how many take profits and stop losses were hit and, by having these informations, the Win Rate and the Profit Factor of the setup b

Functional in the Forex market. Functional on the B3 market - Bolsa Brasil Balcão. Motivation The Price Guide indicator is a tool that helps you insert support and resistance points at the chosen price and in the quantity you want, it depends on the agility of its configuration. This FULL version will work in Meta Trader 5 on all accounts and Strategy Tester . To test on the DEMO account , download the free version at: https://www.mql5.com/pt/market/product/111620 Operation The method

Highly configurable Average True Range (ATR) indicator.
Features: Highly customizable alert functions (at levels, crosses, direction changes via email, push, sound, popup) Multi timeframe ability Color customization (at levels, crosses, direction changes) Linear interpolation and histogram mode options Works on strategy tester in multi timeframe mode (at weekend without ticks also) Adjustable Levels Parameters:
ATR Timeframe: You can set the lower/higher timeframes for ATR. ATR Bar Shift: y
FREE

Треугольным арбитражем называют одновременно открытие ордеров по трем валютным парам. Направление сделок и пары выбираются таким образом, чтобы одновременно открытые позиции страховали друг друга. За счет этого можно открываться достаточно большими лотами, и риск невелик. Варианты треугольников:
EURUSD – USDJPY – EURJPY Ордера, входящие в состав такого треугольника находятся в постоянном движении. Советник анализирует реальные цены на данный момент и просчитывает какими они должны быть. При ра
FREE

The latest upgrade of the robot is version 1.19. The list of currency pairs and two set files can be found inside the ZIP file in the comments section. If you want to explore what your own list of the best currency pairs would be, simply run the strategy tester with default settings and test the robot on all available symbols in the Market Watch. Whether this robot will meet your expectations, is hard to say. It depends on how it is used. I would also like to emphasize that a VPS service is ne

这是一个组合指标分析趋势、支撑阻力、买卖点。运用了均线MA、布林带、KDJ、CCI、RSI。 主图上下线是布林带上下线,采用的是20周期和2.3标准差可以用来支撑阻力。 中间的是分析趋势的均线,趋势分析是用均线多周期: 为涨趋势,反之为下跌趋势。在同一种颜色,基本说明趋势没有发生变化。 子图是由 KDJ、CCI、RSI三个指标组成,大于70超买,小于30超卖, 智能提示是运用了算法,主要计算布林带, KDJ、CCI、RSI指标
有三个或四个指标超出市场常态就会发出提示行情可能反转。 子图指标运用了很多数据,刚刚开始加载会有点慢,耐心等待就可以 这个指标是主图指标,还要再下我发布的RCD分析,这样就刚刚好组成一套分析 电脑分辨率的文本大小请设置100%,不然字体会不一样
FREE

Introduction to the Candle Time Indicator The Candle Time Indicator for MetaTrader 5, helps users know how much time on a candlestick is remaining.
Overview of Candle Time Indicator settings. TextColor: set the color of the countdown clock; FontSize: set the size of the font; Installation Guide Copy and paste the CandleTime.ex5 indicator files into the MQL5 folder of the Metatrader 5 trading platform. You can gain access to this folder by clicking the top menu options, that goes as follows: Fi
FREE
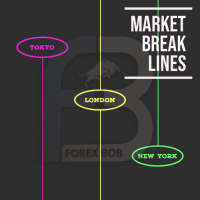
Market Break Lines is an utility tool to create a partition line at market openings/closings of Tokyo/London/NewYork sessions. This will help you to compare the market movements, volatility variations between the different markets.
Inputs: Inputs are simple to feed the time of Tokyo/London/NewYork sessions as per your broker server time Change Color and width of partition lines You can enable or disable any line (Hide/Show).
Please don't forget to support by giving handsome reviews/rating
FREE

This EA use Moving Average crossover Hedging Buy/Sell + Grid strategy. This EA can make 100% profit in 2022 and 2023 from backtesting.
Supported any currency pairs: EURUSD is recommended
Recommended timeframe: H1 Features: Solid backtest and live performance
No need to adjust GMT
Very easy to use: just read 3 lines of instructions below How to install The EA must be attached to ONLY on H1 chart If your broker uses a suffix (e.g. EURUSD.c) you should update names in the

Moving Average Trend Scanner is a multi symbol multi timeframe triple MA crossover dashboard that helps traders to monitor, and identify potential market trends from one chart. This panel scans 3 moving averages in up to 28 configurable instruments and 9 timeframes for triple moving average alignment and moving average crossover with a deep scan feature to scan all market watch symbols (up to 1000 instruments!).
Download Demo here (Scans only M1 and M6) Settings description here MT4 v

Au79 is a powerful trading robot designed to help you profit from the XAUUSD market on the H4 timeframe. Using a sophisticated algorithm and advanced indicators, Au79 is optimized to deliver consistent and reliable results over time. Our backtesting and optimization process has been rigorous, testing the EA from January 1, 2019, to March 30, 2023, using real ticks with a history quality of 99%. This ensures that the EA performs well in a range of market conditions, and that its results are accur
FREE

Wizard Poverty Sanitizer is a moving average based indicator, using three EMA'S being 2OO EMA which is the slow EMA, the 21 EMA which is the median and the 10 EMA which is the fast. When the median and the fast EMA cross a signal is given, when the fast EMA goes above the Median EMA a buying signal is given and when the fast cross below the median a selling is given. Note that you can change the moving averages to you own choices of moving averages, allowing you to set your own MA strategy. a
FREE

InsideBarStop Indicator for MT5
This indicator can be used to show and evaluate the trailing stop algorithm "Trailing Stop with Inside Bars" that was proposed by the famous German trader and author Michael Voigt ("Das grosse Buch der Markttechnik") to capture robust gains when trading strong price moves. The trailing stop price is shown as a red line. You can start the trailing stop anywhere on your chart (bars or candles) by setting the "initialBarDateTime" input parameter to the open time of
FREE

A simple price action indicator to highlight inside and outside bars (candles) with colors. It is possible to choose what type of bar can be highlighted among: inside, ouside or both. It is can be possible to choose a first specific color for the shadow and the border of bars (candles), a second specific color for high/bull bar (candle) and a third specific color for down/bear bar (candle)
FREE

This is a customizable three moving averages indicator useful in crossover trading technique. Yo can set various parameters such as calculation methods (exponential, simple, etc.), period and price type for each MA separately from one input dialog.
Parameters: Period <1,2,3> - Period of a moving average Shift <1,2,3> - Shift of a moving average Method <1,2,3> - Method of calculation for each moving average set separately Applied Price <1,2,3> - Set price type for calculations for each movi
FREE

Seviye Asistan ı, destek ve direnç seviyelerini manuel olarak ayarlamak için uzman bir yardımcıdır.
Tüccarlar genellikle kendi seviyelerini oluştururlar. Farklı dönemlere ait birçok çizelge varsa, seviye tüm çizelgelerle çarpılacaktır.
Bir grafiğe yatay bir çizgi yerleştirirken, Asistan bu çizgiyi bir seviyeye dönüştürmeyi önerir. Aynı zamanda, enstrümanın süresine ve fiyata göre nerede olduğuna bağlı olarak çizginin rengini ve kalınlığını kendisi belirleyecektir. Seviyeyi bir yazıtla işare
FREE

Simple Trading Panel is a manual tool for safe trading. Monitored by the mentor and indicators. This panel has many useful settings to take your trading to the next level.
Simple Trading Panel offers features:
Adjustable stop loss, take profit, volume, trailing stop with profit in percent, risk ratio, news filter and much more.
The $50 price remains forever! Manual link Installation Guide link Transfers and payment methods link Link to the chat group here After purchasing the product, sen
FREE

In the SM Trend Cloud indicator, two buffers are used for calculation and rendering. One of the main advantages of this tool is its simplicity, while its signals can be quite accurate. But, again, we have a trend indicator in front of us, and therefore it will generate false signals mainly in conditions of consolidation. At the same time, I do not advise using the indicator in its own form, there is no way to do without additional filters. As an additional signal, I suggest using ZigZag indicat
FREE

This is my version of Currency Strength Meter.
One of the best indicators for spotting weak and strong currencies. Based on the information obtained, its very simple to decide which currency buy and which sell.
It is very simple to use, but extremely effective.
General rules are: - Buy currencies above level 0
- Sell currencies below level 0
You can also mix the main currencies together -->
EURUSD > 0 and USDJPY < 0 --> BUY on EURJPY
FREE

Candle size oscillator is an easy to use tool to figure out candle size from highest to lowest price of each candle. It's a powerful tool for price action analysts specifically for those who works intraday charts and also a perfect tool for short term swing traders. Kindly note that you can also edit the Bullish and Bearish candles with different colors.
#Tags: Candle size, oscillator, price action, price range, high to low, candle ticks _________________________________________________________
FREE

This EA trades according to your trendline. It can trade in several modes: will open only one trade and then be stopped trades only in the direction of the trendline opens more trades after each touch with the trendline trades in both directions it can place a pending order or open a market order See the screenshots below for a better understanding of its features.
Unfortunately, it is not possible to draw your own trend line in the MT5 strategy tester. This EA will draw its own trendline for
Merhaba yatırımcılar, bu aracı gerçek sonuçlarla titizlikle tasarladım, araç önceki Stratejilerimin birçoğunu temel aldı,
Tanrı RA'nın Koruyucu Tanrısı Seth, altının tanrısallığına meydan okuyor Yapay zeka ve altın modellerini analiz eden düğümler tarafından yapılandırılmış eksiksiz bir algoritma Yapay zeka ve makine öğrenimi ile desteklenen, altın hareketlerine dayalı yenilikçi bir strateji Altın kadar değişken bir piyasada, Yatırımlarımızın getirisini en üst düzeye çıkarmak için sağlam ve u

The Fibonacci indicator automatically displays the Fibonacci retracement levels, representing significant support and resistance. The range for calculating the indicator can be taken from the previous day, week, month, year or user-specified session.
Levels 100 % (High) of the range from the previous session. 0 % (Low) of the range from the previous session. 76,4 % of the range from the previous session. 61,8 % of the range from the previous session. 50 % of the range from the previo
FREE

The indicator is based on Robert Miner's methodology described in his book "High probability trading strategies" and displays signals along with momentum of 2 timeframes. A Stochastic oscillator is used as a momentum indicator.
The settings speak for themselves period_1 is the current timeframe, 'current' period_2 is indicated - the senior timeframe is 4 or 5 times larger than the current one. For example, if the current one is 5 minutes, then the older one will be 20 minutes The rest of the
FREE

Ticaretinizi bir sonraki seviyeye taşımaya hazır mısınız? WH Divergence Pro MT5 ile tanışın ,
çeşitli popüler teknik göstergeler arasından seçim yapmanızı sağlayan gelişmiş bir sapma göstergesi.
Artık sapma sinyallerinizi benzersiz ticaret stratejinize uyacak şekilde uyarlayabilirsiniz. Süreçler boyunca size rehberlik etmek için satın aldıktan sonra benimle iletişime geçin Ana Özellikler :
Gösterge Seçimi : Aşağıdaki seçenekler arasından tercih ettiğiniz göstergeyi seçin: RSI (G

For those who feel that regular RSI is too fast and too noisy to be used on regular trades or in EAs and want to have an alternative to meter the Momentum of the Price, here is a solution presented on the great article of the Technical Analysis of Stocks & Commodities magazine (April, 2015), by Vitali Apirine, called: Slow Relative Strenght Index . Its reading is almost the same as the regular RSI, but its levels of Overbought and Oversold are 80 and 20 instead. SRSI is very powerful to show div
FREE
Exact Time — detailed time on the seconds chart. The utility shows the opening time of the selected candle. This is necessary when working with seconds charts. For example, it can be used on a seconds chart built using the " Seconds Chart " utility, which helps to build seconds chart in the MT5 terminal. Use the CTRL key to turn on/off the time display on the chart.
FREE

FRB Candle Time
Indicator showing the time left for the next candle You can edit font color and size. Very important indicator for Traders. To move time, just click on it and move the mouse to where you want to leave it. After positioning the time where you want it, click again or press "ESC" and the time will stay where you left it.
Settings font color Font size Background color
FREE

Key Features: Robust Algorithm: Based on John F. Ehlers’ renowned Fisher Transform formula, our indicator excels in pinpointing major price shifts, facilitating more informed trading decisions. Versatile Application: Works seamlessly with any asset, including forex, stocks, commodities, and indices, offering wide-ranging applicability for diverse trading strategies. Customizable Settings: Tailor the indicator to your trading style with adjustable parameters, including the transformation length,
FREE

Versión Beta El indicador técnico Non Lag MA MTF (Non-Lagged Moving Average Multi-Time Frame) es una versión avanzada del Non Lag MA que permite visualizar la media móvil en varios marcos temporales simultáneamente. Pros: - Visión integral: Proporciona una visión más completa al mostrar la media móvil en diferentes marcos temporales en un solo gráfico. - Anticipación de tendencias: Ayuda a anticipar cambios de tendencia al observar la convergencia o divergencia de las medias móviles en distint
FREE

This indicator displays Point & Figure charts (PnF charts) in the indicator window. PnF charts show only price movements that are bigger than the specified box size. It helps to eliminate noise and allows focusing on main trends. Time is not a factor here. Only price movements are taken into account. That is why PnF chart is not synchronized with the main chart it is attached to. More about PnF charts: http://stockcharts.com/school/doku.php?id=chart_school:chart_analysis:pnf_charts Indicator wor
FREE

Black Friday PROMO launch My portfolio . I am giving this expert advisor for FREE.
The Expert Advisor has been developed by AI for Nikkei and M15 timeframe. There is no need to set up parameters, all settings are already optimized and fine-tuned. Recommended broker RoboForex because of EET timezone.
My recommendation is to have a look also at the rest of my products in the portfolio, as they work very well together in combination. Check other portfolio screenshots.
Dax Ai , Daw Ai , Niki A
FREE

Üstel Hareketli Ortalamalar (Çift veya Üçlü) Envelopes Göstergesi, finansal piyasada trendleri ve potansiyel ters dönme noktalarını belirlemede size yardımcı olmak için tasarlanmış bir teknik analiz aracıdır. Bu gösterge, tüccarlara iki tür üstel hareketli ortalama arasında seçim yapma esnekliği sunar: Çift Üstel Hareketli Ortalama (DEMA) veya Üçlü Üstel Hareketli Ortalama (TEMA).
Ana Özellikler:
- Çift veya Üçlü Üstel: Analiz tercihlerinize ve ihtiyaçlarınıza göre DEMA ve TEMA arasında ge
FREE

Price live on the Chart Description: The Real-Time Price Display is a powerful tool for MetaTrader 5 users that provides continuous updates of the current bid (SELL) and ask (BUY) prices directly on your trading chart. This script is ideal for traders who need to stay updated on market prices at a glance. Key Features: Live Price Updates : Displays the latest bid and ask prices for your selected trading symbol in real-time. Customizable Display : Adjust the horizontal and vertical position of th
FREE

Классический индикатор фракталов является запаздывающим, т.к. для подтверждения образования фрактала необходимо ждать 2 бара. Если этого избежать, то индикатор будет перерисовывающим, т.е. при обновлении максимума/минимума в течении 2-х баров фрактал будет менять своё положение на более позднее. В данном продукте максимально нивелированы оба этих недостатка, при этом совмещены достоинства обоих подходов! Индикатор показывает фрактал сразу в момент его образования, а в случае его обновления показ
FREE

The technical indicator Wave Vision measures the relative strength of the trend movements of the price from its average values over a certain time period. The histogram shows price movement strenght relative to the zero level line. Histogram values close to zero indicate the equality of forces between buyers and sellers. Above the zero level line - bullish trend (positive values of the bar chart). Below the zero level line - bearish trend (negative values of the bar chart).
Settings:
Smoo
FREE

This indicator is a very simple indicator that draws candlesticks on a chart. However, it is possible to draw not only on the main chart but also on several sub-charts. In addition,it is possible to draw different symbols and timeframes from the main chart. features. 1. any symbols 2. any timeframes 3. two candle type(normal and heikin ashi) 4. many candle colors(intersection with ma_1) 5. pivot line (ver1.2) In case of positive candle, FULL : change color if low is over ma_1 PARTIAL :
FREE

Trend based on Extremum Levels and Volatility göstergesi, yatırımcıların trend kırılma noktalarını ve farklı zaman dilimlerinde potansiyel kar alma seviyelerini belirlemelerine yardımcı olmak için tasarlanmış kullanışlı bir araçtır.
Gösterge forex, vadeli işlemler, hisse senetleri, endeksler, emtialar ve kripto para piyasalarında kullanılabilir.
Bu evrensel gösterge yerel ekstrema, volatilite ve ortalama fiyat sapmasına dayalı trendler oluşturarak hem küçük hem de büyük zaman dilimlerinde k

This is MT5 version Get Tunnel Warrens MT4 here
Here are several indicators that work together. It basically works with moving averages and various levels of ATR creating a dynamic channel through which the price is drained. As I always recommend, you should try it before using it in live so that you understand how it works. The market entry signal is similar to other MA indicators, but with this one you also have a graphical analysis of the moment when the trend is found and dynamic levels to
FREE

Introduction to GARCH Indicator GARCH is the short initial for Generalized Autoregressive Conditional Heteroskedasticity and it is the volatility prediction model commonly used in financial industry. GARCH model was first appeared in the work by Danish Economist, Tim Peter Bollerslev in 1986. The 2003 Nobel Prize winner, Robert F Engle also added much contribution for the refinement of GARCH model with Tim’s work. Our GARCH INM predictor took the original method of Nelder Mead for GARCH model bu
FREE

Positions panel
This is a panel for counting current icon holdings. Convenient traders at any time to view the position and profit and loss situation. Perfect for traders who like to hold multiple orders at the same time. Main functions: Position statistics Total profit Average price calculation TP price calculation ST price calculation Positions valume
FREE

1. The Expert Adviser is built with a basic, simple and stable breakout trading strategy with a touch of Price Action pattern that is highly effective with over 80% accurate entry on Scalping and Trend following trading pattern. 2. The EA created a good money management system with a low draw down and options for Number of Trades, Auto SL and Auto trade trailing.... 3. The EA has option to select trade direction (BUY ONLY, SELL ONLY OR BUY & SELL). 4. The EA has option to set TP in Pips or Mone
FREE

MT4 Version Available Here: https://www.mql5.com/en/market/product/43438
Telegram Channel & Group : https://t.me/bluedigitsfx
V.I.P Group Access: Send Payment Proof to our Inbox
Recommended Broker: https://eb4.app/BDFXOsprey
* Breakthrough Solution For Reversal Trading And Filtering With All Important Features Built Inside One Tool! BlueDigitsFx Spike And Strike Reversal is a mixed oscillator that mixes the readings of a number of indicators, which makes it potential to preci

The Schaff Trend Cycle Bot, developed by New Capital, utilizes the Schaff system to offer a competitive edge in financial markets. This free trading bot highlights our expertise in algorithmic trading. Key Features: Advanced Trading System: Uses the Schaff Trend Cycle for optimal trading performance. Accessibility: Empowers traders with advanced tools and user-friendly solutions. Educational Resources: Comprehensive tutorials and support for effective trading strategies.
FREE

At first, I got my teeth into Dragon Ultra Expert Advisor. This Lesson is “Awesome”. In fact, It’s probably one of my best trading lessons I have ever written.
It took me at least 2 days of brain power and probably 20 coffees. Please pay it forward, share it with others. Enjoy.
Bruce Lee was arguably the best martial artist of all time, and guess what? He was not born the best martial artist of all time.
He earned that title through dedication and focus…he learned to become a MASTER of
FREE

TransitGhost Signal indicator, this is one of my best forex trading strategy. The strategy is based on the simple moving average cross, 5 SMA AND 200 SMA of which take a longer time to cross. Whenever the is a cross between the 5 SMA and 200 SMA a signal will be given, when the 5 SMA cross the 200 SMA to the upside ,a buying arrow will appear on chart, and push notification(alert) "Buy now, use proper risk management" will be sent on both the MT5 PC and mobile app, and when the 5 SMA cross the 2
FREE

A comprehensive tool for determining the levels of support, resistance, reversals in relation to trading sessions. The indicator's thesis can be expressed as follows: "Support and resistance levels are undoubtedly formed by the psychological barriers of market participants, and influence the further behavior of the price. But these barriers are different for different groups of traders ( One man's meat is another man's poison ) and can be grouped by territory or by the trading time ". Follo
FREE

Attempts to recover losing trades.
If a trade moves in the wrong direction, the Zone Recovery algorithm begins.
An alternating series of Buy and Sell trades at two specific levels take place, with two Exit Points above and beyond these levels.
Once either of the two exit points is reached, all trades close with a combined profit or break even.
To use
1) Place the EA on a chart and select how the first trade will open (Manual/Via EA strategy/Use EA panel/External EA)
2) Configure your r

RSI ALARM (For Metatrader 5)
This indicator works like a normal RSI with all its settings (Periodicity, colors, levels, etc),
but additionally, alarms can be set at the upper and lower level (Example 70 and 30), with the possibility of adjusting these levels by moving the blue and red lines to establish the upper and lower levels.
You can also turn on and off an additional function that creates an arrow on the chart when the expected upper or lower RSI is met.

The indicator plots two lines by High and Low prices. The lines comply with certain criteria. The blue line is for buy. The red one is for sell. The entry signal - the bar opens above\below the lines. The indicator works on all currency pairs and time frames It can be used either as a ready-made trading system or as an additional signal for a custom trading strategy. There are no input parameters. Like with any signal indicator, it is very difficult to use the product during flat movements. You
FREE
PK Range Break Scalper is an Expert Advisor designed specifically for scalping Range Break 100 Index and Range Break 200 Index by Deriv and Binary broker on the 1 Minute Timeframe. The EA/Robot waits for a range price breakout to open positions and it aims at closing profits between the range price and not the range breakout. The EA/Robot opens buy positions at the lowest range price and sell positions at the highest range price. NB: This EA, unlike my other EA's, doesn't come with optimized
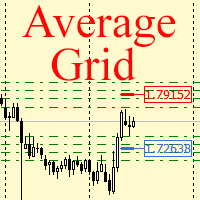
For any number of placed market and pending orders, the utility calculates the "breakeven level" - weighted average price. The calculation is performed individually for buy and sell orders. The weighted average price is marked with a label and colored horizontal line separately as well - one line for the buy price, and the other for sell price.
Input Parameters: Include pending. Include the pending orders in calculation. The default value of this parameter is false, and the calculation of the
FREE

One Click Close MT5 is an EA which allows you close orders quickly. EA display on chart two buttons. The first button "Close All Positions" is using to close all opened orders. The second button "Close Profit Positions" is using to close only profitable orders. EA is closing orders for all available symbols, not only for chart symbol. In EA params you can set distance from upper chart frame (Y Offset) and from left chart frame (X Offset). For installation EA it is only need to copy One Click Clo
FREE

The ShowSessions indicator for MT5 shows up to two, self-selected, time intervals, for a free choosen number of days past and a few future days. Weekends are marked with an additional red vertical line. The indicator makes manuel backtesting of strategies more easily, but you can use ist for daily trading as well. Please note that the server time does not always correspond to the actual time.
FREE
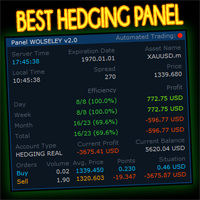
WOLSELEY's Trading Panel View your history in a structured and detailed manner, with efficiency rate and profit rate separated by day, week, month and total, as well as asset details, server time and positions&orders in progress. This panel was created looking on HEDGE-type accounts, but it can be used on NETTING-type accounts without any problems. In the PREMIUM version of this Panel you have the option to use buttons to facilitate the processing and execution of positions&orders in progress.
FREE

The adviser was developed according to the 2TF strategy for EURUSD and GBPUSD. Indicators used: EMA (5), EMA (10), ADX (28), MACD (5; 10; 4).
Rules for Buy Orders EMA (Fast) crossed EMA (Slow) from the bottom up. ADX + DI (blue) above –DI (red). MACD is above zero.
Rules for Sell Orders EMA (Fast) crossed EMA (Slow) from top to bottom. ADX + DI (blue) below –DI (red). MACD is below zero. In the parameters of the adviser, you can change various strategy settings, indicator periods, size and m
FREE
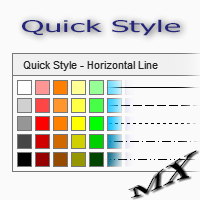
The Quick Style utility is designed for facilitation and acceleration of working with the properties of graphical objects. Left-click a graphical object while holding the Shift key to open the quick access window for configuring the object properties. In the window, you can change the color, style and line width with one click, including those of other graphical objects. All changes are displayed immediately. To close the Quick Style , simply click the free space on the chart. The utility is eas
FREE

The Trail Stops Point indicator shows the deviation from the current price by a certain distance. It has been developed as an additional indicator for Trail Stops by Custom Indicator , to provide a simple trailing of a position stop loss at a specified distance in points.
Indicator Parameters Distance - trailing stop distance in points. Buffer numbers: 0 - Support, 1 - Resistance.
FREE

Ekranınızda Daha Fazla Alan İsteyen Traderlar İçin Gizle Ölçek Aracı Talimatlar Zaman ölçeğini gizlemek için "T" tuşuna, fiyat ölçeğini gizlemek için "P" tuşuna basın. Bu tuşları özelleştirebilirsiniz, ilgili düğmeye tıklayarak ve klavyedeki yeni bir tuş girerek. Her iki seçeneğe de aynı tuşu atayarak her iki ölçeği aynı anda gizleyebilirsiniz. Ölçekleri yeniden göstermek için sadece ilgili tuşa tekrar basın. Neden Bu Aracı Oluşturduk Biz, Tatlı VWAP göstergemizi kullanan traderlara daha fazla e
FREE

The indicator plots a curve of the difference between the values of two trading instruments (currency pairs).
The purpose of the indicator is to observe the processes of divergence and convergence of the values of two trading instruments. The results obtained can be used for trading strategies of statistical arbitrage, pair trading, correlation, and others.
Trading strategy
The indicator is attached to the chart of any trading instrument. In the input parameters, the names of trading i
FREE

Highly configurable Osma indicator.
Features: Highly customizable alert functions (at levels, crosses, direction changes via email, push, sound, popup) Multi timeframe ability Color customization (at levels, crosses, direction changes) Linear interpolation and histogram mode options Works on strategy tester in multi timeframe mode (at weekend without ticks also) Adjustable Levels Parameters:
Osma Timeframe: You can set the lower/higher timeframes for Osma. Osma Bar Shift: Y ou can set th
FREE
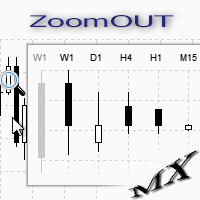
ZoomOUT allows you to have a quick look at a selected bar on a higher timeframe in a pop-up window. After the launch, the indicator works in the background mode occupying no place in the chart and consuming no resources. When activating the indicator by Shift + o (customizable), a pop-up window with a chart displaying bars of higher timeframes is created. To hide a pop-up window, left-click on any clear place on the chart. The indicator is simple and requires no settings.
FREE

Day Points
Indicadtor that shows the points considered important for X days. (Open,Close, High, Low) Used a lot by those who do day trade. These points can be used for decision making by a trader. You will choose the amount of days ago for it to show.
Settings High/Low/Close/Open Show - True/False. Days - Number of days that will show on the chart. Color - Line Color. Style - Line Style.
FREE

Having trouble marking where the various forex sessions start and end? Or perhaps your strategy requires you trade only in a specific session, then this is for you.
The session indicator shades the session you require in a certain color so that you can identify it easily. The sessions shown include: London session, New York session, Asian Session, Asian - London overlap and London - New York Overlap.
Difference source give varying time ranges for the various session, mostly differing by not
FREE

Pairs Navigator is a simple and easy-to-use tool that allows you to view all of your charts in a single window. This eliminates the need to open multiple charts from the Market Watch window, saving you time and effort. Pairs Navigator is also very lightweight, so it will not put a strain on your RAM or cause your MT4/5 platform to hang. To use Pairs Navigator, simply drag and drop the currency pairs you want to view into the Pairs Navigator window. You can then easily switch between charts by
FREE
MetaTrader Mağaza - yatırımcılar için ticaret robotları ve teknik göstergeler doğrudan işlem terminalinde mevcuttur.
MQL5.community ödeme sistemi, MetaTrader hizmetlerindeki işlemler için MQL5.com sitesinin tüm kayıtlı kullanıcıları tarafından kullanılabilir. WebMoney, PayPal veya banka kartı kullanarak para yatırabilir ve çekebilirsiniz.
Ticaret fırsatlarını kaçırıyorsunuz:
- Ücretsiz ticaret uygulamaları
- İşlem kopyalama için 8.000'den fazla sinyal
- Finansal piyasaları keşfetmek için ekonomik haberler
Kayıt
Giriş yap
Gizlilik ve Veri Koruma Politikasını ve MQL5.com Kullanım Şartlarını kabul edersiniz
Hesabınız yoksa, lütfen kaydolun
MQL5.com web sitesine giriş yapmak için çerezlerin kullanımına izin vermelisiniz.
Lütfen tarayıcınızda gerekli ayarı etkinleştirin, aksi takdirde giriş yapamazsınız.