YouTube'dan Mağaza ile ilgili eğitici videoları izleyin
Bir alım-satım robotu veya gösterge nasıl satın alınır?
Uzman Danışmanınızı
sanal sunucuda çalıştırın
sanal sunucuda çalıştırın
Satın almadan önce göstergeyi/alım-satım robotunu test edin
Mağazada kazanç sağlamak ister misiniz?
Satış için bir ürün nasıl sunulur?
MetaTrader 5 için ücretsiz Uzman Danışmanlar ve göstergeler - 20

Volume Analysis Trader looks at volume using a fixed average of volume. This averaging helps spot when volume is rising or declining. Also I have added volume spikes which are when volume suddenly is above the average. These help spot market reversals.
This will hep a trader look for the following in their trading:
Rising volume during a rally shows trend is strong. Falling volume on a rally shows trend is weakening. As a rule of thumb on daily charts if current volume is higher than yesterda
FREE
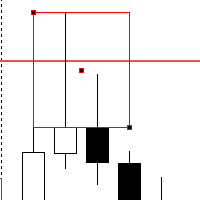
Introducing our Rejection Block Scanner – a powerful and intuitive tool designed to revolutionize your trading by effortlessly identifying key rejection zones across various timeframes. This cutting-edge scanner is crafted to cater to both beginner and experienced traders, offering unparalleled insights into potential market turning points.
**Key Features:**
1. **Multi-Timeframe Analysis:** Uncover opportunities on a grand scale! Our Rejection Block Scanner meticulously scans multiple timefra
FREE
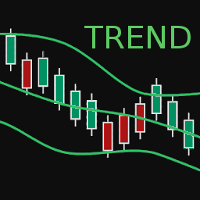
BBTrend is a relatively new indicator developed by John Bollinger to work with Bollinger Bands. It is one of only a few indicators that can signal both strength and direction making it a very valuable tool for traders.
Calculations The calculations are fairly simple. The default periods of 20 and 50 are shown, but these can be changed through the parameters. Lower = MathAbs(lowerBB(20) - lowerBB(50)) Upper = MathAbs(upperBB(20) - upperBB(50)) BBTrend = (lower - upper) / middleBB(20)
Interpret
FREE

Yenilikçi uzman danışmanımız Awesome Comparative ile Awesome Oscillator göstergesinin en etkili stratejilerini keşfedin.
Awesome Comparative ile MetaTrader5 strateji testöründe kapsamlı testler yaparak, brokerınız, tercih ettiğiniz varlıklar ve zaman dilimleri için en iyi çalışan Awesome Oscillator stratejilerini belirleyebilirsiniz.
EA'mız üç dahili strateji sunmaktadır: Saucer, Twin Peaks ve Zero Line Cross. Ayrıca bu stratejileri dokuz farklı şekilde birleştirme imkanı sunarak, sonuçlar ve
FREE

Moving Average 4 TimeFrames
Display 4 moving averages of 4 different timeframes on the same chart. In order not to pollute the chart, the indicator will plot the complete average only in the current timeframe of one of the 4 registered averages, for the other timeframes of registered averages the indicator only displays a part of the average so that you know where it is at that time graphic.
Example:
Display on the 5-minute chart where the 200-period arithmetic moving average of the 5 minute
FREE
A 'Seconds Period' chart, offering enhanced precision for charting and analysis. Especially beneficial during volatile market conditions and intraday trading. This indicator addresses the limitations of MT5's predefined timeframes, allowing for finer granularity down to second intervals.
Since only one EA can run per chart, being an Indicator allows for the additional advantage of running an EA alongside the Seconds Timeframe Candles Indicator on the same chart. Compatible with any intraday tim
FREE

Certainly! Let me introduce you to a powerful tool for MetaTrader 5 (MT5) that can automatically identify and draw support and resistance (S&R) levels on your trading charts. This tool is called the “Support and Resistance Levels Guru” . Support Resistance Levels Guru The Support & Resistance Indicator automatically displays essential S&R levels on your chart. These levels are crucial for technical analysis and are used by many traders. Resistance levels (zones) are shown in R ed , while suppo
FREE

The indicator My Big Bars can show bars (candles) of a higher timeframe. If you open an H1 (1 hour) chart, the indicator puts underneath a chart of H3, H4, H6 and so on. The following higher timeframes can be applied: M3, M5, M10, M15, M30, H1, H3, H4, H6, H8, H12, D1, W1 and MN. The indicator chooses only those higher timeframes which are multiple of the current timeframe. If you open an M2 chart (2 minutes), the higher timeframes exclude M3, M5 and M15. There are 2 handy buttons in the lower r
FREE
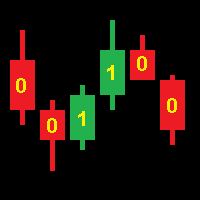
Operation of the CodEx Expert Advisor is based on patterns composed of consecutive candles. Positions are closed when opposite signals appear. Sequences of candles are encoded into an integer according to the following rule. The code number must be converted to binary form and the highest bit must be discarded. The resulting sequence of bits encodes a continuous sequence of candles, where 1 is a bullish candle, 0 is a bearish candle. The higher bits encode the earlier candles. For example: 19[10
FREE

"Here We Gold" is an EA suitable for trading XAUUSD with M15 timeframe. It has a principle for entering orders using indicators such as Candle pattern, MACD, and RSI. The profit principle involves using a Trailing stop. Recovery system, no grid Strategy. Info Minimum recommended account size: 300 USD Lot size : Fix lot 0.01 Timeframe : M15 Symbol : XAUUSD For better result, please use low spread broker. Recommended broker : IC Market
Live Account (Myfxbook): https://shorturl.asia/0axzG
FREE
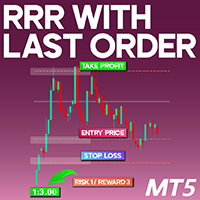
Risk-Reward Ratio with Last Order Indicator for MT5 The Risk-Reward Ratio with Last Order (RRO) Indicator is an essential tool designed for traders using the MetaTrader 5 (MT5) platform. This indicator helps users assess the risk-to-reward ratio of their trades by calculating the distance between the stop loss, take profit, and entry point . The resulting ratio is prominently displayed in the top left corner of the chart, allowing for quick and easy evaluation. «Indicator Installation & User Gui
FREE

At first, I got my teeth into Dragon Ultra Expert Advisor. Take your time to test demo. You should be always perfectly familiar with your Expert Advisor before a live trading. Based on the statistics, you are more likely to succeed if you learn from experience to use this. Dragon Lite is a free version for you to understand how the bot works. Parameter Trading Mode: Change to UNLIMITED. You should use the Dragon Training proficiently before using the Dragon Ultra .
The Forex Tr
FREE

Jackson Support and Resistance it a powerful advance support and resistance indicator which provide signal base on price action, it Design to make things easy for everyone to draw support and resistance. we believe most strategies are built with support and resistance as a foundation .Having support and resistance perfect can be a game change to you way of trading. It flexible to all instrument .don't forget to watch our video on how to us this indicator prefect and progressive.
FREE

Daily pivot are relatively important in trading.
This indicator have options to select 5 commonly use pivot point calculations.
User input Choose Pivot Point Calculation (Method Classic, Method Camarilla, Method TomDeMark, Method Fibonacci or Method Woodies.) Choose Applied Timeframe for the calculation (M5, M15, H1, H4, D1, W1 etc) Can be attached to any timeframe Choose color of Pivot point Note:
For MT4, please refer here : https://www.mql5.com/en/market/product/22280
FREE

Volume Weighted Average Price (VWAP) is a trading benchmark commonly used by Big Players that gives the average price a Symbol has traded throughout the day. It is based on both Volume and price. Additionally we put in this indicator the MVWAP (Moving Volume Weighted Average Price). For those who do not know the usage and the importance od this indicator I recommend a great article about this subject at Investopedia ( https://www.investopedia.com/articles/trading/11/trading-with-vwap-mvwap.asp
FREE

The "Matrix Series" indicator is a technical analysis tool designed to identify potential support and resistance zones by visualizing overbought/oversold conditions and trend direction using a combination of price data and customizable parameters, incorporating Commodity Channel Index (CCI) to highlight potential reversal points within the market.
Key features of the Matrix Series indicator: Dynamic Zones: Calculates support and resistance levels based on CCI values, allowing users to adjust th
FREE

Indicator IRush uses a modified version of a popular indicator RSI (Relative Strength Index) to look for entries on a daily chart or lower. The indicator has been set up and tested with the major symbols: AUDUSD, EURUSD, GBPUSD, USDCAD, USDCHF, and USDJPY. An automated trading with this indicator is implemented in the expert advisor Intraday Rush . This expert advisor can open, trail and close its trades. Check it out, it may be exactly what you are looking for!
A Correct Reading of IRush
The c
FREE

The Candle High Low Exit indicator uses the highest high and the lowest low of a range to draw trailing stop lines (orange under buys, magenta over sells) that advance with the trend until the trend changes direction. Moreover, the trailing stop lines are generated to support the order’s trend direction (long or short): In an upward trend, the long trailing stop line (orange line under buy) appears and advances upward until the close crosses under the line.
In a downward trend, the short trai
FREE
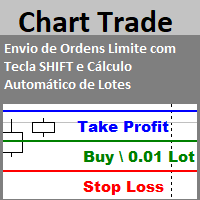
Envio de Ordens Limite com Tecla SHIFT (Cálculo Automático de Lotes) Funcionalidades: Definição de Níveis: Estabeleça os níveis de Stop Loss, Take Profit e o preço da ordem utilizando a tecla SHIFT e cliques do mouse. Cálculo Automático de Lotes: Os lotes são calculados automaticamente com base no risco da conta.(A opção também para usar volume fixo) Gerenciamento de Posições: Botão para fechar todas as posições abertas enviadas pelo EA. Botão para cancelar todas as ordens pendentes enviadas pe
FREE

EA, kârlı pozisyonları arayıp kapatarak kârsız pozisyonları kapatabilir .
Bu asistan , tüm pozisyonlar arasında terminaldeki en kârsız pozisyonu arar . Ayrıca, kalan kârlı pozisyonları arayarak, bir veya daha fazla pozisyonun kârının başka bir pozisyonun kaybından fazla olması durumunda zararı karşılayabilecek bir dizi pozisyon hesaplar. Bu tür bir dizi pozisyon bulunursa danışman bunları kapatır. Bir dizi konum kesinlikle herhangi bir konumdan oluşabilir. Maksimum sayıları da
FREE

This Expert Advisor examines signals from indicators such as MACD, Stochastic, and RSI to identify market trends and turning points. It incorporates multiple strategies and works seamlessly together. The Advisor analyzes the market situation in real time and automatically executes trades at predefined stop loss and take profit levels. HydraAlchemist is also easy to use. The intuitive and easy-to-understand setup screen allows you to execute trading strategies with few parameters. When trading Go
FREE

The Fisher Transform is a technical indicator created by John F. Ehlers that converts prices into a Gaussian normal distribution. The indicator highlights when prices have moved to an extreme, based on recent prices. This may help in spotting turning points in the price of an asset. It also helps show the trend and isolate the price waves within a trend. The Fisher Transform is a technical indicator that normalizes asset prices, thus making turning points in price clearer. Takeaways Turning poi
FREE

TransitGhost Signal indicator, this is one of my best forex trading strategy. The strategy is based on the simple moving average cross, 5 SMA AND 200 SMA of which take a longer time to cross. Whenever the is a cross between the 5 SMA and 200 SMA a signal will be given, when the 5 SMA cross the 200 SMA to the upside ,a buying arrow will appear on chart, and push notification(alert) "Buy now, use proper risk management" will be sent on both the MT5 PC and mobile app, and when the 5 SMA cross the 2
FREE
Exponential Moving Average indicators are widely used by Forex traders all around.
This EA uses a simple Scalping Strategy using 4 exponential moving averages and have lots of config parameters. EMA1: 9 | EMA2: 13 | EMA3: 21 | EMA4: 200 Basically the EA Strategy place an order when it detects that the last candle touched the 3ª EMA line and the last 5 candles do not touch it.
In order to know more about the strategy, we presented it in our youtube channel: Video with EA Strategy Details: htt
FREE

Giriş için ücretsiz, 198 dolara sahip olduğum ücretli sürümü inceleyin
https://www.mql5.com/en/market/product/136928
Bu bot, yerleşik risk yönetimi ve isteğe bağlı Martingale işlevselliği ile hareketli ortalama (MA) geçiş stratejisi kullanır.
Temel Parametreler:
MagicNumber - Çakışmaları önlemek için botun işlemleri için benzersiz kimlik FixedLotSize - Temel işlem boyutu (örn. 0,01) FastValue/SlowValue - Hızlı ve yavaş MA'lar için dönemler (örn. 3 ve 6) ReverseLogic - true: hızlı MA yavaş M
FREE

Description: For a comprehensive understanding of our indicators, we invite you to explore the entire Q&A section within this MQL5 blog post here . The "Live Account Statistics" Indicator is a powerful technical analysis tool that provides real-time insights into the performance of your trading account. With this indispensable tool, you can access crucial account statistics, such as balance, equity, drawdown, and more, allowing you to make data-driven trading decisions. Key Features: Real-Ti
FREE

Corazon is an EA that operates using the martingale method, with carefully selected entry points. When a trade goes in the wrong direction, the EA will open martingale orders with increasing lot sizes and distances, then average the price and reset the overall TP for all the orders. Corazon EA also has options for trailing functionality for individual orders, trailing all martingale orders together, or only trailing the initial order.
FREE

Real Quants Forex Volatility Catcher for MT5 Introduction Real Quants Forex Volatility Catcher is a cutting-edge automated trading system designed specifically for MetaTrader 5. Developed through advanced machine learning and exhaustive data mining techniques, this system offers traders a robust strategy for navigating the complex terrains of the forex markets. With a commitment to rigorous testing that includes Monte Carlo simulations, walk-forward matrix optimization, and live execution valida
FREE
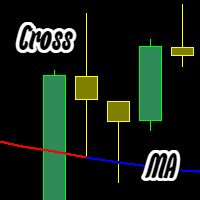
Gösterge, iki renkli bir Hareketli Ortalama (MA) çizer: Mavi — önceki mumun açılış ve kapanış fiyatı MA çizgisinin üzerinde. Kırmızı — önceki mumun açılış ve kapanış fiyatı MA çizgisinin altında. Özelleştirilebilir ayarlar: MA türü (Basit, Üstel, Düzeltilmiş, Doğrusal); MA periyodu; MA rengi değiştiğinde uyarı. Yanlış bir şey varsa bize bildirin, düzeltelim!
bar cross Moving cross candle cross Moving cross bar cross MA cross candle cross MA cross bar cross Moving Average cross candle cross
FREE

INTRODUCTION : The breakout strength meter is a trading tool that is used to identify which currencies are the strongest to breakout, and which currencies are the weakest to breakout. The settings for the indicator are easy, and if you cannot find the settings, please leave a comment The tools are completely free to use Please, if you like the indicator, please leave a comment and rate the indicator in order to develop it
FREE
Saçma Olmayan Forex Yöntemi için Ticaret Paneli Grafiklerinizi temiz tutarken işlem hızınızı artırın
Özellikler: -Konum boyutlandırma: Al/Sat'a tıkladığınızda, bu araç, riskinize en yakın lot miktarıyla (her alım satımda kullanılan bakiye yüzdesi) 2 alım satım açar. Pip değerlerini hesaplamayı unutun!
-SL ve TP: her işlem 1.5*ATR'de Zarar Durdur ve iki yarıdan biri 1*ATR'de Kâr Al ile açılır. Kullanılan ATR değeri, günlük mumun tamamlanmasına 4 saatten az bir süre kalmışsa, mevcut mumdan bi
FREE

Resistance and Support is an easy to use indicator to apply horizontal lines of resistance and support. There are two windows for adding levels. When you press the button, a line appears on the price chart. It is possible to move this line with the mouse, thereby changing the indicator readings. In the indicator menu there is a choice of possible alerts - no alert, alert on touching the level and an alert for closing the candle after the level.
FREE

Seeing and interpreting a sequence of Candlesticks is easy to spot when you are a human... Higher Highs, Higher Lows, are the panorama of a Buying trend, at least in a short period of time... Seeing a current candlestick higher high and a lower candlestick low, as a human, you can immediately spot a "divergence", an "alert", a "starting range", but in the end and based on other analysis a human trader can understand and behave accordingly to this kind of candlestick data... But what about EAs (r
FREE

AI Moving Average göstergesi ile ticaretin yeni çağına hoş geldiniz. Bu gelişmiş MetaTrader 5 göstergesi, traderlara piyasa hareketlerine dair öngörüler sağlamak için tasarlanmıştır. Bu araç, AI'nın gücünü gecikmesiz bir üssel hareketli ortalamanın güvenilirliği ile birleştirerek gelecekteki fiyat trendlerinin doğru ve zamanında tahminlerini sunar. Yenilikçi Doğrusal Regresyon Modeli AI Moving Average, geçmiş fiyat verilerini analiz etmek için bir doğrusal regresyon makine öğrenimi modeli kullan
FREE

Revolution Martingale is an indicator designed for trading binary options on the M5 timeframe. Features: M5 Timeframe: It is recommended to use the indicator on the M5 timeframe for optimal trading. Trade Entry: Trades should only be opened on the first candle after a signal appears. Signals: A blue diamond indicates a buying opportunity for upward movement, while a red diamond indicates a buying opportunity for downward movement. Configured for Effective Binary Options Trading: The indicator i
FREE

The Martinware Manual Trading Helper indicator is aimed at helping people start their lives in manual trading. It can be used to display both some generic images at the right side of the graph, where custom operational remarks may be displayed or just a blank rectangle hiding the chart while backtesting. Moreover, it can periodically play a list of sounds. To show a blank rectangle, let the first image name input field empty and select the desired color. To show one or more custom images inste
FREE

Dynamic Arrow Pro – Precision Buy/Sell Signal Indicator
Works best on Higher Time Frames 30m,H1,H4,Daily
Overview : Dynamic Arrow Pro is a powerful, multi-timeframe buy/sell signal indicator designed for traders looking to enhance their decision-making process with clear, precise arrows on the chart. This indicator dynamically adjusts its settings based on the timeframe and provides reliable signals for trend-following strategies. Key Features : Dynamic Settings : Automatically adapts the in
FREE

TİCARİ FOTOKOPİ MAKİNESİ - YATIRIMCI ŞİFRESİ - KOPYA TİCARET - MT4 x MT5 CROSS PLATFORM
Not: Müşteri hesabının takip edeceği ana hesapta hem "Mirror Copier Master"a hem de ana hesabı takip edecek müşteri hesabında "Mirror Copier Client"a ihtiyacınız vardır.
Bloglar : https://www.mql5.com/en/blogs/post/756897
NASIL ÇALIŞIR :
https://www.youtube.com/watch?v=V7FNpuzrg5M
MT4 Sürümü
Usta : https://www.mql5.com/en/market/product/114774
Müşteri: https://www.mql5.com/en/market/product/114843
FREE

MT5 Grid Flowcon: An Automated Expert Advisor (EA) for USOIL, designed to deliver consistent cash flow through efficient and systematic trading strategies.
Key features include: Auto Demand & Supply Zones : Identifies and trades key supply and demand levels effortlessly. Grid Trading : Strategically places orders to capitalize on price movements within set ranges. Dynamic TP/SL with VWAP : Adjusts take profit and stop loss levels in real time using Volume Weighted Average Price. Drawdown Simul
FREE

Channels indicator does not repaint as its based on projecting the falling and raising channels. As a trader you need a path to be able to place your buy and sell trades such as: Supply and Demand , Falling & raising channels. Falling and raising channels can be in any time frame and also can be in all time frames at the same time and the price always flows within these channels. Experienced trades will draw the key levels and channels around the time frames. But, they will not be able to draw
FREE
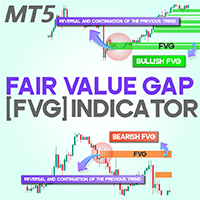
Fair Value Gap or FVG indicator MT5
The Fair Value Gap (FVG) Indicator is a valuable asset for traders using MetaTrader 5, designed to highlight market inefficiencies. An FVG occurs when an imbalance between supply and demand causes a rapid price movement. To understand this, picture three consecutive candlesticks; the space between the first and third candlestick represents the "FVG." This indicator automatically marks these gaps on the chart using dynamic boxes—green for bullish FVGs and red
FREE

The Kijun-Sen Envelope is a powerful trend-following indicator based on the Kijun-Sen line from the Ichimoku Kinko Hyo system. This tool creates dynamic upper and lower bands around the Kijun-Sen, forming an envelope that helps traders identify market trends, potential reversals, and overbought/oversold conditions.
Key Features: • Trend Confirmation – Helps determine whether the market is in a strong uptrend, downtrend, or ranging phase. • Support & Resistance Zones – The envelope acts as
FREE

The XU_30_913073101_S_HH_CF_SQX is an algorithmic trading strategy for MetaTrader, tested on XAUUSD (Gold) using the M30 timeframe from April 1, 2004, to April 24, 2024. There is no need to set up parameters, all settings are already optimized and fine-tuned.
Recommended broker RoboForex because of EET timezone.
You can find the strategy source code for StrategyQuant at the link: https://quantmonitor.net/gold-emperor/
Key details are:
Parameters
MagicNumber: 913073101
Main Chart: Curre
FREE
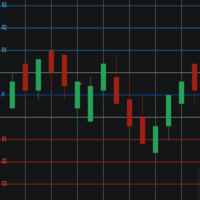
Pivot Points Levels Description The Pivot Points Levels indicator is an advanced and comprehensive tool for technical analysis based on support and resistance levels calculated from pivot points. This free indicator combines 6 different calculation methods with support for multiple timeframes, offering a robust solution for identifying key price reversal and continuation areas. Key Features 6 Calculation Methods : Traditional, Fibonacci, Woodie, Classic, DeMark (DM), and Camarilla Multi-Timefram
FREE

This is a buyer and seller aggression indicator that analyzes the shape of each candle and project this data in a histogram form. There are 4 histograms in one. On the front we have two: Upper - Buyer force. Lower - Seller force. At the background we also have two histogram, both with same color. They measure the combined strenght of buyers and sellers. This histograms can be turned off in Input Parameters. It is also possible to have the real or tick volume to help on this force measurement. IN
FREE

Hello this is MT5 version of my first EA Project - MA CROSS Simple MA Cross Fast and Slow with additional High Time Frame Filter. You can set manually to get optimum Result. It's suit for swing Trader that Trade on High Time Frame. ex. H1 / H4 with D1 Filter. Or you can modify It that follow your strategy.
Give me good feedback to improve for better version. Cheers!!
Hurry up FREE download for Limited Time!!
Please test It on Demo account or strategy tester before applied on Live Account
FREE

Wyckoff fans, enjoy!
Ideally to be used with the Weis Waves indicator, but it can be easily used alone, the Waves Sizer puts the range (in resulting Price movement) done by the Price on its market swings. You can control how accurate or loose will be the swings. This tool is very helpful for visually know how much the Price has traveled in your Timeframe. This way you can confront this level of effort with the resulting Volume, etc... Weis Waves indicator:
https://www.mql5.com/en/market/produc
FREE

-Önerilen Zaman Aralığı: 4 saat -Para birimi: GBPUSD
-50x kaldirac icin tavsiye edilen equity lots= 200 100x kaldirac icin tavsiye edilen equity lots= 100 200x kaldirac icin tavsiye edilen equity lots= 50 -50x kaldirac icin tavsiye edilen equity lots= 200 100x kaldirac icin tavsiye edilen equity lots= 100 200x kaldirac icin tavsiye edilen equity lots= 50
AMA KENDI RISK AYARLARINIZI TEST EDEBILIRSINIZ
Bunu diğer zaman dilimlerinde ve farklı para birimlerinde kullanarak da test edebilirs
FREE

This indicator is based on Mr. Mark Fisher's ACD strategy, based on the book "The Logical Trader."
- OR lines - A lines - C lines - Daily pivot range - N days pivot range - Customizable trading session - Drawing OR with the desired time Drawing levels A and C based on daily ATR or constant number - Possibility to display daily and last day pivots in color zone - Displaying the status of daily PMAs (layer 4) in the corner of the chart - Show the order of daily pivot placement with multi-day piv
FREE

All traders should know the trend before making their decision when placing the buy or sell orders. The first step always starts with supply and demand , rising and falling channels , trend lines, engulfing candles etc. All the above contribute to what is called “Price Action” and that is the best and most reliable way in trading and catching the trend and making profits, without stress. The Investment Castle Trend Line Indicator will automatically draw the trend lines on the MT5 for you.
FREE

McS Super Trend -This is one of the most popular classic trend indicators. It has a simple setting, allows you to work not only with the trend, but also displays the stop loss level, which is calculated by this indicator. Benefits:
Instruments: Currency pairs , stocks, commodities, indices, cryptocurrencies. Timeframe: М15 and higher. Trading time: Around the clock. Shows the direction of the current trend. Calculates the stop loss. It can be used when working with trading. Three types of no
FREE
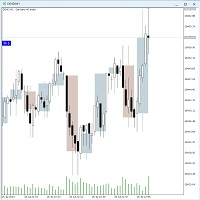
The Twotimeframe-Candles (RFrame) - Indicator for MT5 shows the candles of an higher, timeframe as an overlay on the current timeframe. You can choose the number of candles and color of the overlays. The indicator calculates the candle evevery tick. If you like the indicator, please left a comment. Version 1.1: The second time frame can now be set.
Keywords:
Candlestick, Multitimefram, Two Timeframes,
FREE
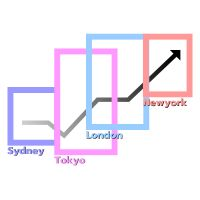
Time Zones and the Forex Market
The Forex market operates continuously 24 hours a day, facilitated by its global distribution across various time zones. The market is anchored by four primary trading centers: Sydney , Tokyo , London , and New York . Each trading center has specific opening and closing times according to its respective time zone. These differences significantly impact market volatility and trading opportunities during each session. Features Enable/Disable Date Display Enable/Di
FREE

Acıklama:
Forex piyasasında (PSAR) Profesyonel ve populate göstergelerden Birine Dayanan Yeni ücretsiz göstergemizi tanıtmaktan mutluluk duyuyoruz (PSAR) drank gösterge orijinal Parabolik SAR göstergesinde Yeni bir değişikliktir pro SAR göstergesinde noktalar ve Fiyat tablosu arasındaki geçişi görebilirsiniz, drank crossover bir sinyal değil, hareketin sonu potansiyeli hakkında konuşun, yeni mavi nokta ile satın almaya başlayabilir ve ilk mavi noktadan bir atr önce stop loss koyabilirsiniz ve
FREE

The Stochastic RSI (StochRSI) is a technical indicator that combines the characteristics of the Relative Strength Index (RSI) with the Stochastic Oscillator, resulting in a more sensitive tool that generates a higher number of trading signals. Developed by Tushar Chande and Stanley Kroll, the indicator was designed to overcome a perceived limitation of the traditional RSI: the low frequency of overbought and oversold levels activation (commonly 80 and 20), especially in less volatile assets. Ho
FREE

TG Ponto de Cobertura (Coverage Trade)
This Indicator checks your trading results on the day relative to the asset on the chart and adds a line at the price corresponding to the coverage point for the open position, considering the entry price and lot size. The coverage point will be recalculated after new entries, based on the average price of the open operation and the lot size.
If the result for the day is zero, a line will be displayed at the price of the current trade.
If the day's result
FREE
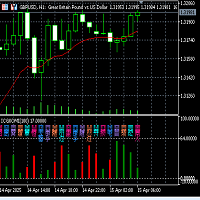
Fuxi Guaxiang Dual-color Oscillation Indicator Function and Usage Instructions (V2.1)
Fuxi Guaxiang Dual-color Oscillation Indicator Instructions: (1) This Guaxiang change indicator is based on the Yin-Yang transformation thought of the "Book of Changes" philosophy in ancient Chinese culture, integrating the results of the long-short game in each candlestick K-line period of the financial trading K-line chart, using China's oldest predictive coding method, in the form of the 64 Guaxiang of the
FREE

In this indicator you choice a data to be used from yesterday (high, low, open, close, etc) to automatically draw an line to be the zero. And, from that a percentage deviation ("Percentage to be used") is calculated and used to draw others line to both side until a limit be reached.
Both sides can have diferrent colours as show in screenshots. Also, more than one indicator can be used at same time.
FREE

Aurea Stella EA – Illuminate Your Trading Path Like the guiding stars that lead sailors through uncharted waters, Aurea Stella EA empowers you to navigate the unpredictable seas of the financial markets. Craft Your Own Constellation of Strategies: Endless Combinations – Weave together Bollinger Bands, Stochastic, RSI, MACD, Envelopes, and Donchian Channels to create your unique trading patterns.
Precision Control – Adjust stop loss, take profit, trailing stops, and choose whether to reverse
FREE

AliSession Highlight is an indicator that highlights a specific period of time according to your preferences. It can help you gain a clear vision of price movements into a specific session, the range of a session, and also to easily identify the high and low of the session. You can use it on any currency pairs, indices, and any timeframes. Settings: Start Hour: Set the hour to initiate the session highlight. Start Min: Set the minute for the start of the session highlight. End Hour: Specify the
FREE

Custom Panel allows you to gather all kind of important information and display it as one handy table in the upper right corner of the chart.
You can choose the contents of the panel yourself. Every row will show your own customized condition or value. Every column shows a different timeframe. The panel may contain up to 10 rows and up to 8 columns. Sample usage Row : Price > EMA(30)
Mode : YES_NO
Meaning : is current price above EMA(30)
Row : Ask < Bands[L]
Mode : YES_NO
Meaning : is current a
FREE

This indicator is based on the Bollinger Bands indicator. It helps the user identifying whether to buy or sell. It comes with an alert that will sound whenever a new signal appears. It also features an email facility. Your email address and SMTP Server settings should be specified in the settings window of the "Mailbox" tab in your MetaTrader 5. Blue arrow up = Buy. Red arrow down = Sell. Line = Trailing Stop. You can use one of my Trailing Stop products that automatically move the Stop Loss and
FREE

(traduzione Google) Questo indicatore si basa sul " Time Segmented Volume (TSV)" originale sviluppato da Worden Brothers, Inc . Tuttavia, ho aggiunto alcune funzionalità in più a questo. Si può scegliere il prezzo da applicare, invece di avere solo il prezzo di chiusura predefinito utilizzato dall'originale. Si può anche scegliere quale ponderazione del volume utilizzare, incluso uno pseudo-volume basato sull'intervallo reale o nessuna ponderazione del volume. (Original text) This indicator is b
FREE

Prompt Firm Ready! Limited Free Version ZenithPulse, yüksek frekanslı bir stratejiyi sıkı bir risk yönetimi ile birleştiren güçlü ve hassas bir ticaret danışmanıdır. Sadece EUR/USD çiftinde haber yayınları sırasında işlem yapar ve anlık volatiliteye tepki verir. Bu strateji, Ana Özellikler: Basitlik ve kullanım kolaylığı: ZenithPulse, yapılandırma ve anlaşılmasının kolaylığı ile öne çıkar, bu sayede deneyim seviyesinden bağımsız olarak her tüccarın temel stratejiyi hızla kurup anlayabilmesi
FREE

Clock GMT Live, komisyoncumuz hakkında daha fazla bilgi edinmek için ihtiyacınız olan her şeye sahiptir, çoğu zaman benim hangi gmt üzerinde olduğumu veya aracımın hangi gmt üzerinde çalıştığını merak etmiş olacaksınız, bu araçla hem GMT'yi hem de gerçek zamanlı olarak öğrenebileceksiniz. komisyoncunun ve yerel saatinizin zaman farkı, ayrıca komisyoncunun pingini de sürekli olarak bileceksiniz Sadece günün bir saatinde yerleştirerek bilgi alabilirsiniz.
Her satın alma için fiyat artar, bununla
FREE

Highly configurable Adx indicator.
Features: Highly customizable alert functions (at levels, crosses, direction changes via email, push, sound, popup) Multi timeframe ability Color customization (at levels, crosses, direction changes) Linear interpolation and histogram mode options Works on strategy tester in multi timeframe mode (at weekend without ticks also) Adjustable Levels Parameters:
ADX Timeframe: You can set the lower/higher timeframes for Adx. ADX Bar Shift: you can set the of
FREE

This MetaTrader 5 indicator identifies and visually displays the trading hours of major financial markets (Europe, US, and Asia) on the chart. Through customizable colored fills, it marks the trading periods of each market, respecting server times (GMT+2) and excluding weekends. Market names are displayed near the top of the chart in Arial Black font, also with customizable color. The indicator automatically adjusts to the chart scale, maintaining the fill across its entire vertical range.
FREE

Gatotkaca Support Resistance Trendline Indicator is a simple indicator that detects support, resistance and trendlines. It will helps you find breakout momentum based on lines calculated by this indicator. This is conceptually based on fractals, but with customizable periods. Compatible for any timeframes. You can customize how this indicator work by setting up the period input.
FREE

"Gold Trader" yatırımcıların ve traderların altın piyasasında daha tutarlı ve karlı yatırım kararları almalarına yardımcı olmak için tasarlanmış bir finansal robottur. Robot, gelişmiş veri analiz algoritmalarını kullanarak altın piyasası trendlerini gerçek zamanlı olarak analiz ediyor ve altın varlıklarının ne zaman alınacağı, satılacağı veya tutulacağı konusunda içgörüler sağlıyor.
Yatırımcılar, altın piyasasını incelemek için saatler harcamalarına gerek kalmadan, “Gold Trader” ile yatırım uz
FREE

Key Takeaways This timer does not lag like other timer indicators Show the time end of candlesticks and spread Hide or Show Spread depending on user needs Works on all timeframes Adjust Text Size Adjust Text Color Adjust Text Font
If you love this indicator, please leave a positive rating and comment, it will be a source of motivation to help me create more products <3
FREE
MetaTrader mağazası, geliştiricilerin alım-satım uygulamalarını satabilecekleri basit ve kullanışlı bir sitedir.
Ürününüzü yayınlamanıza yardımcı olacağız ve size Mağaza için ürününüzün açıklamasını nasıl hazırlayacağınızı anlatacağız. Mağazadaki tüm uygulamalar şifreleme korumalıdır ve yalnızca alıcının bilgisayarında çalıştırılabilir. İllegal kopyalama yapılamaz.
Alım-satım fırsatlarını kaçırıyorsunuz:
- Ücretsiz alım-satım uygulamaları
- İşlem kopyalama için 8.000'den fazla sinyal
- Finansal piyasaları keşfetmek için ekonomik haberler
Kayıt
Giriş yap
Gizlilik ve Veri Koruma Politikasını ve MQL5.com Kullanım Şartlarını kabul edersiniz
Hesabınız yoksa, lütfen kaydolun
MQL5.com web sitesine giriş yapmak için çerezlerin kullanımına izin vermelisiniz.
Lütfen tarayıcınızda gerekli ayarı etkinleştirin, aksi takdirde giriş yapamazsınız.