YouTube'dan Mağaza ile ilgili eğitici videoları izleyin
Bir alım-satım robotu veya gösterge nasıl satın alınır?
Uzman Danışmanınızı
sanal sunucuda çalıştırın
sanal sunucuda çalıştırın
Satın almadan önce göstergeyi/alım-satım robotunu test edin
Mağazada kazanç sağlamak ister misiniz?
Satış için bir ürün nasıl sunulur?
MetaTrader 4 için ücretli teknik göstergeler - 81

The super channel is a very profitable indicator to be used preferably on TF H1 and H4 also in a combined version using two of them together. Its signal is excellent and used with evaluation of supports and resistances the signal is very precise. The first warning signs are the dots, green dot warning of an upcoming buy signal, red dot warning of an upcoming sell signal. The blue arrows is the buy opening signal, the red arrow is the sell opening signal.

The MaxandMin Indicator when used with the Super Canale Indicator gives strength to the input signal. When the arrow of this indicator appears with that of the Super Channel the signal is input, when it appears alone the signal is alert. You can also use this indicator with price action to define the true highs and lows of the price. Its use with the Super Canale indicator gives an additional warning signal or profitable entry.

For ichimoku lovers, I leave you this indicator that allows you to see the ichimoku kumo of the next two periods in the current period. The indicator values in periods higher than the current one are adjusted automatically, it is only necessary to enter the parameters of the main ichimoku (it has the standard parameters 9,26,52) and based on these parameters the other 2 clouds or kumo are calculated.
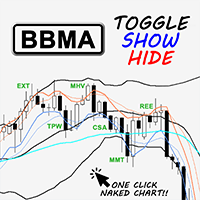
Intro A customizable toggle indicator based on BBMA (Bollinger Bands & Moving Averages) trading system which allows traders to switch between BBMA & Naked Chart in one click, without having the need to change the chart template.
Main Features One Click Toggle Show/Hide : Switch to naked chart in just one click! Combine it with other trading strategy as you prefer to give more confluence on your trading. All drawn objects will not be affected by the indicator toggle show/hide function. Customiz
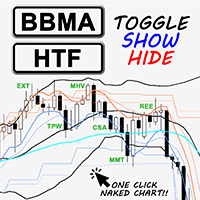
Intro A customizable toggle indicator based on BBMA (Bollinger Bands & Moving Averages) trading system which allows traders to switch between BBMA & Naked Chart in one click, without having the need to change the chart template. Added ability to view higher time frame zones on a lower time frame chart, in one click, to assist traders on multi-time frame analysis.
Main Features One Click Toggle Show/Hide : Switch to naked chart in just one click! Combine it with other trading strategy as you pre

Wave Anatomy Visit: http://www.tradethevolumewaves.com for more information
Construct your own 5 Waves and analyze the price movements stages:
Easy Movement Hard time to move Fast move This indicator is based on Wyckoff’s, David’s Weis and my Speed Index Theory. This indicator will you help analyze what is happening in 5 Price Waves that you can construct yourself. This tool is designed for scalpers and swing traders and will help them to analyze any wave on any timeframe at the same time.

What Is MT4 Candlestick Pattern Indicator Candlestick patterns are groups of candlestick that have a meaning for the trader. These groups are usually composed of two, three, four, or five candles and indicate some form of price action happening. In many cases traders use these patterns to decide what to do next. Candlestick Pattern Indicator for MT4 is a plugin that allows you to see the most common candlestick patterns on your chart. The indicator scans the chart and detects popular patterns, m

Ichimoku panel is an indicator that shows the behavior of different ichimoku signals in all time frames.
System parameters:
TENKAN SEN: Average period of Tenkan Sen.
KIJUN SEN: Average period of Kijun Sen.
SENKOU SPAN B: Average period of Senkou SpanB.
SHOW TENKAN..KIJUN: shows the crossing of the moving averages TENKAN SEN and KIJUN SEN.
SHOW KIJUN..KUMO: shows the position of the kijun sen moving average with respect to the kumo or ichimoku cloud.
SHOW CHICOU..KUMO: shows the position
The Trainspotting technical analysis indicator shows market entry points, potential market reversal points. The intelligent algorithm of the indicator accurately determines the trend. Uses two options for settings. The indicator is built for simple and effective visual trend detection with an additional smoothing filter.
Are you tired of the constant ups and downs? Do not become a victim of unstable market movements, it's time to get rid of it somehow! Already now you can use Trainspotting sol

Strangelove monitors the formation of a trend and helps the user identify entry points. Thanks to this data, the investor is able to predict the situation and form a game strategy. It is trend signals that allow clients of brokerage companies to achieve efficient use of trading instruments and achieve better profitability.
The correct calculation of the current trend is the key to successful asset trading in the foreign exchange market. It is important to understand that trading is never in a

Reservoir is a reversal indicator and is part of a special category of instruments. The indicator not only analyzes the price movement, but also indicates the points of possible reversals. This contributes to the quick and optimal opening of buy or sell orders (depending on the current situation). In this case, the historical data of the analyzed asset is necessarily taken into account. It is the correct implementation of such actions that in many ways helps traders make the right decision in t

Back to the Future is a trend indicator. It consists of four parts.
1. Part is the fibo levels that define the minimum and maximum targets.
2. This is a target level that defines the minimum correction targets and trend targets.
3. Dynamic levels correction targets and trend targets..
4. Trend levels based on trend lines.
All parts are included in the indicator menu.
the indicator Back to the Future does not repaint.
The change of information comes after the calculation of the last 3 bars.

Waterfront - A unique trending indicator. The new system adapts to the market, eliminates additional conditions and copes with its task. A revolutionary new way to detect the beginning of a trend early. Trend indicator, shows signals, can be used with an optimal risk ratio. It uses reliable algorithms in calculations. It shows favorable moments for entering the market with arrows, that is, using the indicator is quite simple.
Trend indicators make it possible to classify the direction of price
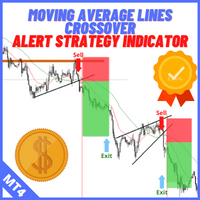
Description: For a comprehensive understanding of our indicators, we invite you to explore the entire Q&A section within this MQL5 blog post here . The "Moving Average Lines Crossover with Alert" is a valuable technical analysis tool designed to help traders identify potential trend reversals and trading opportunities. Seamlessly integrated into your trading platform, this indicator empowers you with essential data to make well-informed trading decisions. Spot Trend Reversals: Utilize the po
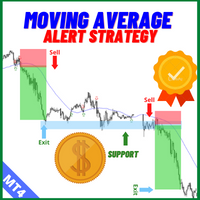
Description: For a comprehensive understanding of our indicators, we invite you to explore the entire Q&A section within this MQL5 blog post here . The Moving Average Cross Price Alert Indicator is a technical tool designed to simplify your trading decisions. With a single moving average line, this indicator effectively identifies trend changes and potential trade opportunities. Its core function is to provide real-time alerts when the price crosses above or below the moving average line, sig

This trading system is based on mathematical probability. In this case, 5 consecutive candles are compared with each other. For a logical comparison, consider these 5 candles as 1 candle on the M5 timeframe. Therefore, the comparison begins with the opening of a candle on the M5 timeframe. The probability of a match is 50% in the 1st candle, 25% in the 2nd candle, 12.5% in the 3rd candle, 6.25% in the 4th candle, 3.125% in the 5th candle. Thus, the 5th candle has a probability of matching in 1

Price Action Areas is an indicator that draws the areas in which to intervene to buy or sell. It is suitable for those who trade using the price action . It can also be used as a support with other indicators such as the Super Channel, as you see in the images, or the MaxandMin to confirm the entry level. You can use it to view areas across multiple Time Frames and you will have a good entry signal. It is a simple but effective indicator.

Indicator which identifies Trend and also buy/sell opportunities. Use for entries aligned to the Trend. Although Diamond Trend is very accurate identifying entry points, it is always recommended to use a support indicator in order to reconfirm the operation. Remind to look for those Assets and Timeframes which best fit to your trader behavior/need... Valid for Scalping and Long Term operations. Please, set up a Bars Chart to be able to visualize the indicator properly... ...And remind to give
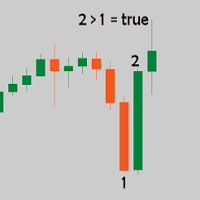
Candles length indicator is, as the name suggests, an indicator that displays the body size of each candle. The nominal size is placed below each bearish candle and below each bullish candle. How to install the Candles length Indicator on your Metatrader 4 trading plaftform? Download the indicator
Copy and paste the Candle Body Size Indicator files into following folder of your Metatrader 4 (MT4) platform: MQL4 > Indicators. You can gain access to the folders this way: File > Open Data Folder >
The indicator, Support and Resistance Detect Signal automatically detects support and resistance levels and trend lines, emitting a signal whenever the condition is met, as configured.
It reads support and resistance drawn manually or automatically built into the chart by other external indicators.
Note: Support and Resistance Detect Signal is compatible with almost all external indicators that draw on the chart, support and resistance levels, in addition to trend lines.
Discover our

Трендовый индикатор Sparta анализирует состояние рынка, фазу его движения и во многом определяет успешность трейдера в его не легкой работе. Индикатор использует в своей основе процесс выявления скорости изменения роста цены и позволяет найти точки входа и выхода с рынка. Он был создан на основе оригинальных индикаторов поиска экстремумов, индикатор хорошо подходит для определения разворота или большого резкого рывка в одну из сторон благодаря ему вы будете знать когда такое произойдет.
Многим

Trading with the Transition to quality indicator is as simple as possible, if a blue arrow appears on the chart pointing up, a buy deal is opened. In the same case, if you see a red arrow pointing down, open a sell order.
That is, everything is as simple as possible, positions are closed according to the reverse scheme, that is, as soon as a signal is received to open an order in the opposite direction from your position. For example, you opened a long position (sell), close it when a red arro

Dependence arrow indicator for forex, futures and binary options without redrawing. It gives a lot of signals, which requires additional indicators to check them. Works only on opening prices. Therefore, reliable and without redrawing. Often signals that went in the wrong direction are canceled out on the next signal.
Unfortunately, most popular indicators in practice give a huge number of false signals, since they all work without any consideration of global trends. That is why in today's con

Transition Angle is an arrow indicator for identifying potential entry points. I like it, first of all, because it has a simple mechanism of work, adaptation to all time periods and trading tactics. Suitable for trading on low timeframes because it ignores sudden price spikes or corrections in price action by reducing market noise around the average price. Works on all currency pairs and on all timeframes. Ready trading system. Take Profit is bigger than Stop Loss! Works on all currency pairs an

Ölçekleme okları yeniden çizilmez - grafikte fiyat dönüş noktalarını gösteren ve sinyallerini yeniden çizmeyen bir gösterge. Ayrıca gösterge, tüccara E-posta ve Push yoluyla sinyaller gönderir. Bu göstergenin sinyallerinin doğruluğu, M5 zaman diliminde yaklaşık %92-94 ve H1 zaman diliminde %95'ten fazladır. Böylece, bu gösterge, tüccarın işlemleri doğru bir şekilde açmasına ve daha fazla fiyat hareketini tahmin etmesine olanak tanır. Grafikteki fiyat dönüş noktaları, her tüccar için basit ve an
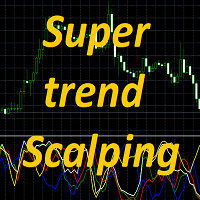
Super trend scalping , tek bir pencerede farklı döviz çiftlerinde beş Stokastik kümesidir. Trendin gücünü ve yönünü belirlemek ve ayrıca fiyat dönüş noktalarını bulmak için tasarlanmıştır. Bu gösterge ile aynı anda 5 Stokastik göstergenin korelasyonunu tek pencerede gözlemleyebilirsiniz. Ayrıca stokastik sapmayı belirleyebilir ve pazara giriş noktalarını doğru bir şekilde bulabilirsiniz. Gösterge, herhangi bir döviz çiftiyle ve herhangi bir zaman diliminde çalışmak için uygundur. Gösterge ayarl

Naked Forex Kangaroo Tail Indicator for MT4 Kangaroo Tail Indicator is a pattern recognition indicator for Forex, Stocks, Indices, Futures, Commodities and Cryptos.
The Kangaroo Tail is a multi-bar pattern.
The Kangaroo Tail pattern is very effective and is very simple to trade.
The strategy that comes with the Kangaroo Tail is based on price action.
The indicator does what it was designed for: displaying Kangaroo Tail patterns. Don't expect to follow the up and down arrows and make money
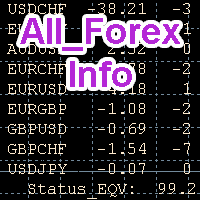
Bir tüccar için çok faydalı bir bilgi aracım var, onsuz ticaret yapmaya değmez. Bir demo hesabında deneyin ve bundan emin olun. AllForexInfo, 13 döviz çiftindeki bahislerin durumunu izlemek için bir göstergedir. Ayrıca, bu 13 döviz çifti için 5 dakikalık ve 30 dakikalık grafiklerde Hareketli Ortalama çizgisinin eğim açısına göre fiyat artış veya düşüş hızını çizginin koşullu uzunluğu şeklinde gösterir. Grafiklerin geri kalanına (!!!) ve diğer anlık bildirimlere göre grafiklerden birinde anormal

Naked Forex Tweezer Pro Indicator Tweezer Pro Indicator is a pattern recognition indicator for Forex, Stocks, Indices, Futures, Commodities and Cryptos.
The standard Tweezer is a two bar pattern. Our enhanced version is a multi-bar pattern. We filter the patterns for you so that you only get the best and most effective patterns and ignore the noise.
The Tweezer pattern is a simple and effective pattern to trade.
The strategy that comes with the Tweezer is based on price action.
The Tweez

It's a multi-symbol and multi-timeframe scanner for our indicator - ACB Breakout Arrows . With default settings, it scans for the buy/sell signals on 28 currency pairs and 9 time-frames concurrently .
Features
It can scan 252* combinations of symbols and time-frames from a single chart. Open the signal's chart loaded with a predefined template with a single click. Easy drag n drop anywhere on the chart. Real-time alerts with popup, sound, push-notifications and email alerts.
Input Parameter

Naked Forex Tweezer Standard Indicator
Tweezer Indicator is a pattern recognition indicator for Forex, Stocks, Indices, Futures, Commodities and Cryptos.
The standard Tweezer is a two bar pattern. Our enhanced version is a multi-bar pattern. We filter the patterns for you so that you only get the best and most effective patterns and ignore the noise.
The Tweezer pattern is a simple and effective pattern to trade.
The strategy that comes with the Tweezer is based on price action.
The i

Since MQL5 only limits 1 file in ex4 format that can be uploaded then you need to email to simplifyindi2022@embun.biz to get the support indicators. Without such support indicators then these indicators will not be effective.
There are 1 4 Indicators that are considered the best in this SimplifyIndicator2022 (Multi Time Frame):
This indicator was constructed after 2 years of research during the occurrence of the Covid 19 pandemic. Various indicators were used to obtain the best results. RSI

Naked Forex Big Shadow IndicatorBig Shadow Indicator is a pattern recognition indicator for Forex, Stocks, Indices, Futures, Commodities and Cryptos.
When you have a Big Shadow on your chart then this is a strong signal meaning that you might be ahead of a reversal. You can take other elements (momentum, trend, volatility, price action, fundamentals) to build a complete strategy and confirm your entries. Beware that you might not make money just following the arrows generated by the pattern reco

TTM Squeeze Indicator TTM Squeeze is an indicator to time entries based on volatility.
TMM Squeeze might well be one of the best and most overlooked indicator. It was created by famous trader John Carter and is also used by many traders like Nathan Bear.
Why is the TTM Squeeze indicator important? Because in trading correct timing entries might be more important than picking the right direction. This is a concept that is not very well understood in the trading community. Most trader think th

Inside Bar Indicator Inside Bar is a very popular candlestick pattern.
Inside Bar indicator can be used to trade Forex, Stocks, Indices, Futures, Commodities and Cryptos.
The Inside Bar indicator will search for inside bar candles pattern in the chart and will generate display them.
The indicator is also able to generate alerts in your screen or sent to your phone.
Inputs of the indicator are:
Symbol : type of char symbol to be displayed in the chart to show Inside Bar patterns CustomCode

Engulfing Bar IndicatorEngulfing Bar indicator is a pattern recognition indicator for Forex, Stocks, Indices, Futures, Commodities and Cryptos.
The Engulfing Bar indicator is an enhanced pattern of the popular Engulfing Bar to keep only the best patterns produced in the market.
The strategy that comes with the Engulfing Bar is based on price action.
Inputs of the indicator are:
Distance: distance in pixels relative to top or bottom of candle to display the arrow symbol UseAlerts (true/false):

Pin Bar Indicator The Pin Bar indicator is a pattern recognition indicator for Forex, Stocks, Indices, Futures, Commodities and Cryptos.
The strategy that comes with the Pin Bar pattern is based on price action.
Inputs of the indicator are:
Distance : distance in pixels relative to top or bottom of candle to display the arrow symbol UseAlerts (true/false): enable alerts PopAlerts (true/false): enable alerts in the popup window EmailAlerts (true/false): enable email alerts PushAlerts (true/fa
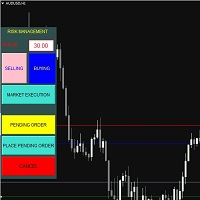
Bot for easy volume management, drag and drop convenience! This is a bot that allows users to calculate volume before entering an order. Users can flexibly enter the risk ratio of 1 order in $. Then choose to enter the immediate order or the pending order. The bot will appear lines to help users edit SL, TP and automatically calculate the corresponding volume. https://tailieuforex.com/bot-tinh-toan-khoi-luong-truoc-khi-vao-lenh-bang-duong-line/

If you want to find good trading opportunities, then you must trade near the Trend Line. This allows you to have a tighter stop loss on your trades — which improves your risk to reward . But that’s not all… Because if you combine Trend Line with Support and Resistance, that’s where you find the best trading opportunities. Now you might wonder: “So when do I enter a trade?” Well, you can use reversal candlestick patterns (like the Hammer, Bullish Engulfing, etc.) as your entry

Fisher Kuskus Indicator Fisher Kuskus is an indicator used by scalpers on low time frames like M1.
The Fisher Kuskus is now available for Metatrader platform.
Inputs of the indicator are:
Period : period to be used for calculation of the indicator PriceSmoothing : value of 0.0 to 0.99 IndexSmoothing : value of 0.0 to 0.99 The indicator can be used with any time frame.
It can be used with any class of assets: Forex, Stocks, Indices, Futures, Commodities and Cryptos. Other indicators for MT4:

HighLow Arrow Indicator HighLow Arrow is a simple indicator to be used to signal major lows and major highs in your chart.
This indicator is not intended to be used to trade alone but more as an alert that a turning point might be forming.
In this case the HighLow Arrow indicator signals that a new high or a new low is forming and that traders can prepare for seeking new signals.
The formation of the High or the Low is confirmed after 2 bars have been closed. In the meantime, the alert can b

Keltner Channel Indicator Keltner Channel is an oscillator like Bollinger Bands.
Keltner Channel is a very good tool to time entries for your strategy.
Keltner Channel displays a channel where price is supposed to stay unless we are in overbought or oversold situations.
Various strategies use Keltner Channel indicator successfully to spot overbought / oversold situations and look for reversals.
Keltner Channel indicator uses ATR to determine overbought and oversold situations. Inputs of the indi

Heiken Color Indicator Heiken Color is a simple indicator showing Heiken Ashi candles color, not in your chart but rather in a separate window.
The indicator is useful if you want to use Heiken Ashi indicator without changing your chart display.
Heiken Ashi can be used to filter signals or spot better entry after another indicator gave you a signal.
Heiken Color indicator has no inputs.
Heiken Color indicator can be used with any class of assets: Forex, Stocks, Indices, Futures, Commodities
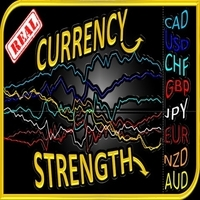
This is a real time , non-repainting , currency strength indicator with 'every' tick-level accuracy . Why wait 5 minutes, 30 minutes, or an hour to see which currency is the strongest or weakest when you can witness the currency appetite of market participants in real time. The Real Currency Strength Indicator (CSI) uses the most precise method in calculating a currency’s performance, tailored to your specific trading style . View all eight major currencies (EUR, GBP, AUD, NZD, USD, CAD,

FX Sniper Magenta Indicator FX Sniper Magenta is an exclusive and leading indicator to trade Forex with your Metatrader trading platform.
FX Sniper Magenta is able to analyze market participants behavior and to predict changes in the price direction even before movement starts.
Most indicators are lagging indicators and are useless. FX Sniper Magenta is a unique leading indicator .
The indicator displays arrows in your chart (please see screenshot attached) showing the probable directio

FX Sniper Yellow Indicator FX Sniper Yellow is an exclusive leading indicator to trade Forex with your Metatrader trading platform.
FX Sniper Yellow is able to analyze market participants behavior and to predict changes in the price direction even before movement starts.
Most indicators are lagging indicators and are useless. FX Sniper Yellow is a unique leading indicator .
The indicator displays arrows in your chart (please see screenshot attached) showing the probable direction of pri

FX Sniper Orange Indicator FX Sniper Orange is an exclusive indicator to spot situations where market has gone too far and market could reverse soon after.
The indicator displays arrows in your chart indicating probable future price action (see screenshot attached). By default, it uses orange arrows.
FX Sniper Orange never repaints. Once candle is closed signal is confirmed and arrow will never disappear.
Users of the indicator can setup alerts when new arrows are displayed in the chart.
In

MACD Divergence Finder Indicator will help you to find Divergences between your typical MACD values and the Chart Prices as potential points of actual Trend Reversion or Pull Backs to increase your positions as per the current Trend. Indicator Windows draws MACD value and Divergence arrows but not MACD Signal as it is not considered relevant to detect this kind of Classic Divergences. In some computer/VPS with old microprocessors or low RAM size, when you launch this Indicator (attach it, change

Contact me after payment to send you the User-Manual PDF File. How To Test
You can test the indicator by free version, to get the free version please contact me ( the free version scans charts in W1 and MN1 time-frames ) it's free.
123 Pattern Breakout
Trend is your friend, trade along the trend, but how do we identify trends? Sometimes the simplest methods have the best results. Pattern 123 is based on the breakout important price levels, when the price is trying to break the previous h
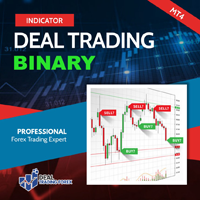
. Simple Trading System Update !!! Follow this link to see our 2023 Strategy !!! (See results and download the auto trade tool)
Description Binary Deal Trading Indicator is an indicator on MT4 for Binary Option Trading. It forecasts the overbought / oversold level, Reversal and Fractal point. This indicator will help you to decide a reversal price on any time frame (Recommend M1, M5 and M15). The expiry time is 5-15 minutes after receive signal. Features High w in rate Non-repaint signal 1

Moving VWAP Indicator Moving VWAP is an important indicator drawing the Volume-Weighted Average Price (VWAP).
The VWAP is a reference used by institutional traders and acts as a level of support / resistance.
If price is above VWAP then means market is bullish.
If price is below VWAP then means market is bearish.
It can be used to enter in the market with low risk (near VWAP) and also identify the correct direction of the market.
The Moving VWAP is as simple as a Simple Moving Average. The m

Normalized Volume 99% of indicators are based on price analysis.
This indicator is based on volume. Volume is overlooked piece of information in most trading systems.
And this is a big mistake since volume gives important information about market participants.
Normalized Volume is an indicator that can be used to confirm reversal points.
The indicator code volume with colors indicating high, normal and low volume.
You could enhance dramatically your trading system using volume analysis.
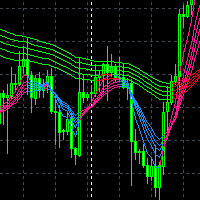
The index system is based on the research and development of MT4's own moving average index system. The moving average is divided into two groups, with a total of 10 moving average. They are short-term trend average and long-term trend average. Each trend average can adjust parameters separately to facilitate users to adjust their own people. The rise and fall of each moving average are distinguished by color, This can very well assist the current trend judgment of K line
Related parameter sett
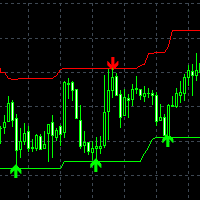
The super trade signals channel index system automatically calculates the supporting lower track and resistance upper track according to the fluctuation amplitude of K line at the present stage and the spatial position
The super trade signals channel indicator will automatically calculate the supporting lower rail line and resistance upper rail line at the position where the K line is located in real time. When the K line price reaches the supporting lower rail line, it will automatically promp
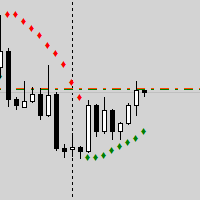
Трендовый цветной индикатор Параболик с подачей сигналов. Метод торговли 1 – Обычная покупка/продажа
Этот метод использует Parabolic SAR в качестве простого индикатора покупки и продажи, открывая длинные сделки, когда SAR ниже цены, и короткие сделки, когда SAR выше цены. Это подход следования за трендом, который обычно запаздывает при входе. Он хорошо работает на трендовых рынках и валютах, таких как GBPJPY и GBPUSD, но приводит к убыткам на рынках с колебаниями. Желательно использовать
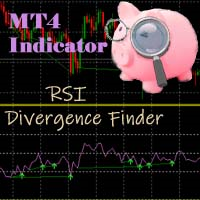
RSI Divergence Finder Indicator will help you to find Classic Divergences between your typical RSI values and the Chart Prices as potential points of actual Trend Reversion or Pull Backs to increase your positions as per the current Trend. In some computer/VPS with old microprocessors or low RAM size, when you launch this Indicator (attach it, change settings, reset or even timeframe change) as it analyze the Chart to avoid refreshing what is not changing, it is possible to experience a bit of l

Bullish Engulfing Signal For Monitoring
Valid on Weekly, Daily, H4, H1, M30 , M15
Cand Valid on signal bullish engulfing Candlestick
can sent on Telegram and android custom ID
can Check level for engulfing candlestick
we have 1 , 2 , 3, 4, 5 level
auto update after close candle stick
some to know if more question dont hestitate to contact owner if want custom user needed
===========================================================================
Version indonesia
tools ini sangat
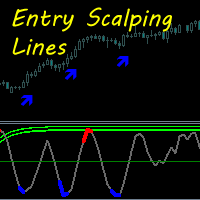
This indicator is based on a trend guide line and a special oscillator, defining entry points at the moments of potential price movement.
The indicator does not redraw. Works on any instrument. The most preferred time frames to use are M5, M15, M30, H1, H4.
The guide trend line of the indicator gives an idea about the movement of the market. When the green line crosses the zero level from top to bottom - the market is bearish when it crosses from bottom to top - bull market. The oscillator is

The system uses a simple support and resistance break of structure strategy and a provides a 80% wining trades. The probability of losing a trade is 1 out of 5 trades. The system works best on the 5min, 15min and 1hr timeframe. The best timeframe to use is the 5min and 15min chart. Works perfectly with indexes (NAS100, GER30, USA30,UK100) and gold.
https://www.youtube.com/watch?v=rW-kdg6ftmE
Entry rules: 1. Enter a trade immediately after signal shows or wait for a retracement back to the gree

Basic tool
Showing annual candle, range for Day, range for Week, range for Month, range for Year. Showing fibonacci for Day fibonacci for Week, fibonacci for Month, fibonacci for Year. Showing percent change for Day, percent change for Week, percent change for Month, percent change for Year. Showing distance of the current value the previous close for Day, Week, Month, Year.

Market Trend Catcher indicator analyzes the duration of trend movements and, with a certain development of the current trend, offers market entry points in the form of arrows with recommended profit targets. The indicator is very easy to use and does not require a lot of information to understand how it works. It has a minimum of settings and is transparent in understanding the principle of its operation, fully displaying the information on the basis of which it makes decisions on recommending e

This product shows you a different view of the market by examining the performance of volume and continuous patterns in the market, then by calculating the behavior of traders and market patterns, calculates the probability of the next movement of the market by calculations. Function.
How to receive the signal: If the candlestick is currently a bullish candlestick, according to a market scan, if the next bullish candlestick is below 5%, you can open a free trade by hitting the wisdom areas.

Fx Levels Premium Indicator Support and Resistance are important concepts in trading. Fx Levels Premium was created to easily draw important levels of support and resistance for the active trader.
The indicator will give you all important levels (support/resistance) to watch for a wide range of assets.
Trading without these levels on your chart is like driving a car for a long journey without a roadmap. You would be confused and blind.
Support and resistance levels should be used as guideline
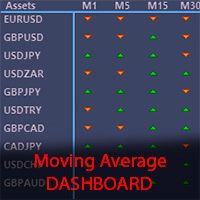
The Moving Average Dashboard indicator allows you to see the relationship between a fast and a slow moving average.
This indicator is working on multiple symbols and up to 21 timeframes. It's allows you to configure the fast and slow moving averages to whatever period, method or price is appropriate
The Moving Average Dashboard saves you time as you can use the indicator to scan multiple currency pairs or other symbols in just one window.
Installation Download the Indicator in your MT5 termi

This indicator shows your daily profit for each chart. Please let me know in the comment section or via the MQL5 chat if you find any problem, or if you want any specific features for this indicator. How to use:
Attach the indicator to the chart you want to see your profit. You can change the color of the indicators. (Currently positive figures are green, and negative are red) You can display the profit for pair it is attached, or for the whole account (all the pairs)

Breakout Impulse IndicatorBreakout Impulse Indicator is a pattern recognition indicator for Forex, Stocks, Indices, Futures, Commodities and Cryptos.
The Breakout Impulse is a multi-bar pattern.
The purpose of the pattern is to identify a fast change in momentum.
This type of change can announce the start of a big directional move.
Inputs of the indicator are:
Distance: distance in pixel relative to top or bottom of candle to display the arrow symbol MaxBars: number of bars back used to calcula

Daily Pivots Multi Indicator Daily Pivots Multi is an exclusive indicator to draw your pivots levels and much more.
Most indicators draw daily pivots for the day. Daily Pivots Multi is able to draw levels for different days.
The indicator can do the calculation for unlimited number of days backward. It means that you can draw the levels for today but also for the past days.
This is very useful if you want to study a strategy with Pivots levels over a period of time.
Another problem is that e

Dashboard Display Indicator With the Dashboard Display indicator you can create a nice, customized and professional dashboard in a few minutes.
You can create your personal dashboard and have a look at a glance at real time data.
You can use the Dashboard Display indicator with any symbol of your platform.
The inputs of the indicator are:
Symbol : symbol name as it appears in your platform (or VIX or DXY for specific symbols) DisplayName : name of symbol as it should appear in the display R

[ MT5 Version ] [ EA ] Advanced Bollinger Bands RSI MT4
Advanced Bollinger Bands RSI is an Indicator based on the functionalities of the Advanced Bollinger Bands RSI EA . The scope of this indicator is to provide a more affordable solution for users interested in the alerts coming out of the strategy but not in Autotrading. This strategy uses the Bollinger Bands indicator in combination with the RSI, the signal triggers only when both the BB and the RSI indicate at the same time overbought or o
MetaTrader mağazası - yatırımcılar için alım-satım robotları ve teknik göstergeler doğrudan işlem terminalinde mevcuttur.
MQL5.community ödeme sistemi, MetaTrader hizmetlerindeki işlemler için MQL5.com sitesinin tüm kayıtlı kullanıcıları tarafından kullanılabilir. WebMoney, PayPal veya banka kartı kullanarak para yatırabilir ve çekebilirsiniz.
Alım-satım fırsatlarını kaçırıyorsunuz:
- Ücretsiz alım-satım uygulamaları
- İşlem kopyalama için 8.000'den fazla sinyal
- Finansal piyasaları keşfetmek için ekonomik haberler
Kayıt
Giriş yap
Gizlilik ve Veri Koruma Politikasını ve MQL5.com Kullanım Şartlarını kabul edersiniz
Hesabınız yoksa, lütfen kaydolun
MQL5.com web sitesine giriş yapmak için çerezlerin kullanımına izin vermelisiniz.
Lütfen tarayıcınızda gerekli ayarı etkinleştirin, aksi takdirde giriş yapamazsınız.