YouTube'dan Mağaza ile ilgili eğitici videoları izleyin
Bir ticaret robotu veya gösterge nasıl satın alınır?
Uzman Danışmanınızı
sanal sunucuda çalıştırın
sanal sunucuda çalıştırın
Satın almadan önce göstergeyi/ticaret robotunu test edin
Mağazada kazanç sağlamak ister misiniz?
Satış için bir ürün nasıl sunulur?
MetaTrader 4 için teknik göstergeler - 116
The KT De Munyuk is a trend-based indicator that uses Parabolic SAR to identify the market direction. The indicator shows the PSAR in the form of green/red dots using a separate window. Buy Signal: When a green dot appears after a series of at least three red dots. Buy Exit: When a red dot appears on the current or next higher time frame. Sell Signal: When a red dot appears after a series of at least three green dots. Sell Exit: When a green dot appears on the current or next higher

In MetaTrader, plotting multiple horizontal lines and then tracking their respective price levels can be a hassle. This indicator automatically plots multiple horizontal lines at equal intervals for setting price alerts, plotting support and resistance levels, and other manual purposes. This indicator is suitable for Forex traders who are new and looking for chances to make quick profits from buying and selling. Horizontal lines can help traders find possible areas to start trading when the

KT XMaster Formula is a buy & sell signal indicator that works magically on most of the timeframes and currency pairs when used correctly.
The indicator uses calculations based on moving averages, RSI, and MACD. It is usually appropriate for scalping and trend trading - whether you are a novice or an experienced trader, the signals generated by this indicator are simple to understand and implement.
Overview The indicator comprises green and red dots arranged in wavy lines. These dots corre

KT Forex Trend Rider uses a trend following algorithm developed specifically for the Forex market to provide reliable buy & sell signals across the major currency pairs. It works best on major FX pairs and all time-frames.
Features
It comes with a Multi-Timeframe scanner that can search for upcoming signals across all the time-frames. It comes with four preset profiles to facilitate trading for scalpers, tick-trend, swing, and trend traders. It marks the potential reversal points in the mark
Gold Scalping Indicator - an indicator for intraday trading on XAUUSD gold. The indicator determines price reversal points and draws signals on the chart. The indicator also sends signals to the phone. When the indicator draws a red dot, it means that the price may turn down now. When the indicator draws a blue arrow, it means that the price may turn up now. Given this information, every trader will be able to build an effective trading system on gold. Gold is a very liquid instrument that is w

The BSI stands for Bar Strength Index. It evaluates price data using a unique calculation. It displays readings in a separate window. Many financial investors mistake this indicator for the Relative Strength Index (RSI), which is incorrect because the BSI can provide an advantage through its calculation method that the RSI indicator does not. The Bar Strength Index (BSI) is derived from the Internal Bar Strength (IBS), which has been successfully applied to many financial assets such as commodit

The KT Tether Line is a trend-following tool consisting of three indicators that work together to generate trading signals. It can correctly identify market trends while signaling trade entries. It was first introduced by Bryan Strain in the Stock & Commodities magazine in 2000 in "How to get with the trend and out at the end."
The Concept
When a market trend is confirmed, the most challenging part is determining the timing of the entries. This indicator alerts you to potential trend reversal
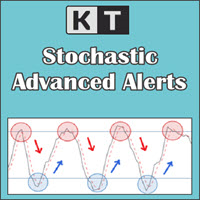
KT Stochastic Alerts is a personal implementation of the Stochastic oscillator that provide signals and alerts based on six custom events: Bullish Crossover: When Stochastic main line cross above the signal line. Bearish Crossover: When Stochastic main line cross below the signal line. When Stochastic enter in an overbought zone. When Stochastic exit from an overbought zone. When Stochastic enter in an oversold zone. When Stochastic exit from an oversold zone.
Features
A perfect choice for
A very good indicator for Experienced and Professional Traders. A practical approach to trading. Easy to understand. A helping tool for traders looking for price movements .
Signals: Signal Number 1: When yellow line which is a signal line crossing the zero line towards downward direction is a selling opportunity. Signal Number 2:
When yellow line which is a signal line crossing the zero line towards upward direction is a buying opportunity.
Current strength of the 8 major currencies My #1 Utility: includes 65+ functions, including this indicator | Contact me if you have any questions The indicator is displayed in a separate window, it can be moved to any place on the chart. In the input settings you can adjust: Interface theme : dark / white; Prefix and Suffix, if the currency pairs on your broker have it:
(e.g. if Symbol is "EURUSD .pro ", please set " .pro " as a Suffix); Panel size Font size
Supply / demand zones: observable areas where price has approached many times in the past. My #1 Utility: 65+ features, including this indicator | Contact me for any questions | MT5 version The indicator shows where the price could potentially be reversed again. Usually, the more times the price has been rejected from the level, the more significant it is. In the input settings you can adjust: Enable or disbale Weak zones; Show or hide zone description; Font size; Set the basic color
Absolute volatility for each day for the last 4 weeks My #1 Utility: includes 65+ functions, including this indicator | Contact me if you have any questions The indicator is displayed in a separate window, it can be moved to any place on the chart. In the input settings you can adjust: Interface theme : dark / white; Calculation method: price, pips, points, % change;
Panel size Font size
That is my master piece invented new Forex indicator Copyright 2010 to 2100 (316009) for Sami A. Saydam. This indicator is showing the real Support and Resistance levels in dynamical ways as movable red lines with time, also works on all time charts' intervals. The price movements are strongly respecting those red lines and either confirmed break them or just touching them and can't break them up or down then move toward the right directions. This new techniques are the real alerting system ca

This indicator takes input from the RSI, combined with a trend filter. Great for scalping. Does not feature any alerts and is best used manually. Settings: TrendFilterPeriod RSIPeriod Set these parameters to your preference. How to use: Attach to any chart with default settings. Can be used on any time frame. If used on lower time frames, check higher time frames too. Buy : - Wait for blue histo color to cross above level 50, then open buys. **Best results when checking the higher time frames to

XFlow shows an expanding price channel that helps determine the trend and the moments of its reversal. It is also used when accompanying transactions to set take profit/stop loss and averages. It has practically no parameters and is very easy to use - just specify an important moment in the history for you and the indicator will calculate the price channel.
DISPLAYED LINES ROTATE - a thick solid line. The center of the general price rotation. The price makes wide cyclical movements around the

TPM Cross (trend power moving cross) - is a trend following strategy based on custom signal points. Indicator consists from main custom moving chart line and trend power line. Indicator defines up and down movements by it's trend power and custom moving direction. When current market's trend looses it's power and opposite trend starts - power trend line crosses moving and indicator plots an arrow. Main indicator's adjustable inputs : movingPeriod - period of moving line trendPeriod - period

Impulse fractals indicator - is counter-trend oriented complex market fractal pattern. Market creates bull/bear impulse, trend starts, fractals on impulsed wave are an agressive pullback signals. Buy arrow is plotted when market is bearish and it's impulse showed up-side fractal, and sell arrow is plotted when market is bullish and it's impulse showed dn-side fractal. Main indicator's adjustable inputs : impulsePeriod - main period of impulse histogram filterPeriod - smoothes impulse accordi
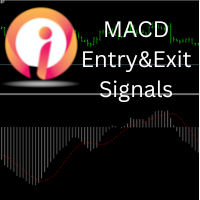
This indicator will show Entry and Exits using MACD and Moving average crossover. User can change settings to find best results from back testing. Profits and losses on candle close price is calculated and shown on screen of chart. Here any MACD settings and any Moving average crossover exit settings on various charts and various timeframes can be used. Watch video for few tests performed. Best wishes for trading.
Are you looking for a reliable support-resistant indicator to help you trade? Look no further! Our support resistance indicator is designed to make your trading experience easier and more efficient. With our indicator, you can find high-probability support and resistant zones and stay on top of the market, so you can take high-probability trades. Try it now and see the difference! support and resistance is the key element in trading just by identifying support and resistance correctly and using

The purpose of the Combo OnOff indicator is combine differerent tecniques and approachs to the market in order to spot signals that occur simultaneosly. A signal is more accurate if it is validate from more indicators as the adaptive expectations can be used to predict prices.The On-Off feature and alarms help to look for the better prices to enter/exit in the markets
Moving Averages are statistics that captures the average change in a data series over time
Bollinger Bands is formed by upp

Triple trend index is the manual trading system/indicator. It looks for trend reversal points according to main trend index datas. Indicator represents 4 lines. 3 lines shows trend power by main market's parametres. 4th line (OrangeRed) is the main index. When line is above zero level - market is bullish, value below zero show bearish pressure. Indicator "looks" for weak places(reversal points) on bullish market to plot a sell arrow and weak places(reversal points) on bearish market to plot a

Floating peaks oscillator - it the manual trading system. It's based on Stochastik/RSI type of oscillator with dynamic/floating overbought and oversold levels. When main line is green - market is under bullish pressure, when main line is red - market is under bearish pressure. Buy arrow appears at the floating bottom and sell arrow appears at floating top. Indicator allows to reverse signal types. Main indicator's adjustable inputs : mainTrendPeriod; signalTrendPeriod; smoothedTrendPeriod; tre
蜡烛剩余时间和价格根据行情的涨跌,变换不同颜色.当行情发生变化,就会发生颜色变更,在涨时为一种颜色,在跌时变为另外一种颜色。可以根据颜色的变化知道这一跳是涨还是跌。如果一直为同一颜色,说明现在正在加速进行涨或者跌。 蜡烛剩余时间和价格根据行情的涨跌,变换不同颜色.当行情发生变化,就会发生颜色变更,在涨时为一种颜色,在跌时变为另外一种颜色。可以根据颜色的变化知道这一跳是涨还是跌。如果一直为同一颜色,说明现在正在加速进行涨或者跌。 蜡烛剩余时间和价格根据行情的涨跌,变换不同颜色.当行情发生变化,就会发生颜色变更,在涨时为一种颜色,在跌时变为另外一种颜色。可以根据颜色的变化知道这一跳是涨还是跌。如果一直为同一颜色,说明现在正在加速进行涨或者跌。

Easy Technical Indicator is a powerful tool to detect the market trend and its strength . in addition, The signal Line reduce volatility and convert main trends to reliable Buy or Sell Signals --- Contact me in messages for free gift after purchase! --- HISTOGRAM:
It shows the main trend of the market. A histogram above zero means that the market is bullish A histogram below zero means that the market is bearish The height of the histogram bars indicates the strength of the trend weak,

Trend speed vector - is the oscillator for manual trading. System measures trend direction and it's speed. Histogram shows 4 colors: Lime --> Strong up movement with good gain speed; Green --> Up movement with low gain speed Red --> Strong down movement with good gain speed; Orange --> Down movement with low gain speed Green and Orange histograms show weak market's movements and thуese places excluded from signal points. Buy arrow is plotted during strong down movement when bearish gain speed i

Floating gain meter is the manual trading system that works with local trends and it's scalping. Histogram represents bull/bear floating trend gain. Green color histogram shows choppy market with bullish pressure, Orange - shows choppy market with bearish pressure. Lime and Red colors shows "boiled" places in market. As a rule buy arrow is placed after strong Down movement when it's power becomes weak and choppy market starts. And sell arrow is plotted after strong Up movement when it's power

Index name: Double Joker
Indicator description:
1. Suitable for EURUSD, low difference account.
2. The yellow line and the red line reach above 90+and cross 90 at the same time, which is the sell signal.
3. The yellow line and the red line reach below 5 and cross 10 at the same time, which is the buy signal.
4. The profit stop and loss stop must be set.
5. The combination of M1 and M5 is more effective.
This indicator shows the current direction of the market, the moments of reversal and the levels the market can reach. The development is based on years of experience and on the most advanced concepts of fractal analysis, so it adapts to every market and every time frame. The most impressive property is the ability to draw the levels that the market can reach with dozens of bars in advance.
MACD EXPLANATION Moving average convergence divergence (MACD, or MAC-D) is a trend-following momentum indicator that shows the relationship between two exponential moving averages (EMA's) of a price. The MACD is calculated by subtracting the 26-period exponential moving average (EMA) from the 12-period EMA. macd is one of the best momentum indicators macd is used by a lot of professional traders when it comes to continuous trade macd is the best choice if used properly even a ne

Pullback points indicator - is the manual trading system, that shows most popular market prices. Indicator measures bull/bear waves pressure and looks for "consensus" prices. As a rule these points are crossed up and down very often and opened trade has several chances to be closed in positive zone. Mainly, such points is the good base for "common profit" types of strategies. Indicator also represents "common profit" scalping method of trading as default one. Main Indicator's Features Signa

Noize Absorption Index - is the manual trading system that measures the difference of pressure between bears forces and bulls forces. Green line - is a noize free index that showing curent situation. Zero value of index shows totally choppy/flat market.Values above zero level shows how powerfull bullish wave is and values below zero measures bearish forces.Up arrow appears on bearish market when it's ready to reverse, dn arrow appears on weak bullish market, as a result of reverse expectation. S

Scanner and Dashboard for Money Flow Index for MT4 The Money Flow Index (MFI) is a technical oscillator that uses price and volume data for identifying overbought or oversold signals in an asset. It can also be used to spot divergences which warn of a trend change in price. The oscillator moves between 0 and 100. Advantages of the Scanner: - Full Alert Options. - Multi Timefrare - Works for all instruments including Currencies, Indices, Commodities, Cryptocurrencies and Stocks. - Fully customis

ONLY FOR FX MAJOR PAIRS Neural Oscillator is a later evolution of Neuro Scalper found here https://www.mql5.com/en/market/product/72342 It is a cluster signal, a better oscillator than a more traditional one like MACD. Neural Oscillator adds a divergence with momentum type signal compared to Neuro Scalper. Attach to charts. Entry arrows are at 100 for buy and -100 for sell. Example set up in the comments. Simple rules. Trade this as a stand alone system. How to trade: Trade during Act

The Bollinger Band is a strategy that has become one of the most useful tools for spotlighting extreme short-term price moves. Bollinger Bands consist of a centerline and two price channels or bands above and below it. The centerline is typically a simple moving average while the price channels are the standard deviations of the stock being studied. The bands expand and contract as the price action of an issue becomes volatile (expansion) or becomes bound into a tight trading pattern (c

Szia! Egy indikátorral. Több idő gyertyájának kirajzoltatása egy charton. Különböző színek rendelhetők a long és short gyertyákhoz. Vonal vastagsága állítható. A gyertya kitöltése engedélyezhető. Hello! With an indicator. Drawing multiple time candles on a chart. Different colors can be ordered for long and short candles. Line thickness can be adjusted. Filling the candle can be allowed. Videó: https://www.youtube.com/watch?v=-9bequnAw-g& ;ab_channel=GyulaKlein

"Pattern 123" is an indicator-a trading system built on a popular pattern, pattern 123.
This is the moment when we expect a reversal on the older trend and enter the continuation of the small trend, its 3rd impulse.
The indicator displays signals and markings on an open chart. You can enable/disable graphical constructions in the settings.
The indicator has a built-in notification system (email, mobile terminal, standard terminal alert).
"Pattern 123" has a table that displays signals from

PLEASE NOTE: You can customize the settings of all 3 EMA as per your requirement. The accuracy will change as per your settings.
100% Non repaint Pre-alert (get ready) signals Non-delay indications 24/7 signals 100% No lag No recalculating Lifetime license This is a EMA crossover indicator and its 100% non repaint indicator. The EMA_1 and the EMA_2 is based on which signal is generated. EMA_3 is a Higher EMA value which will remain below or above the candle (market) to identify the trend. M
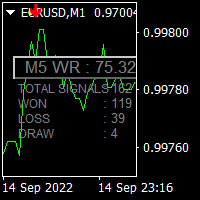
Hi Trader, We are strategy development for Binary and Forex tools, our product have success for binary trading 1 min - 2 min experation. At the moment most of Binary Broker apporev trading with experation conctract 15 minutes and more. We launch MilowLima Indicator for trading 5 minutes to 15 minutes experation is mean can trade from 5 minutes - 15 minutes. Specification of MilowLima trading binary option: Work with specifict time so default setup for Broker use Time Zone GMT+3 auto DST. (exampl

MACros is based on Exponential Moving Average Crossover:
It can be used for: All Pairs: Forex, Cryptocurrencies, Metals, Stocks, Indices. All Timeframe All Brokers All type of Trading Style like Scalping, Swing, Intraday, Short-Term, Long-Term etc. Multiple Chart
***MT5 Version -->> https://www.mql5.com/en/market/product/87474
Notification Setting: All type of notifications and Pop-Up available with this Indicator. (Can manually ON/OFF the notification as per requirements.)
Special No

What Is The Buy OR Sell MT4 Indicator? As the name suggests, the Buy-Sell Indicator is an indicator that tells traders about when to take the buy and sell position on the Forex price chart. This tool is a preference of many traders because it can provide solid indications of the trend and its reversals. In addition, it helps them simplify the hassle of choosing one or more indicators because this one tool alone is enough to provide them with a straight answer. When you apply this indicator

MMD'den Elmas
Diamond by MMD, fiyat davranışı için önemli olan yerleri tanımlayan gelişmiş bir göstergedir. Bu gösterge - herhangi bir zaman diliminde - grafikte fiyat reaksiyon bölgelerini algılar ve işaretler. MMD metodolojisindeki bilgi piramidinin unsurlarından biri olan elmaslar, çok katı koşulları karşılayan mumlardır. İki ana elmas türü vardır: - standart elmas - ters bunama. Bu modellerin her ikisi de otomatik olarak tanımlanır ve tablo üzerinde işaretlenir. Gösterge elmasları, örneği
Time Line by MMD is a simple indicator that supports historical data analysis and trading on statistical models that follow the MMD methodology.
Start Time - specifying the time when we start analyzing and playing the MMD statistical model Time Duration in minutes - duration of the model and its highest effectiveness (after the end of the line, the price returns - statistically - to the set level) Lookback days - the number of days back, subjected to historical analysis Base Time Frame - the

The Squeezer indicator simply draws ascending lines with Sell signal in the downtrend and descending lines with Buy signal in the uptrend to catch the pullbacks and sniper entries. This is a common successful trading strategy being used by many successful traders, and the good thing about this strategy is that it works with all time frames. The difference is in the take profit level between them. Buy / Sell signals are triggered at the close of the current candles above / below the ascending or
Shows price reversal points on the chart. Works on a period of 1 minute. The red arrow indicates that the price will go down now, and the blue arrow shows that the price will go up now. The accuracy of the signals is up to 93% depending on the currency pair. Works on all currency pairs, including the metals gold and silver. The indicator analyzes the current price position relative to the price range for a certain period in the past. The indicator optimizes its data using mathematical modules a
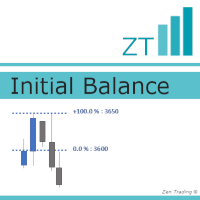
Initial Balance is a concept for the first hour of a trading session, lowest(starting) to highest point, that often determines important support / resistance for the next hours. It is based on Fibonacci levels and offers very relevant levels of reaction. Nowadays, it's mainly used for the first hour BEFORE the open. --------------- The advantage of this indicator lies here : - you could define by yourself the period for YOUR Initial Balance (first hour of a trading session, one hour before the o
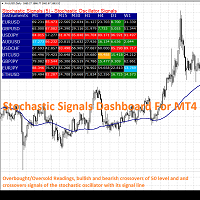
Stochastic Signals is a simple dashboard type indicator that displays the values of the stochastic oscillator on various instruments and time frames chosen by the user. The stochastic is usually used in many trading strategies, especially in countertrend systems when the price reaches overbought/oversold conditions. In addition, this indicator can be configured by the trader to show signals when the stochastic oscillator is in an overbought/oversold condition, when it crosses these levels or whe
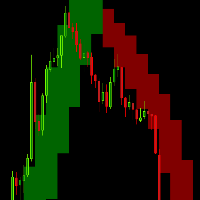
Anyone who is experienced in trading knows that longer time signals are trend signals. That's why it's always good to follow the trends of longer times to make a good trade.
With that in mind, I created the trend indicator in the background
Indicator Parameters TFBar - TimeFrame BackgroundEnabled - Enable Background NumbersOfBars - Numbers of Bar draw ColorUp - Color Up ColorDown - Color Down Smoothing - Heiken-Ashi Smoothing Average

Forex Flow Equalizer is an indicator that helps to reduce 'noise' in forex price movements. Visit https://www.mql5.com/en/blogs/post/751167 for more detailed explanation. It is programmed to enhance traders' focus, and capacity to monitor or manage multiple instruments of interest on preferred timeframe without their minds being over loaded with data or information, thereby, saving them the mental strength for more important trading decision making. Range Mode: is for traders who like to trade

Sinir Bantları bir ölçekleme göstergesidir. Aşırı satım ve aşırı alım seviyeleri için 2 farklı sapma bandı bulunmaktadır. Renkli mumlar, trendin sapmaları geçip güçlü bir trend gösterdiğini veya renkli mumların sapmalarda durup ortalamaya dönüp dönmediğini belirlemek içindir. Bu EA, bir tür regresyon göstergesi ticaret aralıkları ve fiyat kırılmalarıdır.
Neural Bands 2.0, eklenmiş yeniden boyama oklarına sahip değil.
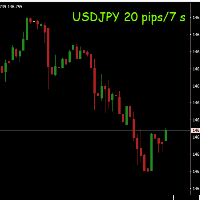
This indicator allows you to view the speed of price movement based on the time set in seconds
Indicator Parameters VisorVelocity_Price_Up_Color - Color to UP price VisorVelocity_Price_Down_Color - Color to Down price VisorVelocity_Price_Zero_Color - Color to Zero VisorVelocity_Price_X_Position - Posicion horizontal in chart VisorVelocity_Price_Y_Position - Posicion vertical in chart VisorVelocity_Price_Size - Size price font VisorVelocityTime - Time to calcule
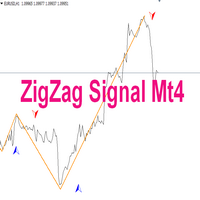
Indicator description: Indicator - ZigZag Signal is created on the basis of a well-known and popular indicator - ZigZag. The indicator can be used for manual or automatic trading by Expert Advisors. 1. The ZigZag Signal indicator has alerts of different notifications for manual trading. 2. If used in Expert Advisors, the indicator has signal buffers for buying and selling. You can also prescribe and call the indicator as an external resource and other settings and applications: (email me in a

This indicator uses 2 trend filters. Great for scalping. Features alerts Settings: TrendFilterPeriod1 TrendFilterPeriod2 How to use: Attach to any chart with default settings, or set to your preference. Can be used on any time frame. If used on lower time frames, check higher time frames too. Buy : - Blue histo color. Sell : - Red histo color. Or backtest and use as you see fit for your strategy. Best results on Major Pairs, but can also be used on other pairs (Metals, Minors).
Important to no

This tool draws all the pivot point lines on chart. It is important to remind/tell you that there are 5 pivot method according to BabyPips website. All these methods have their unique mathematical formula. 1. Floor Method. 2. Woodie Method. 3. Camarilla Method. 4. DeMark Method. 5. Fibonacci Method. What makes this pivot tool unique is that you can click the "Fibonacci" button to select the pivot method you want. You can click the "Monthly" button to select the Period you want to use for the piv

FX Arrow Reversal, ölçeklendirme eğilimlerine yönelik basit, karmaşık olmayan bir ok göstergesidir. Esnaf seçiminde isteğe bağlı yöntemler kullanılır. Trend çizgileri, osilatörler, hareketli ortalamalar, kanallar veya tüccarın istediği diğer yöntemler. Gösterge, herhangi bir zaman diliminde ve herhangi bir varlık üzerinde çalışır. Sermayeyi korumak için zararı durdur özelliğini kullanın.
Göstergenin çalışma şekli, yakınsamalardan, sapmalardan ve trend momentumundan türetilmiştir. ATR, gös
Promotion $66 lifetime for you.
The principle of this indicator is very simple: detecting the trend with Moving Average, then monitoring the return point of graph by using the crossing of Stochastic Oscillator and finally predicting BUY and SELL signal with arrows, alerts and notifications. The parameters are fixed and automatically calculated on each time frame. Example: If you install indicator on EURUSD, timeframe M5: the indicator will detect the main trend with the Moving Average on this

The Trend TRN trend indicator works using a special algorithm and a set of indicators. It finds the current trend based on many factors.
Trend TRN entry points should be used as potential market reversal points. The indicator works using the cyclic-wave dependence function. Thus, all entry points will be optimal points where the movement changes.
A simple and convenient indicator. The user can easily see the trends. You can use this indicator alone or in combination with other indicators ac

Introducing the trend indicator! Ready trading system. The principle of the indicator is to automatically determine the current state of the market when placed on a chart. The indicator analyzes market dynamics for pivot points. Shows the favorable moments of entering the market with stripes. Can be used as a channel indicator or level indicator! This indicator allows you to analyze historical data, and on their basis display instructions to the trader on further actions. To find out how to dete

Elevate Your Trading with the Ultimate Market Visualization Indicator! Imagine having the power to visualize price movements across multiple time frames, clearly identify Bull and Bear Market periods, and gauge their strength—all within a single, intuitive tool. With our revolutionary Market Visualization Indicator, you can do just that and more. Why This Indicator Is a Must-Have: 1. Multi-Time Frame Mastery:
Stop limiting your analysis to one time frame. Our indicator allows you to seamlessly

Piyasa Dinamikleri, trend ölçeklendirme içindir. Mavi al ve kırmızı sat. Çizgiler, fiyat konsolidasyonu alanlarıdır ve normal çubuk mumlara karar verilmez. Fiyat, destek ve direnç çizgileri arasında konsolide olacak ve ardından alanlardan fiyat hareketi kopacak. Üstte veya altta kafa derisi için resim alanları ve ana trendleri veya kafa derisi için günlük ticareti takip edin.

A useful scanner/dashboard that shows the RSI values for multiple symbols and time-frames.
It can be easily hidden/displayed with a simple click on the scanner man top left of the dashboard.
You can input upper and lower RSI values and the colours can be set to show when above/below these values. The default values are 70 and 30. There are also input colours for when the RSI is above or below 50 (but not exceeding the upper/lower levels
Symbols and time-frames are input separated by comma
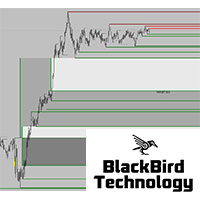
Dear Traders, check out my new multi level market liquidity indicator : https://www.mql5.com/en/market/product/73098
Many of you have been trading very good with this indicator, thanks for the support and positive feedbacks ! For more information about market liquidity, a manual on how to use this indicator please send me a message. A lot of information can be found on the net. (search liquidity trading/ inner circle trader)
https://www.youtube.com/watch?v=yUpDZCbNBRI
https://www.youtube.c
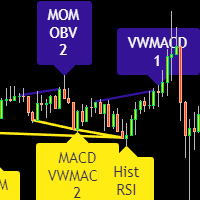
Divergence indicator 10 different indicators. Finding and displaying classic and hidden divergences.
Indicators in which divergences are searched: MACD MACD Histogram; RSI; Stochastic; CCI; momentum; OBV; VWmacd; Chaikin Money Flow; Money Flow Index. This is a replica of the indicator from the tradingview resource, adapted for the MT4 terminal.
MT5 version available here: https://www.mql5.com/en/market/product/87879
Settings: Bars in history for analysis - number of bars for analysis; Di

Bu yazılım aracı, özelleştirilebilir beş renk arasından seçtiğiniz yatay trend çizgileri ve dikdörtgenler oluşturma sürecini kolaylaştırmak için tasarlanmıştır.
MT5'te hassas yatay trend çizgileri çizmek zor olabilir ancak bu göstergeyle bunları tercihlerinize uygun renklerde zahmetsizce oluşturabilirsiniz.
Ayrıca aracımız, çizdiğiniz yatay çizgilerle ilişkili fiyat seviyelerinin net bir şekilde görüntülenmesini sağlar.
Geri bildiriminize değer veriyoruz ve bu aracı ticari ihtiyaçlarınız
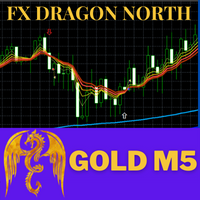
FX Dragon North Indicators is a trend indicator designed specifically for gold and can also be used on any financial instrument. Recommended time frame (XAUUSD:M5,M15,M30,H1,H4.) , (Forex: H1,H4,DAY) Can be combined with EA FX Dragon North X to increase the accuracy of EA FX Dragon North X and make more profit. ... SETTINGS Alerts - on off audible alerts. E-mail notification - on off. email notifications. Puch-notification - on off. Push notifications.

Please follow the "How To Trade" instructions exactly for best results Wycoff theory is vastly used by institutional traders but when it comes to retail traders the concept isn't well understood by most. It is even more difficult to implement in intraday & swing trading. This No REPAINT indicator helps you in analyzing the market cycles and plots buy/sell signals at the start of trending phase. It studies the market strength of bulls and bears and does a effort Vs reward matrix calculation befor

Offer 249 down from 350 for the next 3 copies. then back to 350 $
Are you tired of using outdated indicators that leave you guessing where to set your profit targets? Look no further than the AK CAP Opening Range Breakout Indicator. This powerful tool is backed by a US patent and has already helped countless traders pass funded challenges like FTMO. We use it daily on our prop traders and internal funds, and now it's available to you as well. The calculation behind the indicator is incredibly

Merhaba; Bu gösterge sizlere en hacimli sekiz para biriminin oluşturduğu 28 çapraz paritenin güç matrixini sunar.Bu güç tablosu sayesinde en iyi trend gücünü ve yönüne sahip pariteleri gösterir.Gösterge tablosu basket trading yöntemi sunar.Böylece belirli kolerasyona sahip pariteler arasında işlem yaparak ortalama kazanç sağlayabilirsiniz. Girdi parametre açıklamaları: Note_1:Gösterge tablosunun hangi yöntemi kullanarak kolerasyonu bulacağını ifade eder. Algo:Note_1 yöntemlerini seçmenize olana

This indicator is based on the Weis wave principle of wave volume. Below are few features of the indicator It draws the wave on the chart while the accumulated volume per wave in a different window at the bottom of the chart You can configure the turning point move It displays the accumulated volume (in thousands, eg for 15000 volume it will show 15) at the end of each wave You can also configure to show number of candles in the wave along with the wave volume The indicator calculates the distin

Displays multiple trend indicators on the main chart. Great for scalping. Settings: LWMA SMA SSMA EMA ADX (red and blue dots), and PSar Alerts for ADX crosses. How to use: Can be used on any time frame. Buy : - Blue dot first. - Then PSar and 3 MAs cross below price. **Best results when confirming the higher time frames too.
Sell : - Red dot first. - Then PSar and 3 MAs cross above price. **Best results when confirming the higher time frames too. Or backtest and use as you see fit for your str

Algo Trading Indicaor
With this indicator , you’ll have zones and trends that hight probability the price will reverse from it. so will gives you all the help that you need
Why should you join us !? 1-This indicator is logical since it’s working in previous days movement , to predict the future movements.
2-Algo trading indicator will help you to draw trends which is special and are too strong than the basics trend , trends will change with the frame time that you work on .
3-We can
MetaTrader Mağaza, ticaret robotları ve teknik göstergelerin benzersiz bir deposudur.
Yatırımcılara sunduğumuz benzersiz hizmetler hakkında daha fazla bilgi edinmek için MQL5.community - Kullanıcı notunu okuyun: ticaret sinyallerini kopyalama, freelancerlar tarafından geliştirilen özel uygulamalar, ödeme sistemi aracılığıyla otomatik ödemeler ve MQL5 Bulut Ağı.
Ticaret fırsatlarını kaçırıyorsunuz:
- Ücretsiz ticaret uygulamaları
- İşlem kopyalama için 8.000'den fazla sinyal
- Finansal piyasaları keşfetmek için ekonomik haberler
Kayıt
Giriş yap
Gizlilik ve Veri Koruma Politikasını ve MQL5.com Kullanım Şartlarını kabul edersiniz
Hesabınız yoksa, lütfen kaydolun
MQL5.com web sitesine giriş yapmak için çerezlerin kullanımına izin vermelisiniz.
Lütfen tarayıcınızda gerekli ayarı etkinleştirin, aksi takdirde giriş yapamazsınız.