Watch the Market tutorial videos on YouTube
How to buy а trading robot or an indicator
Run your EA on
virtual hosting
virtual hosting
Test аn indicator/trading robot before buying
Want to earn in the Market?
How to present a product for a sell-through
Technical Indicators for MetaTrader 4 - 116

https://c.mql5.com/31/761/best-trend-indicator-logo-200x200-8493.png The indicator uses a solid line of red and green to reflect the myriad changes in market prices. The green line indicates a period of rising market prices and the red line indicates a period of falling market prices. Solid line color change indicates that the market has changed and the market is likely to reverse! It is recommended that you use this indicator on your daily K-chart. This indicator is not suitable for you to do
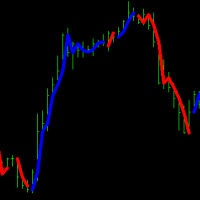
Trend indicator to determine the direction of the trend. The indicator scans the market looking for sharp price reversals and shows the trader where a bearish or bullish trend begins. When the market moves sideways, the indicator stops drawing signal lines. Thanks to this indicator, each trader is able to quickly determine the direction of the market and open the right orders in the direction of price movement. You can also analyze the market on different timeframes, confirming the signals of a

Night Ghost - Arrow indicator for binary options.
This is a reliable assistant to you in the future!
- No redrawing on the chart -Works great on EUR/USD currency pairs! -Indicator accuracy up to 90% (Especially at night)
-No long setup required (Perfectly set up for Binary Options)
- Not late signals
- The appearance of a signal on the current candle
-Perfect for M1 period (No More!)
- Eye-friendly candle color (Red and Blue)
-Installed Alert
Working with it:
- Blue arrow shows signa

Forex Gump Trend is a universal indicator for highly effective determination of the trend direction. If you identify the trend correctly, this is 95% of trading success, because you will be able to open trades in the direction of the price movement and benefit from it. The Forex Gump Trend indicator helps traders with a high degree of efficiency to determine the current trend direction, as well as trend reversal points. The direction of the trend is shown by colored lines on the chart, and the
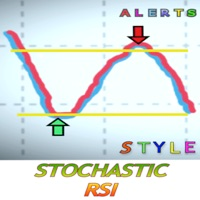
What is Stochastic RSI? The Stochastic RSI (StochRSI) is an indicator used in technical analysis that ranges between zero and one (or zero and 100 on some charting platforms) and is created by applying the Stochastic oscillator formula to a set of relative strength index (RSI) values rather than to standard price data. This version includes alerts to do not miss really good opportunities. You set the parameter when you want to receive a signal buy order or signal sell order. In order to receive
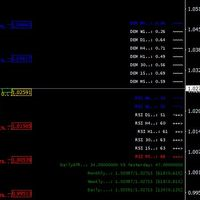
I decided to add parallel function with DeMarker to free version of my indicator with RSI MTF. it is good for scalping or for weekly trading and looks as universal fx-toy. In menu you can turn on daily percentage gain info, it is good for crypto as for me, weekly and monthly gains also included as informers. Short ATR helps to determine when price was stopped and entry for pulse pump/dump. The filter of numbers of RSI can be tuned for overbought/oversold values with colors you needed. Examp

Currently switched to the 4 hour chart - but use other time frames for confirmation. :-) I change my main time frame based on the market movement at the time. The Hurricane Forex Indicator is a multi time frame indicator that includes such things as Trade Notifications, Trade Calculator, Momentum Indicator, risk reward and much more. We have a free Trade room for our users as well. Please check out the video for full details of how this indicator works as it has over 15 years worth of developme
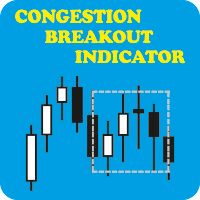
CONGESTION BREAKOUT INDICATOR: When you see a sideways price movement in a meaningless market, what goes through your mind? Is it a danger, an opportunity or completely a vacuum? Let's see if we can avoid the latter and focus on using it to our advantage. The ability to read price action through the display of rectangles on the chart could be the boost you need to achieve your trading goals. What is congestion? Congestion is a market situation where the price is trading around a particular leve

BSA indicator is a ZigZag based indicator. This indicator is used to find the reversal level of the price. You can use the existing risk ratio and calculation timeframe in the entries by optimizing them according to your usage preference. In lower time frames, the indicator can repaint. For healthier results, you can detect the least repainting by observing for a while according to the graphic you will apply.
Simple Dark Holder Tool
Arrow indicator for Forex and binary options
Already tuned for the best signals
Multicurrency and multitimeframe
Works on all currency pairs as well as raw materials, etc.
Works on the author's strategy and combines 3 indicators that show good results
Does not draw or redraw
The signal appears clearly at the opening of the candle
blue up
Red down
Alert is also built into it for your convenience.
Test and watch a video on how it works

Weddell Pro is a good trading tool that is suitable for both a beginner and an experienced trader.
It can be used both separately and combined with other strategies and indicators
Configured for currency pairs was tested several times on cryptocurrency but did not show a high result
Currency pairs USD/EUR AUD/CAD GBP/USD Showed itself very well here
The percentage of correct transactions is above 68%, which does not make it perfect and bad
Doesn't draw or disappear
The red arrow shows a t

Welcome to Upside Down !
Upside Down is a powerful indicator that gives the perfect trading opportunities and a clear indication of the market. Upside Down has been created to be as simple as possible. Arrows are calculated based on ASC Trend and customs indicators . Signals appear without delay at the end of a candle, if it has tested the level. The signals do not overdraw.
THE BENEFIT:
Easily to enter in buy position/sell position Intuitive directional arrows by colors
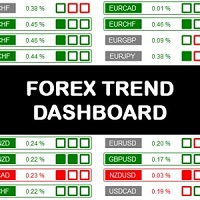
The Forex Trend Dashboard is a truly exceptional tool for analyzing and operating the choice of which exchange to try to trade. The analysis of currency baskets allows you to better understand the real situation of the market and better evaluate your own operational ideas. The dashboard analyzes the trend over different time horizons such as: daily, weekly and monthly. The resulting considerations are very simple, the session opening price and its strength condition are analyzed by recognizing t
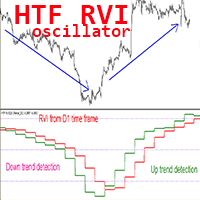
Crypto_Forex Indicator HTF RVI Oscillator for MT4, No repaint. Upgrade your trading methods with the professional HTF RVI Oscillator for MT4. H TF means - H igher Time Frame. RVI is one of the best oscillators for trend change detection and entry from Oversold/Overbought areas. This indicator is excellent for Multi-Time Frame trading systems with Price Action entries from OverSold/Bought areas . HTF RVI Indicator allows you to attach RVI from Higher time frame to your current

Support And Resistance Screener is in one level indicator for MetaTrader that provide multiple tools inside one indicator. The available tools are : 1. Market Structure Screener. 2. Bullish Pullback Zone. 3. Bearish Pullback Zone. 4. Daily Pivots Points 5. weekly Pivots Points 6. monthly Pivots Points 7. Strong Support and Resistance based on Harmonic Pattern and volume. 8. Bank Level Zones.
Key Features All in one level indicator.
All types of alerts ( Pop-up alert, puss notification alerts.

This tool provides a freehand drawing method, to treat the chart space as a blackboard and draw by-hand. Drawings can be made to stick to the CHART (moves with chart scroll), or to stick to the WINDOW (does not move with chart scroll).
Features: all drawings are individually styled, color, width
show/hide each drawing type
delete last drawing drawings, on chart and on window, remain through TF changes and terminal re-starts, until the indicator is removed
Panel: stylable colors scalable in size
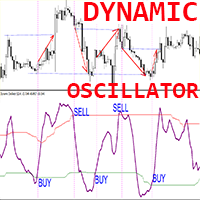
Dynamic Oscillator - is an advanced custom Crypto_Forex indicator - efficient Trading tool for MT4 ! New generation of Oscillators - see pictures to check how to use it. Dynamic Oscillator has adaptive Oversold/Overbought zones.
Oscillator is an auxiliary tool to find exact entry points from OverSold/OverBought areas. Oversold values: below Green line; Overbought values: over Red line . It is much more accurate than standard oscillators. Suitable timeframes: M30, H1, H4, D1, W1. With PC and

My indicator is a great helper in the forex market. It shows possible market reversals with absolute accuracy. My indicator does not redraw and does not change values when switching timeframes. It works perfectly on all timeframes and can become a key indicator in your strategy. I would like to note that flexible indicator settings allow you to adapt the indicator to your strategy and can make a big contribution to your profitable strategy, although everything is already laid down in this indica
Cheap Rate limited COPIES HURRY UP! 5 LEFT COPIES Very precise patterns to detect High Accurate Order Blocks: It Draw zone after market Structure Breakout with a high Accuracy, institutional orders with the potential to change the price’s direction and keep moving towards it, have been placed. Features Auto Order Blocks Draw MTF Order Blocks Double Signal One Alert Signal Second Long Wick Rejection Signal Market Structure BOS LINE This Indicator is limited features if you want full Feature
ADX Pro Indicator This Indicator Are Advanced Pro ADX Indicator Multi Time Frame Are Same Window Multi Currency Are Same Windows All Time Frame And All Currency ADX Strenght Are Same Window Monitring You Will Add Manully All Currency Pairs , And Metel , And Also Crypto Currency Pairs : EURUSD , GBPUSD, USDJPY .... Etc , Metel : XAUUSD , XAGUSD ... Etc , Crypto : BTCUSD, ETHUSD... Etc
Hello; The product offers high quality trend tracking. Thanks to the arrows on the graph, you can easily follow the entry and exit signals. It provides ease of use thanks to a single input parameter. You can easily follow the signals thanks to the alarm options. Moreover, trend color lines provide convenience in determining the trend direction. Input parameter setting: Periodic: Indicates the number of bars that need to be calculated.
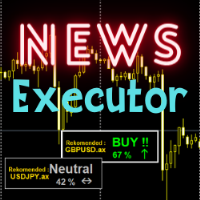
Several indicators are summarized in one display conclusion. Highly recommended indicator for all traders even beginners. You only need to make transactions according to the recommendations displayed by the indicator. It's obvious for trading news with big effects though. Trading is all about money, so love your money and make a profit with our tools. Trading recommendations on news on major currencies

Imbalance / FVG MTF Mark Imbalance on chart of Selected Multi Time frames. Trend is Manually set to filter signals in the chosen direction by a button on the chart. .
Futures Auto Mark Imbalance / FVG on chart on selected time frames
Select time frames by buttons on chart
Popup Alert, Push Notification or email when New Imbalance Form
Popup Alert, Push Notification or email when Imbalance is Taken out
Select Alert Mode to be a single or multiple Imbalance ( OR / AND option ) when Imbalance is
Master Trend Signal Indicator
TimeFrame - 15 Mins & More
Pairs - All Forex Currency Pairs , Gold , Silver , Crypto, Stock
Once Trend Is UP Cross The Yellow Line, It's Show Colour For Green
Once Trend Is Down Cross The Yellow Line, It's Show Colour For Red Easy TO Identify Trend Strength ON Trading For Scalping, Intraday Trading 5 Purchases left & The Price Increases

В основе индикатора EasyBands лежит тот же принцип, что и при построении Bollinger Band. Однако, данная модификация индикатора использует вместо стандартного отклонения средний торговый диапазон (Average True Range). Соответственно, с данным индикатором абсолютно аналогично можно использовать все стратегии, которые применяются с Bollinger Band. В данной версии индикатора используется двенадцать уровней и средняя линия (белый цвет). Индикация тренда выполнена в виде окраски свечей в зависимости
Golden Scalping & Day Trading Signal Indicator You Can Enable Or Disable Scalping Signal Option Once Enable For Scalping More Order Signals Option Or Disable For Scalping Option Intraday Signal Option Pairs : XAUUSD, XAGUSD - EURUSD, GBPUSD,USDJPY, AUDUSD, USDCAD, BTCUSD , USDCHF, GBPJPY Time Frame : 15 Mins, 30 Mins , 1 Hour 5 Purchases left & The Price Increases
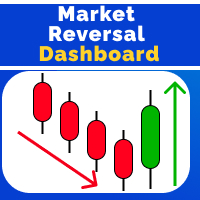
Market Reversal Catcher Dashboard indicator looks for market reversal points or major pullback. To do this, it analyzes previous price movements and using a flexible algorithm for estimating the probability of a reversal, also gives recommendations on entry points and sets recommended profit targets for positions opened on a signal. The dashboard is designed to sit on a chart on it's own and work in the background to send you alerts on your chosen pairs and timeframes. Dashboard does not requi

UR Momenter UR Momenter calculates perfectly the momentum of the price in correlation to the exhaustion of the price movement represented as an oscillator. Therefore this gives us really early signals of potential reversals or retracements. This formula was discovered in 2018 after market bubble burst. Advantages of using UR Momenter : No parameters You have 2 lines that describe the price movement - White Line which is the Momentum of the price in correlation to price's moving average d

One of the number sequences is called "Forest Fire Sequence". It has been recognized as one of the most beautiful new sequences. Its main feature is that this sequence avoids linear trends, even the shortest ones. It is this property that formed the basis of this indicator. When analyzing a financial time series, this indicator tries to reject all possible trend options. And only if he fails, then he recognizes the presence of a trend and gives the appropriate signal. This approach allows one t

Gold Scalping Pro Signal Indicator Pairs : XAUUSD, XAGUSD, Crude OIL , BTCUSD, ETHUSD, EURUSD, GBPUSD, USDJPY, AUDUSD, USDCHF, GBPJPY Setting : Once Market Are Up And Down Side , The Indicator Are Provide Buy And Sell Order Push Notification Time Frame - 5 Mins, 15 Mins, 1 Hour, 4 Hour Additional : You Have Also Trade Manual , Once Trend Power Is Up , Enter Buy Or Trend Power is Down, Enter Sell
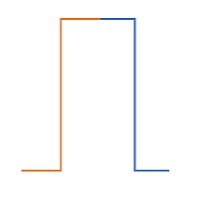
A Good , Easy , Readable and handy indicator for experienced and professional traders. It gives bounded signals between zero and one. Easy for investors to comprehend. It gives near and longer trading outlook to investors and helps them to find good opportunities. Indicator gives zero signal on price downturns and signal value equals to one on price upturns. Once again a new type of indicator and rangebound between zero and one .

A very Simple Indicator for experienced and professional traders. It indicates direction of trade and provides signals of best deals. Signal is referred here a point on chart where indicator line turns its direction or converges. This indicator finds underlaying trading asset trade direction and indicates best scenarios of trade as described in screenshots. Where it has run for a period of time and converges to best deal scenarios.
Have a Look!
A value indicator. It is helping tool to indicate the direction of value gain. A best helping tool to trade value. This indicator is equipped with a colored line and a digital tool to indicate value numerically .
This indicator also helps to indicate value during trends. A study based on this indicator shows value of trade significantly changes during trends best tool to chase the trends.
A basic tool for experienced and professional traders to trade percentile of the value. It indicates both values in the form of digits appeared on the left corner of the screen.
Instructions Manual : First choose your desired symbol and then select this tool. Please be remined that this tool is just a helping tool. its upon trader what he chooses. The function of this tool is just to provide a help in trading.
A technical Indicator Providing Price Convergence Signals along with value for experienced and professional traders. Easy to comprehend, Easy to understand.
This is a helping tool provides best signals. This indicator is designed based on the fundamentals of trade. A very good indicator you can customized its color. A best tool to find trade direction.
An adaptive indicator. It constantly adapts to the trade.
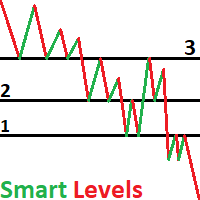
NOTE: T he indicator in demo version will not work as it requires the specific preset and if in future you don't see recent numbers drawn on your chart then please contact us for recent calculated preset file
This is smart money levels , just see the pictures how the pair reacts to our calculated numbers
The indicator can be used with any timeframe but to match the institutional traders we recommend H4 or D1 charts
Allow DLL imports must be turned on, as the indicator requires to be connect
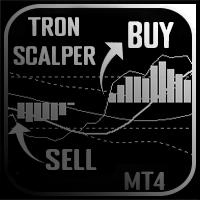
Tron Scalper is indicator designed for scalping.
An indicator that gives signals based on the readings of a whole range of standard and proprietary tools.
Main Features of Tron Scalper: Analytical functions It can be used on any currency pairs and time frames; The indicator does not redraw; Graphical capabilities Occupies the minimum number of places on the chart; Flexible tinctures; Easy to learn; Tron Scalper consists of The blue line is the RSI indicator; The orange line is a consolidate

Note: The PRICE IS SUBJECT TO INCREASE AT ANY TIME FROM NOW!! DON'T MISS THIS BEST OFFER.
Dear traders once again I am very glad to introduce to you my another trading tool called "Trend Hunter Indicator". This indicator is designed to help traders capture the trend from the beginning or the end of it. It is one of the indicator that if used wisely may help you improve in your trading decisions.
Timeframe
The indicator is for all timeframes
Pairs
The Indicator is for all pairs.
Market
Thi

HEIKEN PLUS is the only indicator you really need to be a successful trader , without in depth knowledge of the forex trading or any tools. Also there is automatically trading MT5 EA available now: https://www.mql5.com/en/market/product/89517? with superb SL/TP management! and sky high profit targets ! MT5 ONLY !
For Metatrader5 version visit: https://www.mql5.com/en/market/product/83761?source=Site
Very suitable tool for new traders or advanced traders too.
HEIKEN+ is a combin

DESCRIPTION Investing indicator help you get signal like Technical Analysis Summary of Investing.com When have signal strong ( Strong buy or Strong sell) at Time Frame M5, M15, H1, The Alert will announce to you HOW TO USE When have signal , you can entry Order and set TP & SL appropriately Recommend : This indicator also Technical Analysis Summary of Investing.com is suitable for medium and long term trading

UR FrontEndBackEnd UR FrontEndBackEnd is my favorite formula for finding the most accurate levels of support and resistance. I have also splitted those into different categories (dashed lines, solid lines and areas) to mark how strong they are. All is stored in buffers so they are easy to access and implement within other tools.
Addition : The tool may need to be adjusted to the asset it is applied on - asset's differ in terms of nr of digis in the price which affects the tool. The needed p

The Cycle Identifier MT4 indicator is a great choice of custom indicator for both short-term and long-term traders. The Cycle Identifier MT4 generates filtered price action signals to assist traders to identify when the conditions are right to open buy and sell positions. How it works The Cycle Identifier MT4 indicator displays on a separate indicator chart below the main chart where it draws an oscillating gray line. This gray line is characterized by upward and downward spikes that are accompa
This indicator is used to show the PERFECT TREND . All Time Frame charts are available. The trend is determined based on the Cycle, Price and Volatility. This Trend Indicator will give 5 output values: Cycle Period: 48 is default
Graph Place: 0 Means Main Windows - 1 means Sub Windows (you can use in your indicator)
NumBars: you can decide how many older Bar use
Short Trend Color : You can decide which color to use for Short Trend
Long Trend Color : You can decide which color to use for Long T

Awesome Oscillator by Bill Williams with the ability to fine-tune and replace the averaging algorithms of the indicator, which significantly expands the possibilities of using this oscillator in algorithmic trading and brings it closer in its properties to such an indicator as the MACD. To reduce price noise, the final indicator is processed with an additional Smooth averaging. The indicator has the ability to give alerts, send mail messages and push signals when the direction of movement of th

What is 2 Line MACD Indicator MT4? The 2 Line MACD Indicator, in short, is a technical indicator that assists in identifying the trend as well as its strength, and the possibility of the trend reversal. It is a widespread forex technical indicator that is made of three essential components, i.e. 1. MACD histogram
2. MACD: 12-period exponential moving average (12 EMA) – 26 period EMA
3. MACD Signal Line: the 9-period EMA of the MACD. This Indicator is one that ensures a trader stays profitable o

3C JRSX H Indicator represents a trend-following forex trading oscillator that signals for both market trends and its possible swing areas. Besides, it supports all sorts of timeframe charts available within the forex MT4 platform. Therefore, it can serve all kinds of financial traders providing supports for both scalping and day trading activities. This Indicator can be applied to all kinds of forex currency pairs available in the market. Moreover, its simplicity of use and easy chart demons

Signal lines are used in technical indicators, especially oscillators , to generate buy and sell signals or suggest a change in a trend. They are called signal lines because when another indicator or line crosses them it is a signal to trade or that something potentially important is happening with the price of an asset. It could be that the price was trending, pulled back , and is now starting to trend or again, or it could signal that a new uptrend or downtrend is starting.

About Scanner:
It will show you the Higher/Lower Highs and Lows of zigzag price. Use it to keep track of best ongoing trends and price ranges.
Detailed blog post:
https://www.mql5.com/en/blogs/post/750232
Symbols:
HH: Higher Highs HL: Higher Lows When price makes higher and higher Highs or higher Lows:
It will count Zigzag in reverse and find total number of last "Higher Highs" and "Higher Lows" or "Lower Lows" and "Lower Highs". LL: Lower Lows LH: Lower Highs
How to Use:
Suppose price is

Accelerator Oscillator by Bill Williams with the ability to fine-tune and replace the averaging algorithms of the indicator, which significantly expands the possibilities of using this oscillator in algorithmic trading and brings it closer in its properties to such an indicator as MACD.
To reduce price noise, the final indicator is processed with an additional Smooth averaging. The indicator has the ability to give alerts, send mail messages and push signals when the direction of movement of
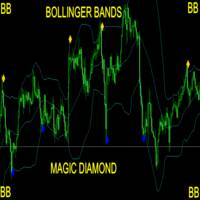
Take Your Trading Experience To the Next Level ! and get the Magic Bollinger Bands Diamond Indicator MagicBB Diamond Indicator is MT4 Indicator which can suggest signals for you while on MT4. The indicator is created with Non Lag Bollinger Bands strategy for the best entries. This is a system to target 10 to 20 pips per trade. The indicator will give alerts on the pair where signal was originated including timeframe. If signal sent, you then enter your trade and set the recommended pips target

SupportResistancePeaks Indicator indicator - is the combination of dynamic support/resitance and price action pattern. As a rule support/resistance indicators uses already calculated, history levels. The most disadvantage of this method - new(incomming) levels always are not the same as were on history, in other words accuracy is not so high as expected. My indicator is looking for dynamic/live levels that are forming right now after trend lost it's power and choppy market starts. As a rule exac
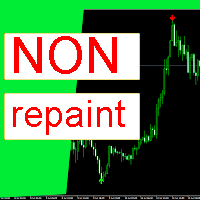
An indicator that will help you trade. This indicator will show trend reversals as well as pullbacks. When the arrow appears, it will mean that now the trend will either change its direction, or there will be a rollback from the main movement. In any of the cases, if the trader knows about it in advance, it is possible to open trades effectively. This indicator does not redraw its values. The arrow appears at the beginning of the candle and stays there.
How to trade with this indicator: When

MACD Scanner provides the multi symbols and multi-timeframes of MACD signals. It is useful for trader to find the trading idea quickly and easily. User-friendly, visually clean, colorful, and readable. Dynamic dashboard display that can be adjusted thru the external input settings. Total Timeframes and Total symbols as well as the desired total rows/panel, so it can maximize the efficiency of using the chart space. The Highlight Stars on the certain matrix boxes line based on the selected Scan M

В основу алгоритма этого осциллятора положен анализ веера сигнальных линий технического индикатора RSI . Алгоритм вычисления сигнальных линий выглядит следующим образом. В качестве исходных данных имеем входные параметры индикатора: StartLength - минимальное стартовое значение первой сигнальной линии; Step - шаг изменения периода; StepsTotal - количество изменений периода. Любое значение периода из множества сигнальных линий вычисляется по формуле арифметической прогрессии: SignalPeriod(Numbe
This indicator takes input from the RSI from multiple time frames (M/W/D/H4/H1), and presents the output on the main chart. Great for scalping. Features alerts for the current chart's TrendLine above or below price. TrendLine period setting. Multi RSI period settings. How to use: Simply attach to M5 (Scalping - zoom chart out completely on M5) or use on higher time frames' charts. Zoom chart out completely to get a better view of the chart. Hover over the lines to see the time frame applicable.

Wink IND is an indicator that tell you: -when MACD is saying buy or sell -when RSI is saying buy or sell -work on multi timeframes MT5 Version
by Wink IND: you don't need to have Knowledge about MACD or RSI don't need to check and compare MACD and RSI respectly don't need to check all of timeframes and compare the resaults don't lose time, save more time for your decisions in trading
Wink IND: multi timeframe indicator multi currency indicator show the positions by graphic shapes, arrows and

В основу алгоритма этого трендового индикатора положен анализ веера сигнальных линий универсального мувинга . Алгоритм вычисления сигнальных линий выглядит следующим образом. В качестве исходных данных имеем входные параметры индикатора: StartLength - минимальное стартовое значение первой сигнальной линии; Step - шаг изменения периода; StepsTotal - количество изменений периода. Любое значение периода из множества сигнальных линий вычисляется по формуле арифметической прогрессии: SignalPeriod(Nu
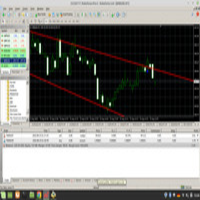
the trend line Alert indicator will inform you when the candlesticks crosses or touches the desired line. the indicator is having pop up and push notifications, see the pictures down how to setup, e.x, 1. pic one is alert 2. pic two is right click of the chart 3. pic three is how to change names of the trend so the indicator will detect 4. pic four is how you changed in the correct way any assistance please drop me via mql5 chat

Trend deviation scalper - is the manual system to scalp choppy market places. Indicator defines bull/bear trend and it's force. Inside exact trend system also defines "weak" places, when trend is ready to reverse. So as a rule, system plots a sell arrow when bull trend becomes weak and possibly reverses to bear trend. For buy arrow is opposite : arrow is plotted on bear weak trend. Such arrangement allows you to get a favorable price and stand up market noise. Loss arrows are closing by common p

Классический Parabolic SAR с цветовой визуальной индикацией действующего тренда и моментов его изменения на противоположный для ручного трейдинга. При необходимости символы сигналов покупки и продажи можно заменить, используя входные параметры индикатора Buy Symbol; Sell Symbol. Номера символов можно найти здесь .
Индикатор имеет возможность подавать алерты, отправлять почтовые сообщения и push-сигналы при смене направления тренда.

Gold Trend Pro Buy & Sell Signal Indicator Pairs : XAUUSD - XAGUSD - Crude OiL, EURUSD,GBPUSD,USDJPY,AUDUSD,GBPJPY,BTCUSD TimeFrame - 1 Min , 5Min, 15Min Once All Are Green Bar , And Also Englufing The Candle You Can Enter To Buy Once All Are Red Bar, And Also Engulfing The Candle You Can Entry To Sell And Next Once Change The Bar Colour , You Can Exit The Buy & Sell Order

Trend driver bars is the manual trading system, which defines current trend continue or it's pull-back/reverse. "Driver" bars - are price action patterns that has powerfull affect on market, defining it's near future direction. Generally, driver bars represents trend "skeleton" and often anticipates new market impulse. System plots arrows when market shows 3 pattenrs in a row(most powerfull combo-pattern), and makes fast scalping of incomming movement. Loss positions closes by common profit. Lot
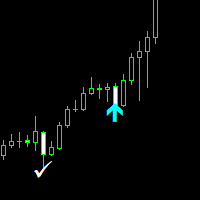
Nasdaq Savages Non-repaint indicator works on all timeframes 1 minute to 15 minutes timeframe for scalpers. 30 Minutes to Monthly timeframe for swing traders The Nasdaq Savages indicator comes with a top right info tab which tells you about the current buy or sell signal, Profit in pips, Stop loss and Target Red arrow is your sell entry signal the white right tick is your exit signal and take profit hit signal Light blue arrow is your buy entry signal the white right tick is your exit signal an
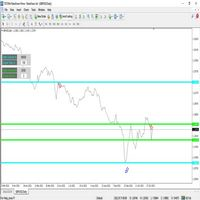
The indicator Price Channel consists of two independent price channels and levels of price zones - (A / B). The indicator constantly monitors the behavior and movement of prices, as well as the breakdown of channel levels - (A / B), rearranging levels and fixing new zones of extremums and minima. To analyze the previous and current high and low zones, regardless of the number of bars in each channel - (A / B). On the chart, the indicator displays useful information for each channel - (A / B): 1
Calculate 28 pairs buy and sell volume real-time.
This Indicator is good for all trader. It will increase the accuracy and decision making of placing orders. It shows the strength and weakness of every currency. It's a great help to you. CurrencyStrength28pairs - The indicator calculates the price and the buy and sell volume of every currency pair. Show you the results on the board in real time. and averaged all currency pairs to show the strength of the current currency. Features
Result on the

Wave Impulse OmegaScalper - is the manual system for scalping. In many cases Indicator "eats" almost all possible trend wave. System defines up price wave and down price wave. Inside the exact wave - system defines true trend movement and choppy market. Indicator plots signals while market is trending, powerfull and has quiet good volatility. This is complete system with enter and exit points. Main Indicator's Features Signals are not repaint,non-late or disappear(exept cases when system recalcu
Dot scalp - shows price reversal points with 93% accuracy. Does not redraw points. Works well during sideways price movement when the market is flat. The indicator draws the points of price reversal or pullbacks on the chart.
How to use this indicator in trading? Add the Dot scalp indicator to the chart. Also download on the Internet any channel indicator that shows the channel on the chart. Wait for the sideways movement of the price, this is when the channel indicator draws a channel in the
THIS PRODUCT IS USED TO BACKTEST THE ULTIMATE SNIPER DASHBOARD ! MESSAGE ME IF YOU PURCHASED THE ULTIMATE SNIPER DASHBOARD. LINK ABOVE.
This indicator scrolls multiple charts at the same time when you scroll the chart the indicator is attached to. It is useful for backtesting multi-timeframe strategies, multi-pair strategies, monitoring multiple charts at once and looking back to see how several markets have performed historically at the same time. The indicator shows time and date. It is light

This indicator takes input from the ADX from multiple time frames (M/W/D/H4/H1), and presents the output on the main chart. Great for scalping. Features alert for current chart's ADX. TrendLine period setting.
How to use: Simply attach to any chart. User can set the period for ADX(Monthly, Weekly, Daily, H4, H1,Current chart) Zoom chart out completely. Hover over the lines to see the time frame applicable. Buy when Multi ADX below price; also blue dots and white line below price. Sell when Mult

Reverse side scalper is the manual trading system, that works on choppy(anti-trend) market. As a rule markets are on 80% choppy and only 20% is trend phase. System is based on custom step Moving and RSI and reverse pattern. System defines up movement, down movement, trend / choppy phases. Indicator plots Buy signal arrow when current direction is down and phase is trend, Sell signal arrow is plotted when currently is up movement and phase is trend. As a rule it allows to "catch" local maximum/mi
The MetaTrader Market is the best place to sell trading robots and technical indicators.
You only need to develop an application for the MetaTrader platform with an attractive design and a good description. We will explain you how to publish your product on the Market to offer it to millions of MetaTrader users.
You are missing trading opportunities:
- Free trading apps
- Over 8,000 signals for copying
- Economic news for exploring financial markets
Registration
Log in
If you do not have an account, please register
Allow the use of cookies to log in to the MQL5.com website.
Please enable the necessary setting in your browser, otherwise you will not be able to log in.