YouTube'dan Mağaza ile ilgili eğitici videoları izleyin
Bir ticaret robotu veya gösterge nasıl satın alınır?
Uzman Danışmanınızı
sanal sunucuda çalıştırın
sanal sunucuda çalıştırın
Satın almadan önce göstergeyi/ticaret robotunu test edin
Mağazada kazanç sağlamak ister misiniz?
Satış için bir ürün nasıl sunulur?
MetaTrader 4 için teknik göstergeler - 114
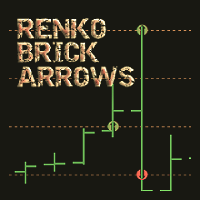
The ' Renko Brick Arrows ' indicator was developed to showcase the traditional renko brick grid pricing on chart. An alternative to using an offline chart generator for renko grid prices, and a unique charting style to strategize.
Key Features Renko bricks are drawn over the chart without having to generate a new chart. Optional horizontal lines shows where the next arrows are supposed to appear. Both one and two step reversals are available to draw arrows for buy and sell.
Input Parameters

IMPORTANT; Price is subject to rise at any time from now! Do not miss this offer! Dear trader I am glad to introduce my new tool called Trend Analyser Dashboard to you. The design, style, and settings of this indicator have been made simple to make its users not take too much time in understanding the indicator itself. The purpose is to help traders in analysing the direction of the major trend and the status of the trend whether in weak trend or its strong trend. The indicator will also prov

The "Spread Monitor" indicator allows you to analyze the spread change during the day, control the expansion of the spread by your broker and has a number of interesting additional features Choosing a broker with a minimum spread value is very important for the work of night advisors, scalping and intraday trading.
However, the MT4 terminal does not store spread data, so the multifunctional "Spread Monitor" indicator will be useful for any intraday trader. Features:
The indicator shows the cu
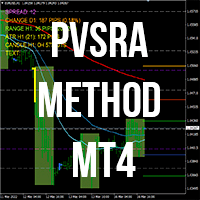
PVSRA ticaret yöntemi. Sistem, büyük oyuncuların pozisyon kazandıkları pozisyonların yönünü hesaplamaya dayanmaktadır.
PVSRA bir kısaltmadır: P - Fiyat (Fiyat), V - Hacim (Hacim), S - Destek (Destek), R - Direnç (Direnç), A - Analiz (Analiz).
PVSRA yöntemi, yuvarlak fiyat seviyelerini (ör. 1.2000) ve ara seviyeleri (ör. 1.2250, 1.2750) kullanır. Yuvarlak seviyenin altındaki konsolidasyon, uzun pozisyonlar için hazırlık, seviyenin üzerindeki konsolidasyon, kısa pozisyonlar için hazırlıktır.

CHART OBJECTS: Blue box : Bullish Order Blocks (OB) Red box : Bearish OB Orange box : Mitigated OB. Price bounce from this area the made a new high/low Light gray box : Price bounced from this area but did not made a new high/low Dark gray box : Broken OB. Filled boxes : TimeFrame 1 Order Blocks
Unfilled boxes : TimeFrame 2 Order Blocks
INDICATOR SETTINGS: Order Block Required Length: Required number of subsequent candles in the same direction to identify Order Block. Default value: 5 Im

Scalping indicator. Points show the price reversal places on the chart. Not redrawn. Minimum delay. Works on M1, M5, M30, H1, H4 timeframes. You can work on all currency pairs. The indicator can also work on gold, silver and cryptocurrencies. This indicator can also be used for binary options.
How to trade (an example of a strategy for GBPUSD)? When a blue dot appears, buy. When a red dot appears, sell. TakeProfit set to 25 points. StopLoss set 35 points. TrelingStop is set at 15 pips. Benefi

Target Striking - One of the best binary options trading tools!
It is set up so powerfully that you can trade not only on currency pairs, but also on raw gold oil!
You can also try on cryptocurrency!
Ideal for trading on currency pairs, the percentage of reliable transactions is more than + 75%
The trading tool is already set for the best profit!
Only Target Striking can unlock the potential of the trading market for you!
With it, the signals are even and accurate without redrawing,

''SKPredict'' Show you next prediction of Close/High/Low/ Open Level. This indicator Used mathematical calculations . It means, that based on the previous movement of the market, the price movement is expected to be in predicted Level. Also you can See, what Happened in previous Data and Predictions and use Buffers to write your EA. Also In ' Tendency indicator '' , as full package of Predictions that every Trader need, there is the Predict line to show you the future of Price.

Improve trading with this indicator. Find areas of buys or sells in Fibonacci retracement areas. Fulltrend is for scalping and making swing trades. Fib levels are added for take profits and stop losses. This works on any time frame and can be used by itself or together with other systems and indicators for filters. The indicator doesn't repaint. Alerts are added and can be true or false. No need to sit glued to the computer, just set on charts and listen or the alerts to come. Take a pos
The Breakeven levels indicator is an indicator that, according to its algorithm of work, determines the number of open orders on a certain instrument finds the level at which all orders go from loss to profit. Separately, for sell and buy orders, the general level of the beginning of profit is found. In the lower left or right corner, information is displayed on three buttons to choose from. When you press the button, a horizontal line of a certain level is displayed on the screen. On the right
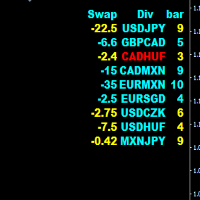
Divergence HiLo scaner is a good tool for market analysis. The indicator looks through all currency pairs and finds those that meet the selection conditions, where corrections or reversals to the main movements are supposed to begin. The indicator values are entered in the final table. 1 value is swap 2 Currency pair. 3 The number of bars after finding the selection conditions. The bar color blue is used for the buy signal. The bar color yellow is used for the sell signal. The color of the
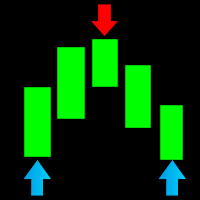
An indicator that shows price reversal points on the chart. Using RSI and other standard indicators, the indicator determines the price reversal points and shows them on the chart with arrows. The indicator does not redraw its values and in 95% of cases it shows accurate signals. This indicator works on all currency pairs and all timeframes.
How to trade with this indicator (recommendations): We recommend opening trades in the direction of the arrow that appears. If a blue arrow appears, op

Fibonacci retracements are trend lines drawn between two significant points, usually between absolute lows and absolute highs, plotted on a chart. Intersecting horizontal lines are placed at the Fibonacci levels. Fibonacci retracements are useful tools that help traders identify support and resistance levels. With the information gathered, they can place orders, identify stop-loss levels, and set price targets. Although useful, traders often use other indicators to make more accurate assessments

Multi-timeframe signal trend indicator.
Detects the trend direction and is colored in the corresponding color.
It has three different sensitivity options
Can show trend direction on other timeframes
Has embedded audible and visual alerts on trend reversals.
Can send notifications to your phone or email.
Allows trend and counter-trend trading.
Works on all timeframes, all currency pairs, metals, indices and cryptocurrency.
It can be used for binary options.
Distinctive feature
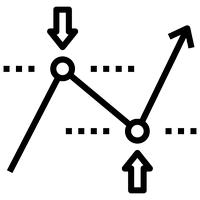
Bu gösterge, optimum kar al ve zararı durdur seviyelerini gösterir. Bu seviyeler geçmiş verilere dayalı olarak hesaplanır. İlk başlangıçta, gösterge tarih konusunda eğitilir. Bundan sonra, fiyatın gelecekte şu veya bu seviyenin üstesinden gelme olasılığını değerlendirir ve stop emri vermek için en uygun seçenekleri seçer. Örneğin, kârı al değerleri, kârın maksimum olması ve fiyatın seviyesine ulaşma olasılığının mümkün olan en yüksek olması için seçilir. Durdurma kaybı seviyesi minimum olmalıdı

RSI Signals is a simple dashboard type indicator that displays the values of the RSI (Relative Strength Index) oscillator on various instruments and time frames chosen by the user. In addition, it can be configured by the trader to show signals when the RSI is in an overbought/oversold condition, when it crosses these levels or when it crosses the 50 level, which is important in some strategies. It is simple and easy to set up. By itself, it should not be used as a trading system since RSI signa
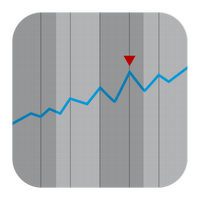
Hipergeometrik seri, bu filtrenin ağırlık katsayılarını hesaplamak için kullanılır. Bu yaklaşım, zaman serilerinde oldukça ilginç bir düzeltme elde etmenizi sağlar. Hipergeometrik filtre ağırlıkları, üstel ve doğrusal ağırlıklı hareketli ortalamalar kadar hızlı azalmaz, ancak düzleştirilmiş hareketli ortalamalardan daha hızlı bozulur. Bu nedenle, bu filtrenin davranışı birçok yönden hareketli ortalamaların davranışına benzer. Ancak, birkaç avantajı vardır. Gecikmesi, hareketli ortalamanınkinden

Scalping Code is for trend scalping. It is simple to use and is profitable. It can work on any time frame and any asset. This indicator can be used on it's own or together with another system. The arrow does not repaint or recalculate.
The rules are as follows: A blue arrow above the moving average is a buy. An exit for the buy above the moving average is a red arrow or target. A red arrow below the moving average is a sell. An exit for the red below the moving average is a blue arro
MTF Update will be soon
Price Increase Soon, It just Off price only for first 10 copies. ZigZag Breakout Arrow Very high accurate buy and sell signals provide , you can also use as market reverse signal or Trend change alert Features. ZigZag Parameters changeable. Alerts. Buy and Sell Signal. ZigZag Breakout on candle close or candle high price. and MTF Update will coming soon.

Indicator MT4 : DXMA(Direction index moving average)
Objective: To track price trends and price reversals.
How to set up Indicator DXMA : 1. The standard value is EMA 12 and EMA 26, you can set it as you like. 2. UTBx 14 is Universal Trend Boundary Index, standard value 14. 3. UTBx Method is a method for calculating the standard value is Exponential.
Meaning of symbols in indicators : 1. The line of the green group means the trend is up. 2. The line of the red group represents a down trend
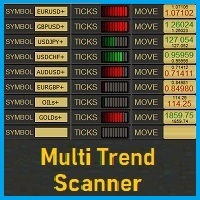
MultiTrend_Scanner is an indicator for the MT4 platform that is used to review trends on multiple symbols. We turn it on on any symbol, on any TF and we have a preview of the entire market. The current symbol is permanently assigned in the first segment of scanner. When adding another segment, you can manually enter any symbol. The quantity of added segments is unlimited. In each segment of a given symbol displayed are trends on different TFs. To calculate the strength of these trends are used
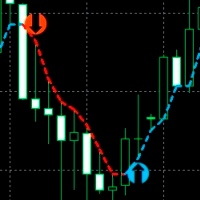
An indicator for accurately determining price reversal points on all timeframes and all currency pairs. With the help of technical analysis of the market and mathematical diagnostic models, this indicator determines the price reversal points and the current trend direction with great efficiency. The indicator displays this information on the chart in the form of arrows and lines. The arrows show the trend reversal points and the lines show the current trend direction. INDICATOR trades in real ti
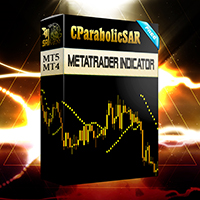
This indicator is based on ParabolicSAR. This indicator does not change the trend easily and does not change the trend until it receives a clause and approval. This indicator can be used for trail stop or trend detection.
MT5 Version
benefits:
Works on all instruments and time series,
Does not redraw its results,
Comparison depth is adjustable,
Works well with any popular strategy,
The power of the areas is adjustable,
We assure you that we we
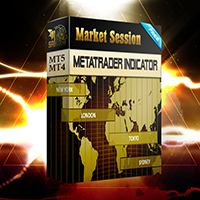
The Market Sessions Indicator for MT5 helps you predict market turnarounds by detecting major supply and demand areas. These pivot points tend to occur after a new session has started and the previous one is still open. It is also used to gauge how many points or pips the market moves on average during a session. This helps us to place better our take profits and stop losses. The indicator works on all forex pairs, gold, silver, commodities, stocks, indices and any other instrument that yo

The Market Sessions Indicator for MT5 helps you predict market turnarounds by detecting major supply and demand areas. These pivot points tend to occur after a new session has started and the previous one is still open. It is also used to gauge how many points or pips the market moves on average during a session. This helps us to place better our take profits and stop losses. The indicator works on all forex pairs, gold, silver, commodities, stocks, indices and any other instrument that your

The Stochastic Dashboard is multi currencies and multi timeframes dashboards. It shows the Stochastic direction for the chosen pairs/timeframes. For the Stochastic lovers and manual trader this indicator is a most indicator which can be used to determine the market direction for the pair(s) you are trading. Set it to one chart only and monitor from one place all the charts you want.

Price pivot point indicator. The indicator shows with points on the chart the places where the price can turn in the opposite direction. When the indicator draws a red dot, it means that the price can turn its movement down. When the indicator draws a blue dot, then the price can turn its move up. This indicator can be used for both manual trading and automated trading by integrating it into your robot. To do this, the indicator has data exchange buffers.
Recommended currency pairs: XAUUSD EU
PAX Simple Trend Signals for MT4
Самый простой и лёгкий в работе индикатор для торговли по сигналам разворота тренда. Зелёными и красными линиями на ценовом графике отображаются направления тренда — растущий и падающий соответственно. Стрелка вначале линии тренда сигнализирует о развороте тренда.
Если на трендовой линии появилась стрелка такого же цвета — это сигнал на открытие нового ордера. Если на трендовой линии появилась стрелка противоположного цвета — это сигнал на закрытия всех орде

A professional trading indicator with double-entry options. Valuable Smooth Channel Lines on the separated window, Trend Lines both on the main window, and separated window and entry arrows. Good for trading scalping in the lower timeframes. Even also it can work and provide signals in the higher timeframes for longer-term trading periods. INDICATOR SETTINGS: 1. Signal Mode. There are 2 options: Default and Compact. If Default, it will provide 3 different arrow codes on the main window. This o
Advanced Trend System, yüksek olasılıkla potansiyel trend dönüş noktalarını bulmanızı ve bir trend oluşumunun başlangıcında piyasaya girmek için sinyaller almanızı sağlayan tescilli bir algoritma kullanan yenilikçi bir göstergedir. Gösterge mevcut piyasa koşullarını takip edecek ve yalnızca tüm dahili stratejiler üzerinde anlaşmaya varıldığında ve birbiriyle %100 örtüştüğünde, gösterge bir al veya sat sinyali verecektir. Gösterge, 2008'den beri ticaret deneyimimin sonucudur!
Gösterge avantajl
MT5 Version A versatile tool
You do not need any other tools with this tool.
You can enable or disable all indicators.
Their values are adjustable.
In the first line you will see a summary of your account status.
p: The amount of your profit or loss
BP: The amount of your daily profit based on the balance
EP: Equity daily earnings
WP: Your weekly profit
MP: Your monthly profit
The next line shows each of the time frames you selected.
Chikou: The Chikou process
KT: The trend of t

Piyasa yapısını tersine çevirme alarm göstergesi, bir trendin veya fiyat hareketinin yaşam döngüsünün sonuna ulaştığını ve tersine dönmek üzere olduğunu algılar. Piyasa yapısı değiştiğinde sizi uyarır, bu genellikle tersine dönme veya büyük bir gerileme olması muhtemel olduğunda gerçekleşir. Olası bir tükenme noktası etrafında yeni bir yüksek veya düşük yapıldığında, gösterge kırılmaları ve fiyat momentumunu tespit eder. Gösterge, mevcut eğilime bağlı olarak yeni bir yüksek olasılıklı ticaret ku

Overview: With so much noise and distraction in the markets I wanted to create clarity for traders to have a simple, efficient, and fun trading experience. This is why I created Pipsurfer. Pipsurfer is an trend following indicator that visually shows you important Institutional Smart Money levels in the market and helps you to trace Market Structure in the markets. Most traders find it difficult to visually see trading elements such as trend, structure and momentum which are key for understandin
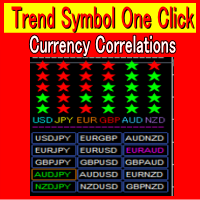
Currency Strength Meter 1:Correctly identifying trends in foreign exchange investments is critical. 2:TrendSymbolOneClick quickly detects and displays trends that have just begun and those that have already been in place for an extended period of time. 3:There is also a USD JPY EUR GBP AUD NZD strength function. 4:Volatility allows you to know exactly when there is a major market move. 5:You can save time in your market analysis by using Trend Symbol One Click. 6:Analysis available from 1 minut

Master Point is an indicator set that includes the most powerful and necessary tools for a trader, giving that very edge in the markets to be successful. An indicator that has an elegant and complete system that works very well in all markets (Forex, Crypto, Stocks, Indices) helps to find the best reversal points. It has tools such as trend reversal detection, pivot points, divergences, currency strength and 'candle strength'. All this makes the indicator a complete tool that does not require a
Apollo Binary Options Indicator bu ikili opsiyon ticareti için bir sinyal göstergesidir. Sinyal, mevcut mumun açılışında gelir ve kapanana kadar geçerlidir. Sinyale, haritanızda bir ok ve bir sinyal mesajı eşlik eder. Önerilen seçenek sona erme süresi bir mumdur. Yani, grafik H1 ise, o zaman sona erme süresi 1 saat olacaktır. Grafik M5 ise, opsiyonun sona erme süresi 5 dakika olacaktır. Ama aslında, sinyalleri istediğiniz gibi kullanmakta ve dilerseniz kendi ticaret kurallarınıza uymakta özgürsü

Horizontal tick volumes (HTV) Horizontal tick volumes - an easy and convenient indicator of a horizontal market profile in a user-selected time. Produces a visual image of strong trading levels by maximum peaks past volumes and trading direction by color (sell or buy), and also allows you to detect smaller trading levels by differentiating past volumes. In the "Optimal" mode, when displayed on chart periods up to and including "M30", the data of one-minute bars are used, on H1 and H4 - five-minu

IGRIDCOIN.COM PRESENT SIGNALS FROM THE OUTER LIMITS! IgridCoin Space Signals is a unique 4 in 1 reversal trend indentation bot 100% non-repainting multi-timeframe indicator that can be used on all symbols/instruments: forex, commodities, cryptocurrencies, indices, stocks. “Igrid space signals” it will determine the current trend and at what point a reverse will happen at its early stages, gathering information and data from up to 4 special indicators, which are: Average Directional Movement Ind

PROFITABLE TRADER is an interesting name for this indicator... And all because it is for a true trader who values his time. It has a built-in Alert and parameters that will make your work easier. Open settings will allow you to set the indicator to any cryptocurrency or just currency. It's better to test and then draw a conclusion .. screenshots will show everything.. good bidding my friend.

This indicator is named so for a reason, because it will show the reverse side of the market.
It has several math indicators built in that are tuned to show the best signals for currency pairs!
Ideally proved to be in work on the M5-M15 no more and no less!
Only at the same time it shows up to 86.5% of correct signals!
The settings include the colors of the arrows, the alert, and the same parameters so that you can reconfigure the indicator and trade on cryptocurrency and raw materials!

An excellent indicator for those who like fast binary options trading!
It works great on m1-m5 timeframes!
The periods are customizable, so you can even set up for cryptocurrency, and trade on weekends!
You can also customize the color of the arrows!
Works on all timeframes!
But as stated above, it's better on m1 - m5!
Whatever you forget about the signal, it has an alert!
Test and try this indicator! If I have questions write, I will gladly listen to suggestions and errors!

Öne Çıkan Ticaret Sinyali göstergesi, herhangi bir stratejiyi tamamlayacak ve bağımsız bir araç olarak da kullanılabilir. Faydalar Önerilen M30 Zaman Çerçevesi Kullanımı kolay; grafiği gereksiz bilgilerle aşırı yüklemez. Herhangi bir strateji için filtre olarak kullanma yeteneği. Mum kapandıktan sonra göstergenin rengi değişmez. Hisse senedi, endeks, petrol, altın ve tüm zaman dilimlerinde çalışır. Push bildirimleri ve sesli uyarılar işlevine sahiptir. Uyarı - uyarıları etkinleştirin/devre dışı

Market Meter is designed for explore various trends in current trading symbol. with Market Meter you can get a clear idea about the trends running on different time frames of current symbol. This indicator uses separate window to display its data. Every time when a new trend occurred, Indicator shows it with displaying an arrow on related text area. It's very important to identify the trends of higher time frames when you trading lower time frames. Let the Market Meter to do the work for you.

Pipsurfer Dashboard is a multi-currency multi-timeframe dashboard designed to alert you to where the action is happening in the forex markets. The software trades a trend based price action and market structure strategy. Assets Supported: All Forex Metals Indices Major Crypto
Major Input Settings: Timeframe Filters - Choose which timeframe you want the Pipsurfer Dashboard to signal you on. Pair Selection - Choose To Follow All Major Pairs And Crosses or have a custom list of your choice Aler

" Scalping saham " is a unique, turnkey scalping trading system. It shows the trader when and where to open and close trades. Scalping trading is one of the most effective, but at the same time, the most complex trading systems. Therefore, if you don’t have your own strategy yet, you’d better take a ready-made scalping strategy and work with it. The scalping strategy of this indicator is to determine the direction of the trend with high accuracy, then determine the price reversal points and giv
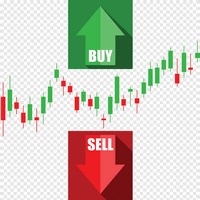
Bu gösterge, fiyat serisinin yerel en yüksek ve en düşük seviyelerini kullanır. Ekstremi vurguladıktan sonra değerleri yumuşatılır. Bu sayede iki kanal inşa edilmiştir - harici ve dahili. Fiyat hareketi kesinlikle lineer bir trend izliyorsa, dahili kanal limitleri gösterir. Dış kanal, logaritmik bir eğilim ile fiyat hareketinin sınırlarını gösterir. Gösterge, kanalları hesapladıktan sonra gerçek fiyat hareketini analiz eder ve pozisyonların açılması ve kapanması için öneriler sunar. Mavi noktal

Divergence and Convergence are important harbingers of reversals in stock markets.
The Divergence Sync indicator is designed to automatically search for divergences on a large number of indicators with different parameters.
The search for divergences is carried out on these indicators: (CCI, CHO, DeMarker, MACD, MFI, Momentum, OBV, OsMA, RSI, Stochastic, WPR, Awesome Oscillator ).
To search for divergences, you can use one technical indicator or search simultaneously on any number of indic

TickCounter göstergesi, her yeni çubukta yukarı ve aşağı keneleri sayar.
Hesaplama, gösterge tabloya yerleştirildiği andan itibaren başlar.
Histogram çubukları şunları temsil eder: Sarı çubuklar - toplam kene sayısı; Mavi çubuklar - YUKARI işaretler; Kırmızı çubuklar - AŞAĞI işaretler. Mavi çubuk görünmüyorsa, daha fazla aşağı onay işareti vardır ve kırmızı çubuk mavi olanın üzerinde görüntülenir (kırmızı katman mavi olanın üzerindedir). MT5 version: https://www.mql5.com/en/market/product/

Trading Indicator Lab’s Trend Navigator for MT4 is an indicator that can help you reveal the underlying trends in any chart on any timeframe. Determining Trends It only takes a minute or two to analyze the indicator with its simple yet insightful methods of representing bullish, bearish and ranging price action across the chart. It forms a single line that runs in 3 directions: Upward direction – represents a significant bullish price action Horizontal direction – represents ranging price action

Anchored Volume Weighted Average Price (AVWAP, or Anchored VWAP). Tells you who is in control, the buyers or the sellers. Better than all other moving averages because it adds weight to the traded volume. This technique was made popular by Brian Shannon of Alphatrends. It is calculated by multiplying typical price by volume, and the dividing by total volume. It is very simple to use. 1. Press a number from 1 to 9 on the keyboard, then click the chart where you want to anchor the VWAP. 3. Hold C
SL Curruncy impulse flow of this intraday Asian London New York Sessions strength.SL Curruncy impulse indicator best for intraday scalper. market powerful move time you can catch best symbol. because you'll know which currencies are best to trade at that moment. Buy strong currencies and sell weak currencies Suggested timeframes to trading : M1 - M5 - M15 - M30 -H1 You can however just change SL Curruncy impulse to check in the settings. Bear in mind that scanning very low timeframes. How d

Inficator MT4 : HiLo Objective : Find Support and Resistance zone
How to set up Indicator HiLo : 1. Indicators type multi time frame are MN1 W1 D1 H4. 2. Customize for use MN1 only or W1 only or D1 only or H4 only or open all. 3. We use MN1 and W1 for set to Key level. 4. For Close price or Open price to high price set for Resistance zone. 5. For Close price or Open price to Low price set for Support zone.
How to trade for success : Entry point : Buy / Long position 1. Price bid hit the

Indicator MT4 : RSI MA is Moving average of strength index
Objective : Find entry price for the good trade
How to set up indicators RSI MA : 1. RSI period 14. 2. MA you can set calculate price and method price. 3. MA period 9. 4. Arrow setting : 6 types. 5. Alert setting : Next bar or Instant bar. 6. Choose display for 1 or 2 calculation by formula.
How to trade for success : Entry point : Buy / Long position 1. When arrow up direction show 2. TP : RSI OVB
Entry point : Sell / Short posi
Easily track how the price moves in a separate indicator window with this trend indicator. Great for scalping or long-term trading. Helps you find best entry points for your trades after reaching a certain level, and easily identify where you can exit your trades. This indicator can be used on all time frames and pairs. Features alert function.
No need to set up the indicator.
How to use: Simply attach to any chart. NB : Look to the extreme zones (oversold/overbought) when looking for new tra

The Chop Exploder indicator is a custom indicator that has a long run, tight chop, short chop, and band colour. This indicator has MT4 alert notification,mobile notification, and email notification. The default indexing of all arrays and indicator buffers is left to right. The index of the first element is always equal to zero. Thus, the very first element of an array or indicator buffer with index 0 is by default on the extreme left position, while the last element is on the extreme right posit

CFF Pro Trader
CFF Pro Trader is the best trading system you will ever find when you want to follow the right & the real direction of the market, It’s providing marvelous trading signals based on such and amazing algorithm.
*** 2 Copies left for next price $4100 ***

Trading Indicator Lab’s Candle Volume Heatmap for MT4 merges volume with price by applying gradient-colored dots on the bars. It can also detect bars that have the most volume and the least volume. Gradient Coloring When applied to a chart, the Candle Volume Heatmap indicator applies colored dots to each bar which may vary according to its volume. The chart becomes a heatmap where you can easily spot which parts of the bar history are “hottest” or the bars that had the greatest number of volume

Trading Indicator Lab's Volume by Price is a volume-based indicator for MT4 that reveals price levels with the most and least volume for each bar within a given period. How It Works You can think of the indicator as a running volume profile that displays the most voluminous price level and the price level that has the least volume. For each bar, the indicator calculates the volume vertically in the price axis. As this is calculated, the indicator creates 2 signals: (1) a large red dot which repr
The R[2] Forex Indicator is a complete Forex Trading System working on major forex pairs on 15 Minutes time frame, and it draws: Low Dot / High Dot to spot potential turning points Buy Arrows and Sell Arrows to help you enter the trades with the perfect timing A two colors dotted line to show the trend in action and the target for reversal signals
I invite you to watch my Videos on YouTube where I show the R[2] Strategy and how I personally trade with it, and a
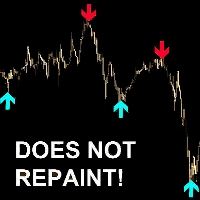
"Avadhut sathe" is an indicator for scalping. Shows the trader with arrows on the chart the price reversal points. Best of all "Avadhut sathe" trades on M1, M5, M15 timeframes. Recommended currency pairs: GBPUSD, EURUSD, GOLD, SILVER, BTCUSD, AUDUSD, USDJPY, EURJPY, USDCHF, USDCAD, EURCHF. The "Avadhut sathe" indicator has many modes of operation, on which the accuracy of the signals depends. In most modes, the "Avadhut sathe" indicator does not redraw its signals. The "Avadhut sathe" indicator
The R[2] Gold Indicator is a complete Trading System working on GOLD (XAUUSD) on 5 Minutes time frame, and it draws: Low Dot / High Dot to spot potential turning points Buy Arrows and Sell Arrows to help you enter the trades with the perfect timing A two colors dotted line to show the trend in action and the target for reversal signals
I invite you to watch my Videos on YouTube where I show the R[2] Strategy and how I personally trade with it, and also to join m
MOVING AVERAGE ON OFF BUTTON as the name suggest you can disappear and reappear up to 5 moving average with a single click. This can save a lot of time and energy for the traders. you can change the color, period and shift of the moving average as you wish you can move the on off button where ever you want you can also change to simple moving average, exponential moving average and much more types of moving averages to know more about the the indicator and how to use it watch the video linked b
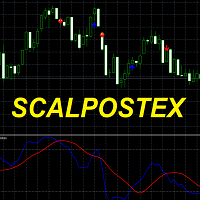
Scalpostex is a ready-made trading system that shows the trader the points and directions for opening orders. The trading system consists of 17 market analysis modules. Scalpostex analyzes the market using indicators, candlestick patterns and resistance/support lines. Using the method of complex market analysis, this indicator is able to predict price movements with high accuracy. How to trade with this indicator (recommendations): We recommend opening trades in the direction of the arrow that
The Price Elevator indicator is developed to help you figure out the general long-term trend of the market. If the price is above the Green separator line, this is a clear indication the bulls are in control. Similarly, the bears are in control if the price continues to trend below the red separator line. Download Price Elevator MT5
Trend Re-entry In this case you would plan your buy entries above the green dotted box (make sure to set the Buy / Sell Retracement Floor=30). The SL should be

Scalping Points XL is a scalping indicator from the "Scalping Points" series. This indicator is designed to show the trader the price reversal points. The indicator has many settings and different modes of operation. Does not redraw its values. Depending on the setting mode, it can draw signals both at the very beginning of the appearance of a candlestick and at its close. The principle of operation of this indicator is to analyze the market for volatile price changes and show the trader signal

Bu gösterge, ağırlık katsayıları olarak sözde "kötü" sayıları kullanır. Karşıtları, bu göstergede de sunulan "iğrenç" sayılardır. Sayıların bu iki sınıfa bölünmesi, belirli bir sayının ikili gösterimindeki birim sayısı ile belirlenen Hamming ağırlığı ile ilişkilidir. Bu sayıları ağırlıklandırma faktörleri olarak kullanmak, trend izleyen bir göstergeyle sonuçlanır. Ayrıca, iğrenç sayılar daha hassas bir gösterge verir ve kötü sayılar muhafazakar bir gösterge verir. Aralarındaki fark çok büyük de
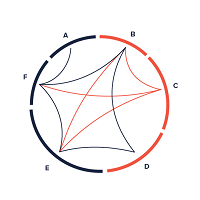
You can use the indicator as the main one to determine the trend. The indicator can work both for entry points and The Chord Trend indicator works well on longer trend sections. In flat it is recommended to use filters of your choice. It can accompany the position with a stop, it is recommended to set the stop at a fixed distance from the point formed by the indicator. If you combine the use of the indicator as an input and accompanying a position, then to accompany the stop it is necessary tha
The indicator uses its own market analysis algorithm that recursively goes through bar-level price movement information such as open, close and shadow prices. With this indicator, you can find the most likely trend reversal points. A simple but effective system for determining the forex trend. From the screenshots you can see for yourself the accuracy of this tool. Works on all currency pairs (cryptocurrencies, raw materials, stocks). The alert system (alert, email notifications) will help you

The purpose of the inidcator is to identify the reversal point.
The blue arrow is buy signal and the yellow star is its stop loss. The red arrow is sell signal and the yellow star is its stop loss. Alert feature: if there is a signal, the indicator will send alerts of popup window,email or mobile push. Inputs: Popup Window Alert: it is false in default Email Alert : it is false in default Mobile Push Alert: it is false in default. MetaTrader 5 Version: Reversal Point Please note that the singa
Bu gösterge, RPTrade Pro Line sistemlerinin bir parçasıdır.
Scalper Pro Line, Fiyat Eylemini kullanan kısa bir trend göstergesidir. Herkes tarafından kullanılmak üzere tasarlanmıştır, ticarete yeni başlayanlar bile kullanabilir. ASLA yeniden boyamaz. Endikasyonlar yakından kapana doğru verilmiştir. Tek başına kullanılmak üzere tasarlanmıştır, başka bir göstergeye gerek yoktur. Belirli bir grafik size geçmiş verilerine göre karı ve nihai düşüşü gösterir.
O nasıl çalışır Scalper Pro Line, b
MetaTrader Mağaza, geçmiş verilerini kullanarak test ve optimizasyon için ticaret robotunun ücretsiz demosunu indirebileceğiniz tek mağazadır.
Uygulamaya genel bakışı ve diğer müşterilerin incelemelerini okuyun, doğrudan terminalinize indirin ve satın almadan önce ticaret robotunu test edin. Yalnızca MetaTrader Mağazada bir uygulamayı tamamen ücretsiz olarak test edebilirsiniz.
Ticaret fırsatlarını kaçırıyorsunuz:
- Ücretsiz ticaret uygulamaları
- İşlem kopyalama için 8.000'den fazla sinyal
- Finansal piyasaları keşfetmek için ekonomik haberler
Kayıt
Giriş yap
Gizlilik ve Veri Koruma Politikasını ve MQL5.com Kullanım Şartlarını kabul edersiniz
Hesabınız yoksa, lütfen kaydolun
MQL5.com web sitesine giriş yapmak için çerezlerin kullanımına izin vermelisiniz.
Lütfen tarayıcınızda gerekli ayarı etkinleştirin, aksi takdirde giriş yapamazsınız.