• Обзор
  • Отзывы
  • Обсуждение

TrendLinePro2

★★★★★4.8(25 reviews) Rating on gogojungle


【 TrendLinePro2 】

   MT4 (MetaTrader 4) line trading aid indicator.

   It is a very basic specification that is recommended for everyone, assuming that it is faithful to the Dow Theory.

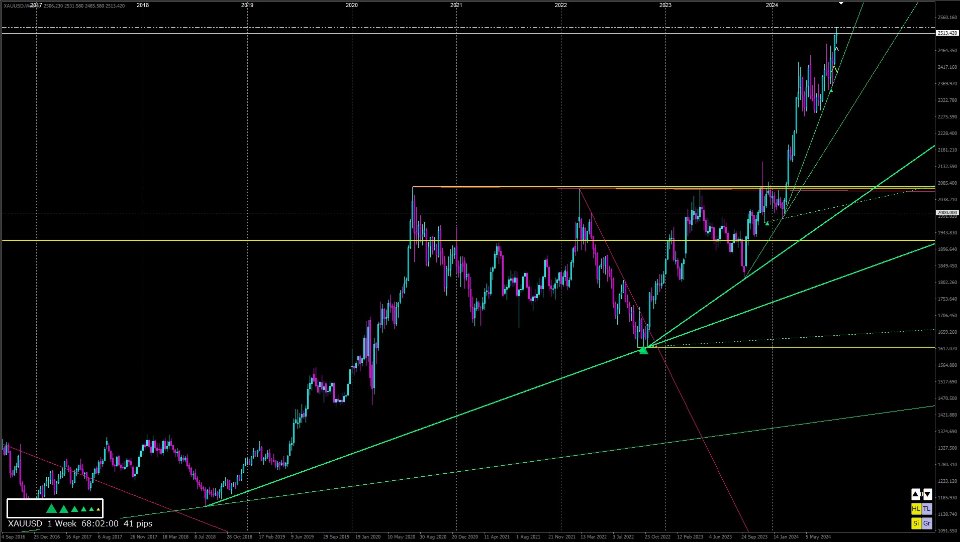
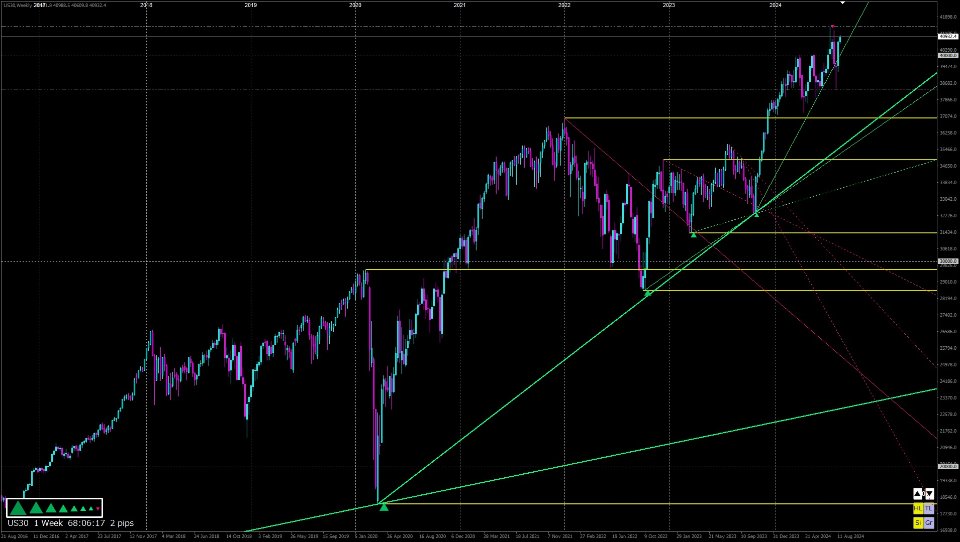
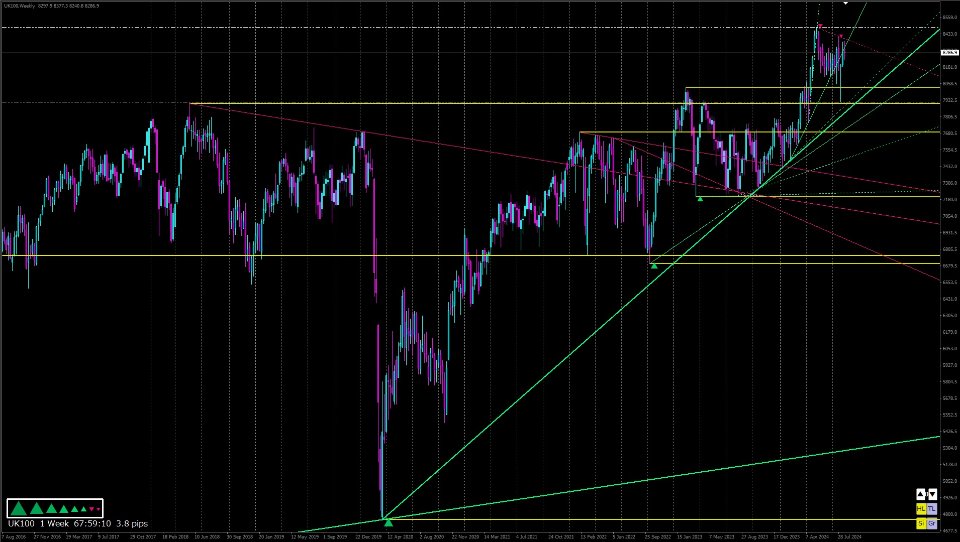
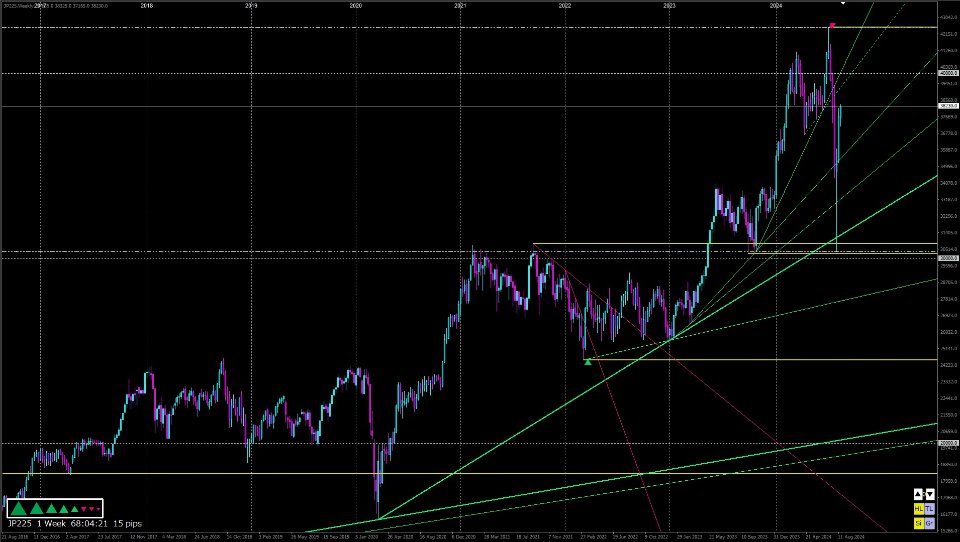
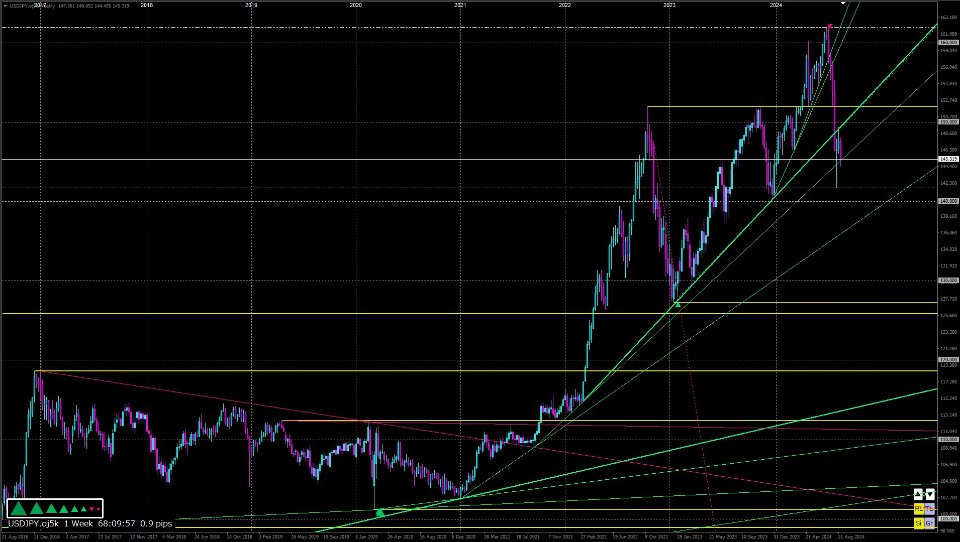
   It recognises trends based on the Dow Theory and furthermore automatically draws support, resistance and trend lines in real time.

   The accuracy is very high.


【 Behaviour check 】

   On Youtube, a video is uploaded every weekend to confirm the behaviour.


【 ZigZag 】

   Based on the original zigzag created from the chart shape and in line with Dow Theory.

   The trend that can be read from the zigzag is bundled up to eight levels in line with Dow Theory.


【 Sign 】

   Shows the trend direction along the 8-step zigzag based on Dow Theory.

   ▲ Green (uptrend) ▼ Red (downtrend) ■ White (trendless)

   ▲Yellow (five or more trends from the minimum indicate an uptrend) ▼Yellow (five or more trends from the minimum indicate a downtrend)


【 Lines 】

   Trendlines, supportlines and resistancelines (Horizon) are drawn along an eight-step zigzag based on Dow Theory.

   The various lines are automatically drawn and deleted at the appropriate time.

   If you want to draw channel lines manually, double-click the line and move it while holding down the Ctrl key.


【 Grid 】

   The vertical (price) and horizontal (time) axes are designed to be delimited at the right place.

   The number of separators can be set to a maximum value, and the number will automatically change accordingly.


【 Parameter

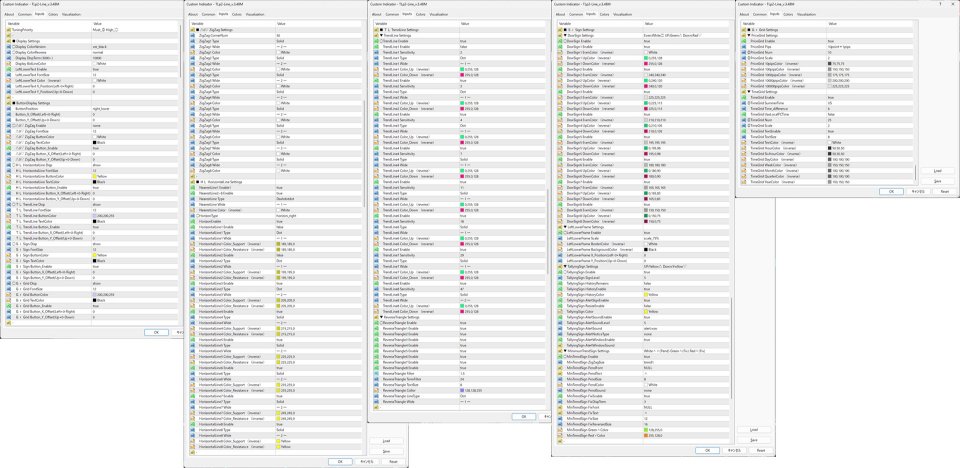
   The parameters are explained below.

ーーーーーーーーーーーーーーー

   TuningPriority → Mark on the left side of each parameter ◎: Change required ○: Change priority

-

■ Display Settings → Item for setting the overall display.


◯Display ColorVersion → Select black if the background is black, or white if it is white. The target parameter has (inverse) next to its name.

◯Display ColorReverse → Change this if you want to invert the green for raising and the red for lowering. The target parameter has (reverse) next to its name.

   Display DispTerm (5000~) → Specify the calculation range. We recommend 5000 or higher.

   Display BidLineColor → Specify the color of the bid line.

   LeftLowerText Enable → Show/hide the text at the bottom left of the chart

   LeftLowerText FontSize → Font size of the text at the bottom left of the chart

   LeftLowerText Color (inverse) → Show the text at the bottom left of the chart

   LeftLowerText X_Position(Left-0+Right) → Move the text at the bottom left of the chart along the horizontal axis

   LeftLowerText Y_Position(Up+0-Down) → Move the text at the bottom left of the chart along the vertical axis

-

■ ButtonDisplay Settings → Settings for the bottom right button of the chart


    ButtonPosition → You can move the bottom right button of the chart to the top right

    Button_X_Offset(Left+0-Right) → Move the bottom right button of the chart on the horizontal axis

    Button_Y_Offset(Up+0-Down) → Move the bottom right button of the chart on the vertical axis

◯△0▽ ZigZag Enable → Display (1~8)/Hide (0) the zigzag

   △0▽ ZigZag FontSize → Bottom right of the chart △0▽ Button text size

   △0▽ ZigZag ButtonColor → Bottom right of the chart △0▽ Button color

   △0▽ ZigZag TextColor → Bottom right of the chart △0▽ Button text color

   △0▽ ZigZag Button_Enable → Bottom right of the chart △0▽ Display/hide the button

   △0▽ ZigZag Button_X_Offset(Left+0-Right) → Bottom right of the chart △0▽ Move the button on the horizontal axis

   △0▽ ZigZag Button_Y_Offset(Up+0-Down) → Bottom right of the chart △0▽ Move the button on the vertical axis

   ◯HL HorizontalLine Disp → Show/hide the horizontal line (Horizon) 

   HL HorizontalLine FontSize → Font size of the HL button on the bottom right of the chart

   HL HorizontalLine ButtonColor → Color of the HL button on the bottom right of the chart

   HL HorizontalLine TextColor → Font color of the HL button on the bottom right of the chart

   HL HorizontalLine Button_Enable → Show/hide the HL button on the bottom right of the chart

   HL HorizontalLine Button_X_Offset(Left+0-Right) → Move the HL button on the horizontal axis on the bottom right of the chart

   HL HorizontalLine Button_Y_Offset(Up+0-Down) → Move the HL button on the vertical axis on the bottom right of the chart

◯TL TrendLine Disp → Show/hide the trend line

   TL TrendLine FontSize → Font size of the TL button at the bottom right of the chart

   TL TrendLine ButtonColor → Color of the TL button at the bottom right of the chart

   TL TrendLine TextColor → Font color of the TL button at the bottom right of the chart

   TL TrendLine Button_Enable → Display/hide the TL button at the bottom right of the chart

   TL TrendLine Button_X_Offset(Left+0-Right) → Move the TL button at the bottom right of the chart along the horizontal axis

   TL TrendLine Button_Y_Offset(Up+0-Down) → Move the TL button at the bottom right of the chart along the vertical axis

◯Si Sign Disp → Display/hide the sign

   Si Sign FontSize → Font color of the SI button at the bottom right of the chart

   Si Sign ButtonColor → Color of the SI button at the bottom right of the chart

   Si Sign TextColor → Font color of the SI button at the bottom right of the chart

   Si Sign Button_Enable → Display/hide the SI button at the bottom right of the chart

   Si Sign Button_X_Offset(Left+0-Right) → Move the Si button at the bottom right of the chart along the horizontal axis

   Si Sign Button_Y_Offset(Up+0-Down) → Move the Si button at the bottom right of the chart along the vertical axis

◯Gr Grid Disp → Show/hide the grid

   Gr Grid FontSize → Font size of the Gr button at the bottom right of the chart

   Gr Grid ButtonColor → Color of the Gr button at the bottom right of the chart

   Gr Grid TextColor → Font color of the Gr button at the bottom right of the chart

   Gr Grid Button_Enable → Show/hide the Gr button at the bottom right of the chart

   Gr Grid Button_X_Offset(Left+0-Right) → Move the Gr button at the bottom right of the chart along the horizontal axis

   Gr Grid Button_Y_Offset(Up+0-Down) → Move the Gr button at the bottom right of the chart along the vertical axis

-

■ △0▽ ZigZag Settings → △0▽ ZigZag Settings

   ZigZag CornerNum → ZigZag display range (number of corners)

   ZigZag1 Type → ZigZag1 line type

   ZigZag1 Wide → ZigZag1 line thickness

   ZigZag1 Color → ZigZag1 line color

   ZigZag2 Type → ZigZag2…

   ※ The rest is the same as 1.

-

■ HL HorizontalLine Settings → HL horizontal line (Horizon) settings

   NearestLine1 Enable1 → Display/hide undetermined most recent high/low line 1

   NearestLine2~8 Enable → Display/hide undetermined most recent high/low line 2~8

   NearestLine Type → Type of undetermined most recent high/low line

   NearestLine Wide → Width of undetermined most recent high/low line

   NearestLine Color (inverse) → Color of undetermined most recent high/low line

◯HorizonType → Select the type of horizontal line (normal, with rate, right side only)

   HorizonEnable → Display/hide horizontal line

   HorizontalLine1 Enable → Display/hide horizontal line 1

   HorizontalLine1 Type → Type of horizontal line 1

   HorizontalLine1 Wide → Width of horizontal line 1

   HorizontalLine1 Color_Support (inverse) → Color of support line of horizontal line 1

   HorizontalLine1 Color_Resistance (inverse) → Color of resistance line of horizontal line 1 

   HorizontalLine2 Enable → Display/hide horizontal line 2…

   ※ The rest is the same as 1.

-

■ TL TrendLine Settings → TL Trendline Settings


▼ TrendLine Settings → Trendline Settings


◯TrendLine Enable → Show/hide trendline

   TrendLine1 Enable → Show/hide trendline 1

   TrendLine1 Sensitivity → Trendline 1 drawing sensitivity (thin out lines below the specified number)

   TrendLine1 Type → Line type of trendline 1

   TrendLine1 Wide → Line width of trendline 1

   TrendLine1 Color_Up (reverse) → Color of trendline 1 rising

   TrendLine1 Color_Down (reverse) → Color of trendline 1 falling

   TrendLine2 Enable → Show/hide trendline 2

   ※ The rest is the same as 1.


▼ ReverseTriangle Settings → Inverse triangle (broadening formation) settings


◯ReverseTriangle Enable → Show/hide inverse triangle

   ReverseTriangle1 Enable → Show/hide inverse triangle 1

   ReverseTriangle2 Enable → Show/hide inverse triangle 2

   ReverseTriangle3 Enable → Show/hide inverse triangle 3

   ReverseTriangle4 Enable → Show/hide inverse triangle 4

   ReverseTriangle5 Enable → Show/hide inverse triangle 5

   ReverseTriangle6 Enable → Show/hide inverse triangle 6

   ReverseTriangle7 Enable → Show/hide inverse triangle 7

   ReverseTriangle8 Enable → Show/hide inverse triangle 8

   ReverseTriangle Filter → Angle magnification/upper limit of inverse triangle

   ReverseTriangle TermFilter → Number of inverse triangles drawn/lower limit

   ReverseTriangle TextSize → Font size of inverse triangle

   ReverseTriangle Color → Line color of the inverted triangle

   ReverseTriangle LineType → Line type of the inverted triangle

   ReverseTriangle Wide → Line width of the inverted triangle

-

■ SI Sign Settings → SI Sign Settings


▼ DowSign Settings → Dow Theory Sign White□Green△Red▽ Settings


◯DowSign Enable → Show/Hide Dow Theory Sign

   DowSign1 Enable → Show/Hide Dow Theory Sign 1

   DowSign1 EvenColor (inverse) → Dow Theory White□ Sign 1 Color

   DowSign1 UpColor (reverse) → Dow Theory Green△ Sign 1 Color

   DowSign1 DownColor (reverse) → Dow Theory Red▽ Sign 1 Color

   DowSign2 Enable → Dow Theory White□ Sign 2…

   ※ The rest is the same as 1.


▼ LeftLowerFrame Settings → Setting the white border at the bottom left of the chart


◯LeftLowerFrame Enable → Show/hide the white border at the bottom left of the chart

   LeftLowerFrame Scale → Display magnification of the white border at the bottom left of the chart

   LeftLowerFrame BorderColor (inverse) → Border color of the white border at the bottom left of the chart

   LeftLowerFrame BackgroundColor (inverse) → Background color of the white border at the bottom left of the chart

   LeftLowerFrame X_Position(Left-0+Right) → Movement of the white border at the bottom left of the chart along the horizontal axis

   LeftLowerFrame Y_Position(Up+0-Down) → Movement of the white border at the bottom left of the chart along the vertical axis


▼ TallyingSign Settings → Setting Yellow△Yellow▽


   Yellow△Yellow▽ that responds when the orientations of 1 to 8 white□green△red▽ are aligned

   When TallyingSign SignLevel = “5” (default value)


   ▽▽▽▲▲▲▲▲ Number of trends = 5 A state where trend directions up to number 5 are aligned with ▲

   ▽▽▲▲▲▲▲▲ Trend count = 6 A state where trend directions up to number 6 are aligned with ▲

   ▽▲▲▲▲▲▲▲ Trend count = 7 A state where trend directions up to number 7 are aligned with ▲

   ▲▲▲▲▲▲▲▲ Trend count = 8 A state where all 8 trend directions are aligned with ▲

   ⑧⑦⑥⑤④③②① Represents the larger standard ⑧ to the smaller standard ①.

   ▼▼▼▼▼▼▼▼ Number of trends = 8 All 8 trend directions are aligned with ▼

   △▼▼▼▼▼▼▼ Number of trends = 7 Trend directions up to 7 are aligned with ▼

   △△▼▼▼▼▼▼ Number of trends = 6 Trend directions up to 6 are aligned with ▼

   △△△▼▼▼▼▼ Number of trends = 5 Trend directions up to 5 are aligned with ▼


◯TallyingSign Enable → Show/hide yellow△yellow▽

   TallyingSign SignLevel → Number of yellow△yellow▽ trends

   TallyingSign HistoryRemains → Keep/do not keep past history after yellow△yellow▽ reversal

   TallyingSign HistoryEnable → Show/hide small yellow△yellow▽ (displayed each time the orientation of white□green△red▽ is aligned)

   TallyingSign HistoryColor → Color of small yellow△yellow▽

   TallyingSign AlertSignEnable → Show/hide large yellow△yellow▽

   TallyingSign ResizeEnable → Displays additional trends when the number of large yellow △ yellow ▽ trends increases

   TallyingSign Color → Color of large yellow △ yellow ▽

   TallyingSign AlertSoundEnable → Enable or disable large yellow △ yellow ▽ alerts

   TallyingSign AlertSoundLevel → Number of trends that trigger a large yellow △ yellow ▽ alert

   TallyingSign AlertSound → Alert sound for large yellow △ yellow ▽

   TallyingSign AlertNoticeType → Alert type for large yellow △ yellow ▽

   TallyingSign AlertWindowEnable → Alert window for large yellow △ yellow ▽

   TallyingSign AlertWindowSound → Cannot be set. MT4 sound settings take priority when the alert window is displayed.


▼ MinimumTrendSign Settings → Settings for updating the most recent high and low values ​​White ∧∨ Green ∧ Red ∨


   White ∧∨: Displayed when the most recent high and low values ​​of the specified small trend are updated (unconfirmed)

   Green ∧ Red ∨: Displayed when the most recent high and low values ​​of the specified small trend are updated (confirmed)

◯MinTrendSign Enable → Display/hide White ∧∨ Green ∧ Red ∨

   MinTrendSign ZigZagSize → Trend size of White ∧∨ Green ∧ Red ∨

   MinTrendSign PendFont → Font of White ∧∨

   MinTrendSign PendText → Display symbol of White ∧∨

   MinTrendSign PendSize → Size of White ∧∨

   MinTrendSign PendColor → Color of White ∧∨

   MinTrendSign PendSound → White ∧∨ alert

   MinTrendSign FixEnable → Show/hide Green ∧ Red ∨

   MinTrendSign FixDispTerm → Number of Green ∧ Red ∨ displayed

   MinTrendSign FixFont → Font for Green ∧ Red ∨

   MinTrendSign FixText → Display symbol for Green ∧ Red ∨

   MinTrendSign FixSize → Size of Green ∧ Red ∨

   MinTrendSign FixReversedSize → Size of Green ∧ Red ∨ when reversed

   MinTrendSign Green∧Color → Color of Green ∧

   MinTrendSign Red∨Color → Color of Red ∨

-

■ Gr Grid Settings → Gr Grid Settings


▼ PriceGrid Settings → Vertical axis (price) grid settings


   PriceGrid Enable → Show/hide vertical axis

   PriceGrid Pips → Vertical axis magnification Corresponds to different magnifications depending on MT4

◎PriceGrid Num → Maximum number of grids on vertical axis when chart is reduced

◎PriceGrid Scale → Number of charts lined up vertically when chart is reduced (affects maximum number of grids when chart is expanded)

   PriceGrid 10pipsColor (inverse) → Color of grid every 10 pips

   PriceGrid 100pipsColor (inverse) → Color of grid every 100 pips

   PriceGrid 1000pipsColor (inverse) → Color of grid every 1000 pips

   PriceGrid 10000pipsColor (inverse) → Color of grid every 10000 pips

   PriceGrid 10000pipsColor (inverse) → Color of grid every 10000 pips

   PriceGrid 100000pipsColor (inverse) → Color of grid every 100000 pips


▼ TimeGrid Settings → Horizontal axis (time) grid settings


   TimeGrid Enable → Show/hide horizontal axis

◎TimeGrid SummerTime → Horizontal axis server time standard (US format for all but XM)

   TimeGrid Time_difference → Adjust horizontal axis time difference

   TimeGrid UseLocalPCTime → Use PC time

◎TimeGrid Num → Upper limit of horizontal axis grids when the chart is reduced

◎TimeGrid Scale → Number of charts lined up vertically when the chart is reduced (Affects the number of grids when the chart is maximized.)

   TimeGrid TextEnable → Show/hide date and time text on the horizontal axis

   TimeGrid TextSize → Date and time text size on the horizontal axis

   TimeGrid TextColor (inverse) → Date and time text color on the horizontal axis

   TimeGrid HourColor (inverse) → Color of grids for every hour

   TimeGrid SixHourColor (inverse) → Color of grids for every six hours

   TimeGrid DayColor (inverse) → Color of grids for every day

   TimeGrid WeekColor (inverse) → Weekly grid color

   TimeGrid MonthColor (inverse) → Monthly grid color

   TimeGrid QuarterColor (inverse) → Quarterly grid color

   TimeGrid YearColor (inverse) → Yearly grid color

ーーーーーーーーーーーーーーー

Рекомендуем также
VR Cub
Vladimir Pastushak
VR Cub это индикатор что бы получать качественные точки входа. Индикатор разрабатывался с целью облегчить математические расчеты и упростить поиск точек входа в позицию. Торговая стратегия, для которой писался индикатор, уже много лет доказывает свою эффективность. Простота торговой стратегии является ее большим преимуществом, что позволяет успешно торговать по ней даже начинающим трейдерам. VR Cub рассчитывает точки открытия позиций и целевые уровни Take Profit и Stop Loss, что значительно повы
Strong Retracement Points Pro edition! SRP (Strong Retracement/Reversal Points) is a powerful and unique support and resistance indicator. It displays the closest important levels which we expect the price retracement/reversal! If all level are broken from one side, it recalculates and draws new support and resistance levels, so the levels might be valid for several days depending on the market! If you are still hesitating to start using this wonderful tool, you can check this link to see how ef
PABT Pattern Indicator - это классическая реализация одного из сигнальных паттернов.  Логика индикатора заключается в том, что он определяет ситуации в которых максимум и минимум сигнального бара находится в пределах максимума и минимума предыдущего бара, тем самым показывает разворот тренда. Для сигнала на покупку сигнальный бар закрывается выше цены открытия, для сигнала на продажу сигнальный бар закрывается ниже цены открытия, предыдущий бар соответственно противоположного сигнальному типа. В
Market Structure Zig Zag
Lesedi Oliver Seilane
4.77 (22)
Free Market structure zig zag to assist in price action trading the screenshots describe how to use and how to spot patterns new version comes with alerts, email alert and  push notification alert can be used on all pairs  can be used on all timeframes  you can add additional confirmation indicators the indicator shows you your higher high and low highs as well as your lower lows and lower highs  the indication makes price action analysis easier to spot.
FREE
Black series MT4 - Индикатор предназначен для торговли на бинарных опционах с Tаймфреймом М1-M5-M15 Мультивалютный (Работает на криптовалюте и на валютных парах) Сигнал появляется при открытии свечи До 90% верных сигналов Полностью отсутствует перерисовка сигналов  Можно использовать с другими индикаторами. Хороший для скальпинга! В Настройках есть: -Методы работы индикатора -И Аллерт Цвет стрелок Красный сигнал вниз Синий сигнал вверх Так же смотрите видео как работает индикатор и появляются си
Next level of trend trading here. Possibility 75%, the indicator analyzes the current market to determine short (small dot), middle (circle with a dot inside) and long (cross with a circle and a dot inside) trends.  Wingdings characters of  Aqua color represents the beginning of the UP trend. Wingdings characters of  Orange color represents the beginning of the DOWN trend. Possibility 75% Indicator will improve your trading in the world of forex, commodities, cryptocurrencies and indices.
Fourteen plus nine What is it for? Applying Tom DeMark’s TD Sequential serves the purpose of identifying a price point where an uptrend or a downtrend exhausts itself and reverses. . What are the main components of TD Sequential? TD Sequential has two parts – TD Setup and TD Countdown. The first phase of TD Sequential starts with a TD Setup and is completed with a 9 count. When the 9 count is completed, it is at that point, a price pause, price pullback, or reversal is likely. It is also at tha
Noize Absorption Index - is the manual trading system that measures the difference of pressure between bears forces and bulls forces. Green line - is a noize free index that showing curent situation. Zero value of index shows totally choppy/flat market.Values above zero level shows how powerfull bullish wave is and values below zero measures bearish forces.Up arrow appears on bearish market when it's ready to reverse, dn arrow appears on weak bullish market, as a result of reverse expectation. S
Owl smart levels
Sergey Ermolov
4.13 (23)
Версия MT5  | Как установить?  | FAQ Индикатор Owl Smart Levels   – это полноценная торговая система внутри одного индикатора, которая включает в себя такие популярные инструменты анализа рынка как усовершенствованные   фракталы Билла Вильямса , Valable ZigZag, который строит   правильную волновую структуру   рынка, а также  уровни Фибоначчи,   которые   отмечают точные уровни входа в рынок и места взятия прибыли. Подробное описание стратегии Инструкция по работе с индикатором Советник-помошник
Forex Gump
Andrey Kozak
2.75 (4)
Forex Gump - это полностью готовая полуавтоматическая торговая система. В виде стрелок на экран выводятся сигналы для открытия и закрытия сделок. Все, что вам нужно, это следовать указаниям индикатора. Когда индикатор показывает синюю стрелку, Вам нужно открывать ордер на покупку. Когда индикатор показывает красную стрелку, нужно открывать ордер на продажу. Закрываем ордера когда индикатор рисует желтый крестик. Для того, чтобы получить максимально эффективный результат, рекомендуем использовать
Это трендовый индикатор без перерисовки Разработан вместо стратегии бля бинарках опционов (по цвету свечи мартингейл) Так же хорошо работает в торговле на рынке форекс Когда открывать сделки ( бинарные опционы ) Сигнал появится в месте с свечой сигналит на текущую свечу  Открывать сделку стоит на одну свечу текущего таймфрейма рекомендуется м1 и М5 При появлении синей точки открываем сделку вверх При появлении красной точки открываем сделку в низ. Как открывать сделки на Форекс. При полу
"Тренд - друг трейдера" . Это одна из самых известных пословиц в трейдинге, потому что правильное определение тренда может помочь заработать. Однако проще сказать о торговле по тренду, чем сделать, потому что многие индикаторы основаны на развороте цены, а не на анализе тренда. Они не очень эффективны при определении периодов тренда или в определении того, сохранится ли этот тренд. Мы разработали индикатор Trendiness Index , чтобы попытаться решить эту проблему. Индикатор определяет силу и напра
GMMA Trade X is an EA based on GMMA. GMMA parameters such as MovingAveragePeriod1-24, MovingAverageMAShift1-24, MovingAverageShift1-24 and CandlestickShift1-24 can be adjusted. GMMA Trade X applies BTN TECHNOLOGY's state-of-the-art intelligent technology to help you create optimal results for your trades. May your dreams come true through GMMA Trade X. Good luck. = == == Inquiries = == == E-Mail:support@btntechfx.com
Данный индикатор отображает на графике цены сигналы Stochastic osc и предоставляет возможность пользователю получать уведомления о таких сигналах. Индикатор  Stochastic является классическим и проверенным индикатором технического анализа рынков. Несмотря на свой возраст актуален и на данный момент.  В зависимости от настроек индикатор позволяет эффективно работать на различных TF и любых рынках. Сигналы подаются на полностью сформированных барах и не перерисовываются.   Настраиваемые параметры
FREE
Chart Patterns Detect 15 patterns (Ascending Triangle, Descending Triangle, Rising Wedge, Falling Wedge, Bullish Flag, Bearish Flag, Bullish Rectangle, Bearish Rectangle Symmetrical triangle, Head and Shoulders, Inverted Head and Shoulders, Triple top, Triple Bottom, Double Top, Double Bottom) Use historical data to calculate the probability of each pattern to succeed (possibility to filter notification according to the chance of success) gives graphic indication about the invalidation level and
Fibonacci indicator based on fractal.This software can automatically draw the golden section proportional line of two trend lines, and mark all the recent high and low prices.And the percentage value of volatility is a multi-cycle, multi-currency oscillation indicator.It is very effective for traders to find support and resistance lines and find entry and exit points near them.
The Stepping Trend Indicator     The Steppi ng Trend indicator uses the  average true range  (ATR indicator) in its calculation. This gives you control to set your own average true range period, I set the Default as 10.   Indicator Details. Green Arrow Up: This means you are at the starting point of a new bullish trend, it’s time to buy.   Red  Arrow  Down : This means you are at the starting point of a new  bearish  trend, it’ s time to sell .   What if you miss the Arrow Signal?   No
For sure, this indicator has become very popular amongst traders. Through coding this indicator will give you the most accurate levels possible for your trading analysis. We have also added in the ability for you to receive alerts when the price breaks above or below a Support or Resistance lines! HOW TO USE The red rectangles represent your resistance/supply zone. The green rectangles represent your support/demand zone.  BONUS FEATURES We coded this indicator with the ability to switch between
Insider Scalper Binary   этот инструмент создан для торговли бинарными опционами на короткие вpеменые промижутки. заключить сделку стoит в момент получения сигнала и только на 1 свечу если это м1 то только на минуту и так в соответствии с таймфреймом. для лучших результатов нужно подбирать хорошо волотильные графики.... рекомендованые валютные пары  eur|usd, usd|jpy.... индикатор уже настроен вам остается только добавить его на график и торговать.... Сигнал может пропасть до закрытия свечи Индик
Advance Currency Meter is a currency meter that detects strong market trends. This indicator is good for scalping, intraday trading and swing trading. The indicator will detect short term to long term market trends. This will give you good insight which currencies are best to trade as of the moment. Note : Kindly contact me before you make any purchases. Works well with my MACD Currency Strength Meter
Ловец трендов: Стратегия Ловец трендов с индикатором оповещения - это универсальный инструмент технического анализа, который помогает трейдерам определять рыночные тренды и потенциальные точки входа и выхода. Он представляет собой динамичную стратегию Ловец трендов, адаптирующуюся к рыночным условиям для четкого визуального представления направления тренда. Трейдеры могут настраивать параметры в соответствии со своими предпочтениями и уровнем риска. Индикатор помогает в идентификации тренда,
FREE
Shark Deal Book
Philip Pankaj Suthagar
4 (3)
Term  "shark"  in the business world denotes a high volume investor who just made a good investment in a highly Potential business deal.So, sharks are the ones who make the market move. In our case, if an American shark bought a Japanese company, he/she has to convert American dollars into Japanese yen to make the deal. So, the demand for the Japanese yen will increase sharply. Thus USD/JPY will go short rapidly if the deal was from the shark. Another example, In the case of forex, if fed increa
Индикатор тренда Riko Trend - революционное решение для торговли по трендам и фильтрации со всеми важными функциями инструмента тренда, встроенными в один инструмент! Индикатор Riko Trend хорош для любого трейдера, подойдет любому трейдеру как для форекс так и для бинарных опционов. Ничего настраивать не нужно все отточено времинем и опытом, отлично работает на во время флета та и в тренде. Индикатор тренда Riko Trend это инструмент технического анализа финансовых рынков, отражающий текущие о
Daily Candle Predictor - это индикатор, который предсказывает цену закрытия свечи. Прежде всего индикатор предназначен для использования на графиках D1. Данный индикатор подходит как для традиционной форекс торговли, так и для торговли бинарными опционами. Индикатор может использоваться как самостоятельная торговая система, так может выступать в качестве дополнения к вашей уже имеющейся торговой системе. Данный индикатор производит анализ текущей свечи, рассчитывая определенные факторы силы внут
The Chaikin Oscillator is a technical indicator developed by Marc Chaikin that combines price and volume data to measure the accumulation and distribution of a financial instrument. It aims to identify potential buying and selling opportunities in the market. The Chaikin Oscillator is calculated by subtracting a 10-day exponential moving average of the Accumulation Distribution Line (ADL) from a 3-day exponential moving average of the ADL. Here's how to use the Chaikin Oscillator indicator in tr
IconTradeSL.  Возможность выставлять sl по уровням. В индикаторе установлена возможность показывать историю уровней на графике. Возможность выставлять sl по уровням. Настройки индикатора: ЦВЕТ_BAR - цвет баров по которым ищем SL ЦВЕТ_Тек_BAR - Purple;//цвет текущего бара BAR - поиск в последних BAR барах (по умолчанию 200) show_bar - показывать бары по которым ищем SL
Introduction It is common practice for professional trades to hide their stop loss / take profit from their brokers. Either from keeping their strategy to the themselves or from the fear that their broker works against them. Using this indicator, the stop loss / take profit points will be drawn on the product chart using the bid price. So, you can see exactly when the price is hit and close it manually.  Usage Once attached to the chart, the indicator scans the open orders to attach lines fo
Индикатор для бинарных опцыонов стрелочный прост в использовании и не требует настройки работает на всех валютных парах акцыях крипто валюте сигнал на покупку синяя стрелка вверх  сигнал на продажу красная стрелка в низ  советы не стоит торговать во время новостей и за 15-30 минут перед их выходом так как рынок слишком волотилен и очень много шума  входить в сделки стоит на одну или две свечи от текущего периода ( рекомендуется на 1 свечу ) таймфрейм до м 15 рекомендуемый мани менеджмент фиксир
5 signal in 1  Product     TimeFrame   Recommend   1m-5m recommend  signal   TF  5m    Banks Pro Binary Option is Indicator for binary option Can Use Manaul Trade or Robot on Platform  Mt2Trading  https://www.mt2trading.com/?ref=104    Time Trading   good work  EU session    Recommend  Curency   EUR  GBP USD        careful   AUD JPY      Recommend  Martingale 2-5 Step   Recommend  set profit  2%-5%/Day Setting Brake  News Event High volatility   recommend  15-30 min Have Problem Contract
Diamond PRO
Fanur Galamov
4.84 (19)
Diamond PRO is enhanced powerful version of Diamond for advanced traders. Pro version includes optimized cores, new impoved entry points filters, new multistage profit closure algorithm and сontains number of external control parameter that allows build and fine tune own tradind decisions and algorithms. The system provides more accurate market entries, analyzes and filters upcoming economic news, contains spread protection and an advanced position management algorithm. Main goal of Diamond PRO
С этим продуктом покупают
ПОЖАЛУЙСТА, ПРОЧТИТЕ ИНФОРМАЦИЮ НИЖЕ ПЕРЕД ПОКУПКОЙ! Apollo Pips PLUS SP – уникальный продукт! ЭТО ДЛЯ ТЕХ, КТО ХОЧЕТ ПОЛУЧИТЬ МОЙ НОВЫЙ ИНДИКАТОР «APOLLO PIPS» + БОНУС «SUPER PACK» С ДОСТУПОМ КО ВСЕМ МОИМ ТОРГОВЫМ ИНДИКАТОРАМ! Покупая продукт Apollo Pips PLUS SP, вы фактически приобретаете абсолютно новую версию моего индикатора Apollo Pips. Эта версия индикатора имеет улучшенный алгоритм и простой в использовании параметр, который дает вам возможность использовать индикатор на любом рынке и в
Connect Indicator
Sukunthakan Ngernbamrung
Connect Indicator is a tool used for connecting indicators between the MQL market and MT4. The connected indicators are made by our group and can be used for other applications, such as sending messages to the Line application or Telegram application. If you have any questions, please don't hesitate to ask us to receive support. Function and indicator buffer Buffer one is the high price of the previous candle. Buffer two is the high price of the previous candle. Usage To connect indicators to fu
Enigmera
Ivan Stefanov
5 (2)
ЭНИГМЕРА: ядро рынка https://www.enigmera.com Введение Этот индикатор и торговая система представляют собой удивительный подход к финансовым рынкам. ENIGMERA использует фрактальные циклы для точного расчета уровней поддержки и сопротивления. Он показывает подлинную фазу накопления и дает направление и цели.  Система, которая работает независимо от того, находимся ли мы в тренде или в коррекции.  Как она работает? ENIGMERA состоит из трех линий: линии поддержки/сопротивления, линии цели и ли
Indicator : RealValueIndicator Description : RealValueIndicator is a powerful tool designed specifically for trading on the EURUSD pair. This indicator analyzes all EUR and USD pairs, calculates their real currency strength values, and displays them as a single realistic value to give you a head start on price. This indicator will tell you moves before they happen if you use it right. RealValueIndicator allows you to get a quick and accurate overview of the EURUSD currency pair tops and bottoms,
Данный индикатор предназначен для работы на любом ТФ. Программа на основе авторских алгоритмов и математике W.D.Ganna позволяет рассчитать целевые уровни движения цены по трем точкам с высочайшей степенью достоверности. Является прекрасным инструментом для биржевой торговли. Индикатор оснащен тремя кнопками NEW - вызвать треугольник для расчета. DEL - удалить выбранный треугольник. DELS - полностью удалить все построения. Вероятность достижения целей более 80%. Так же индикатор оснащен сигналом
TrendMaestro
Stefano Frisetti
5 (3)
note: this indicator is for METATRADER4, if you want the version for METATRADER5 this is the link:  https://www.mql5.com/it/market/product/108106 TRENDMAESTRO ver 2.4 TRENDMAESTRO recognizes a new TREND in the bud, he never makes mistakes. The certainty of identifying a new TREND is priceless. DESCRIPTION TRENDMAESTRO identifies a new TREND in the bud, this indicator examines the volatility, volumes and momentum to identify the moment in which there is an explosion of one or more of these data a
Max Payne - это индикатор сигналов разворота/тренда, который подает сигналы в виде стрелки. Этот индикатор подает сигнал при закрытии одного и того же бара. Этот индикатор можно опускать на график несколько раз с разными периодами, чтобы получить двойное или тройное подтверждение сигналов. Индикатор легко настраивается, чтобы соответствовать любому стилю торговли, при этом он никогда не перерисовывается и не перерисовывается. После покупки вы получите полную систему, показанную на скриншотах, в
JULY OFFER 80% OFF next price for unlimited version will be 17000$. This is the only time you can get this institutional and professional indicator at this price for unlimited version. Don't dare to miss this. The tool I am about to introduce to you you can't compare it with other tools due to its strategy and accuracy level in predicting the next price directional movement . This tool is designed for serious traders who have decided to make a difference through trading. Be the next person to wi
Dear Traders this is my another tool called " Swing Master Indicator ". As the name above the indicator is designed to help you in swing trading by capturing the low and highs of the price. You may us this tool with any trading strategy and style from scalping to position trading. It is made for level of traders including newbies and advanced traders even prop-firms, hedge funds and banks to help them make sold market analysis. I create tools for serious traders who want to make a difference in
Индикатор " ZigZag on Trend " представляет из себя помощника в определении направления движения цены, а так же калькулятора баров и пунктов. Состоит из трендового индикатора, следящей за направлением цены трендовой линией представленной в виде зигзага и счетчика вычисляющего число баров пройденных в направлении тренда и количество пунктов по вертикальной шкале.(расчеты ведутся по открытию бара) Индикатор не перерисовывается. Для удобства исполнен в виде окрашенных баров или в виде линий. Можно и
Сигнал банка-бомбы: индикатор вашей уверенности в MetaTrader 4 Bomb Bank Signal — мощный индикатор для MetaTrader 4, предназначенный для выявления наиболее актуальных тенденций финансового рынка. Если вы ищете инструмент, который точно предугадывает движения, Bomb Bank — ваш союзник. Как это работает: Этот индикатор сочетает в себе три различных метода — анализ объема, закрытие свечей и симметричный тренд — для обнаружения и сигнализации о возможностях покупки и продажи. Банк-бомба похож
Contact us to receive a comprehensive user guide after purchasing. William Delbert Gann, commonly known as W.D. Gann, was an exceptional market analyst renowned for his unique trading style in the early 20th century.  His trading techniques were based on a blend of mathematics, geometry, astrology, and ancient mathematics. Gann believed that stock market movements followed specific patterns and cycles, rather than being random. His methodologies, celebrated for their accuracy and relevance, con
NOTE: PRICE WILL RISE VERY SOON. DON'T SKIP THIS OFFER! Dear traders I am glad to introduce the " Market Swing Scanner Board" indicator to you. This indicator was made mainly to be used in combination with the Market Swing Index Indicator. You use the  "Market Swing Scanner Board"  indicator to scan for trading opportunities on the  Market Swing Index Indicator . This tool is designed for serious traders who have decided to make a difference through trading. Be the next person to witness this st
Данный индикатор основан на математике великого трейдера W.D.Ganna.  С помощью его мы с легкостью найдете сильные уровни анализируя свинг для поиска оптимальной точки входа. Индикатор работает на всех инструментах и всех тайм фреймах. Индикатор полностью ручной и оснащен кнопками управления. Все что вам нужно это нажать на кнопку NEW, появится отрезок, данный отрезок вы размещаете на любое движение, свинг или даже 1 свечу, которую хотите проанализировать. Разместив отрезок нажимаете кнопку ОК. П
The indicator of a Professional Trader - это стрелочный индикатор для прогнозирования направления движения цены. Над этим индикатором я работаю с 2014 года.  Вы можете использовать этот индикатор в качестве основного, использовать его сигналы для входа и использовать его в качестве единственного индикатора для поиска точек входа. О продукте: Рекомендуемый TF [H4-D1-W1] . Индикатор предсказывает направление движения следующей свечи.  Подходят множество инструментов; Гибкость в настройках под
Это индикатор за самые большие деньги. Он обладает исключительными характеристиками. Какой бы интерес ни был на рынке, вы увидите его.  Почти во всех случаях он дает вам только долгосрочный взгляд на рынок, но не обманывайтесь, думая, что он привязан к событиям. Ничего подобного. Он находит, где на рынке находится наибольший интерес, и показывает его вам. Не забывайте, что самые большие деньги (проценты) не отображаются на рынке каждый день. Это то, с чем вы еще не сталкивались. Цена разумная
Цикличный индикатор для торговли и прогнозирования направления рынка. Показывает цикличное поведение цены в виде осциллятора. Дает сигналы открытия сделок при отбое от верхних и нижних границ осциллятора. В виде гистограммы показывает сглаженную силу тренда. Дополнит любую стратегию торговли, от скальпинга до внутри-дневной. Индикатор не перерисовывается. Подходит для использования на всех символах/инструментах. Подходящие тайм-фреймы для краткосрочного трейдинга M5, M15, M30. Для дневной и бо
Full Forex Market View Dashboard
Opengates Success International
5 (2)
ПОЛНЫЙ ОБЗОР РЫНКА FOREX Индикатор приборной панели Это пользовательский индикатор, созданный, чтобы дать трейдерам полное представление о том, что происходит на рынке. Он использует данные в режиме реального времени для доступа к рынку и отображения каждого бита информации, необходимой для успешной торговли. МОНТАЖ: Прежде чем прикреплять этот индикатор к оконному графику, перейдите на панель «Обзор рынка» вашего MT4 и СКРЫТЬ все валютные пары, которые вам не нужны или которыми вы торг
Gann Signal - очень простой на первый взгляд индикатор, но внутри скрыт многолетний опыт изучения методов W.D.Ganna. Индикатор дает точные BUY/SELL сигналы, без перерисовки. Индикатор очень прост в применении. Вам нужно лишь прикрепить его на график и следовать его рекомендациям. Индикатор постоянно ведет анализ рынка на предмет возможностей для входа. Когда такая возможность появляется, индикатор дает сигнал в виде стрелки. Повторяюсь, все сигналы НЕ ПЕРЕРИСОВЫВАЮТСЯ! Индикатор предназначен для
The Nihilist 5.0 Indicator includes Forexalien and Nihilist Easy Trend trading strategies and systems. It is composed of an MTF Dashboard where you can analyze the different input possibilities of each strategy at a glance. It has an alert system with different types of configurable filters. You can also configure which TF you want to be notified on your Metatrader 4 platform and Mobile application The indicator has the option to view how could be a TP and SL by using ATR or fixed points, even
Moving pivot Average Fibonacci The  indicator compares the selected period with its counterpart from the previous period. The indicator determines the moving Fibonacci levels for the day or any time interval to assess the price movement range from the time average. The indicator helps predict the expected high or low for the day based on historical time data. The pivot line can be considered an average trend line and use it in a variety of trading strategies. If you have any question about t
Al in one level
Kundan Kumar Srivastava
User feedback : "This indicator is collection of important dynamic support and resistance giving a trader crystal clear idea , where to sell and where to buy. it completely complements trend lines, support, resistance, and sideways market and allow a trader to make sustainable profits. The thickness of lines suggests its strengths, the thicker the dynamic line, the stronger is rejection or pullback allowing a trader to make multi-fold profit, as they can clearly see them." Introducing Your Ult
Dear Onis, This Indicator is used for   GBPUSD, US30 and GOLD on 1-Min Chart . For US30 , Depending on your broker, Minimum Lot Size will differ from 0.01 to 1.0 lots. My Current Account is trading at 1.0 lots at $1 per point . Please check with your Broker what's the Margin Required for your Minimum lot sizes before you trade on your Real account. I have Forward Tested the indicator for around 6 months before releasing it to the public. ( No Demo is available for the Indicator, Strategy
Currently Price 20% OFF ( for unlimited use )   BONUS  AUX VIP Club 2024 : Include  EA Airbag  and  Load Data History  to enhance the performance of this tool to its maximum potential  Click Here to Download Files   ( for users only )   Hello World! Introducing.. SMCpro VIP tool and Indicator for MetaTrader 4, designed to revolutionize your trading experience with the ICT Smart Money Concept. This system is meticulously crafted to empower traders with advanced insights and precision in
Индикатор Full STO (включает в себя все версии трех индикаторов STO: Premium, Gold, Silver) - STABLE TRADE OPTION предназначен для автоматической торговли бинарными опционами.  ЧИТАЕМ ВНИМАТЕЛЬНО!!!!! ВАЖНО В одном терминале создаем два шаблона с разными экспирациями, шаблон на 18:01, 18:02 с экспирацией от 1 до 15 минут и шаблон 22:00 c экспирацией от 10 до 20 минут. Winrate: 71% over the past 5 years Money management: 0.3% from the deposit Данная версия индикатора настроена только на
This indicator uses support and resistance, volume and some special formula to calculate the volume to filter the candles. If the volume reaches a specific value, And at the same time, Candle breaks the support/resistance line, There would be a signal and we can enter the market. Signals appear when the current candle closes. then you can enter the trade when a new candle appears. Please don't forget to follow your money management plan. MT5 Version Support/Resistance Breakout MT5 :   https:
WARNING: PRICE IS SUBJECT TO RISE AT ANY TIME. GET YOUR COPY TODAY TO AVOID MORE COST! Dear Traders I am so glad to introduce to you my other tool called the Forex Sniper Entries Indicator. This tool is designed to help serious traders and investors capture big moves in the currency price movements. The philosophy behind this tool is all about winning big and riding the price movement from its beginning until the maximum point. We want to capture those big moves in both down and up markets as mu
FxBears Powers работает со всеми валютными парами, металлами, товарами, фьючерсами, индексами, энергоносителями, криптовалютой и всем ... и на всех таймфреймах от M1 до MN. Он основан на спросе и предложении и некоторых внутренних индикаторах, он дает вам очень сильную точку входа с нулевым проскальзыванием большую часть времени, вы можете проверить это в тесте. Он мгновенно отправляет вам сигналы на платформу вашего телефона, где бы вы ни находились, он содержит название пары, время, таймф
WARNING!! THIS SWORD IS TOO SHARP!    ONLY 10 COPIES LEFT FOR THE NEXT PRICE TO BE 8,000$ FOR UNLIMITED PLAN. Dear traders I am very glad once again to introduce to you my other tool called "Forex Sword Indicator". In short this tool is meant to give you an edge over the market that you have been waiting for  so long. Now, here it is. It is a very very simple tool but yet a dangerous sword. I call it a  Holy grail indicator!. I will not talk a lot about this tool. Just let the tool speak by itse
Limitless MT4    - это универсальный индикатор который подойдет каждому как начинающему так и опытному трейдеру работает на всех валютных парах криптовалютах сыре акциях Limitless MT4 - уже настроен и не требует дополнительной настройки   А теперь главное Почему    Limitless MT4 ? 1 полное отсутствие перерисовки  2 два года тестирования лучшими специалистами в трейдинге 3 точность правильных сигналов превышает 80% 4 хорошо показал себя в торговле во время выхода новостей Правила торговли  1 сигн
Фильтр:
Нет отзывов
Ответ на отзыв