• 概要
  • レビュー
  • コメント

TrendLinePro2

★★★★★4.8(25件) ゴゴジャングルでの評価
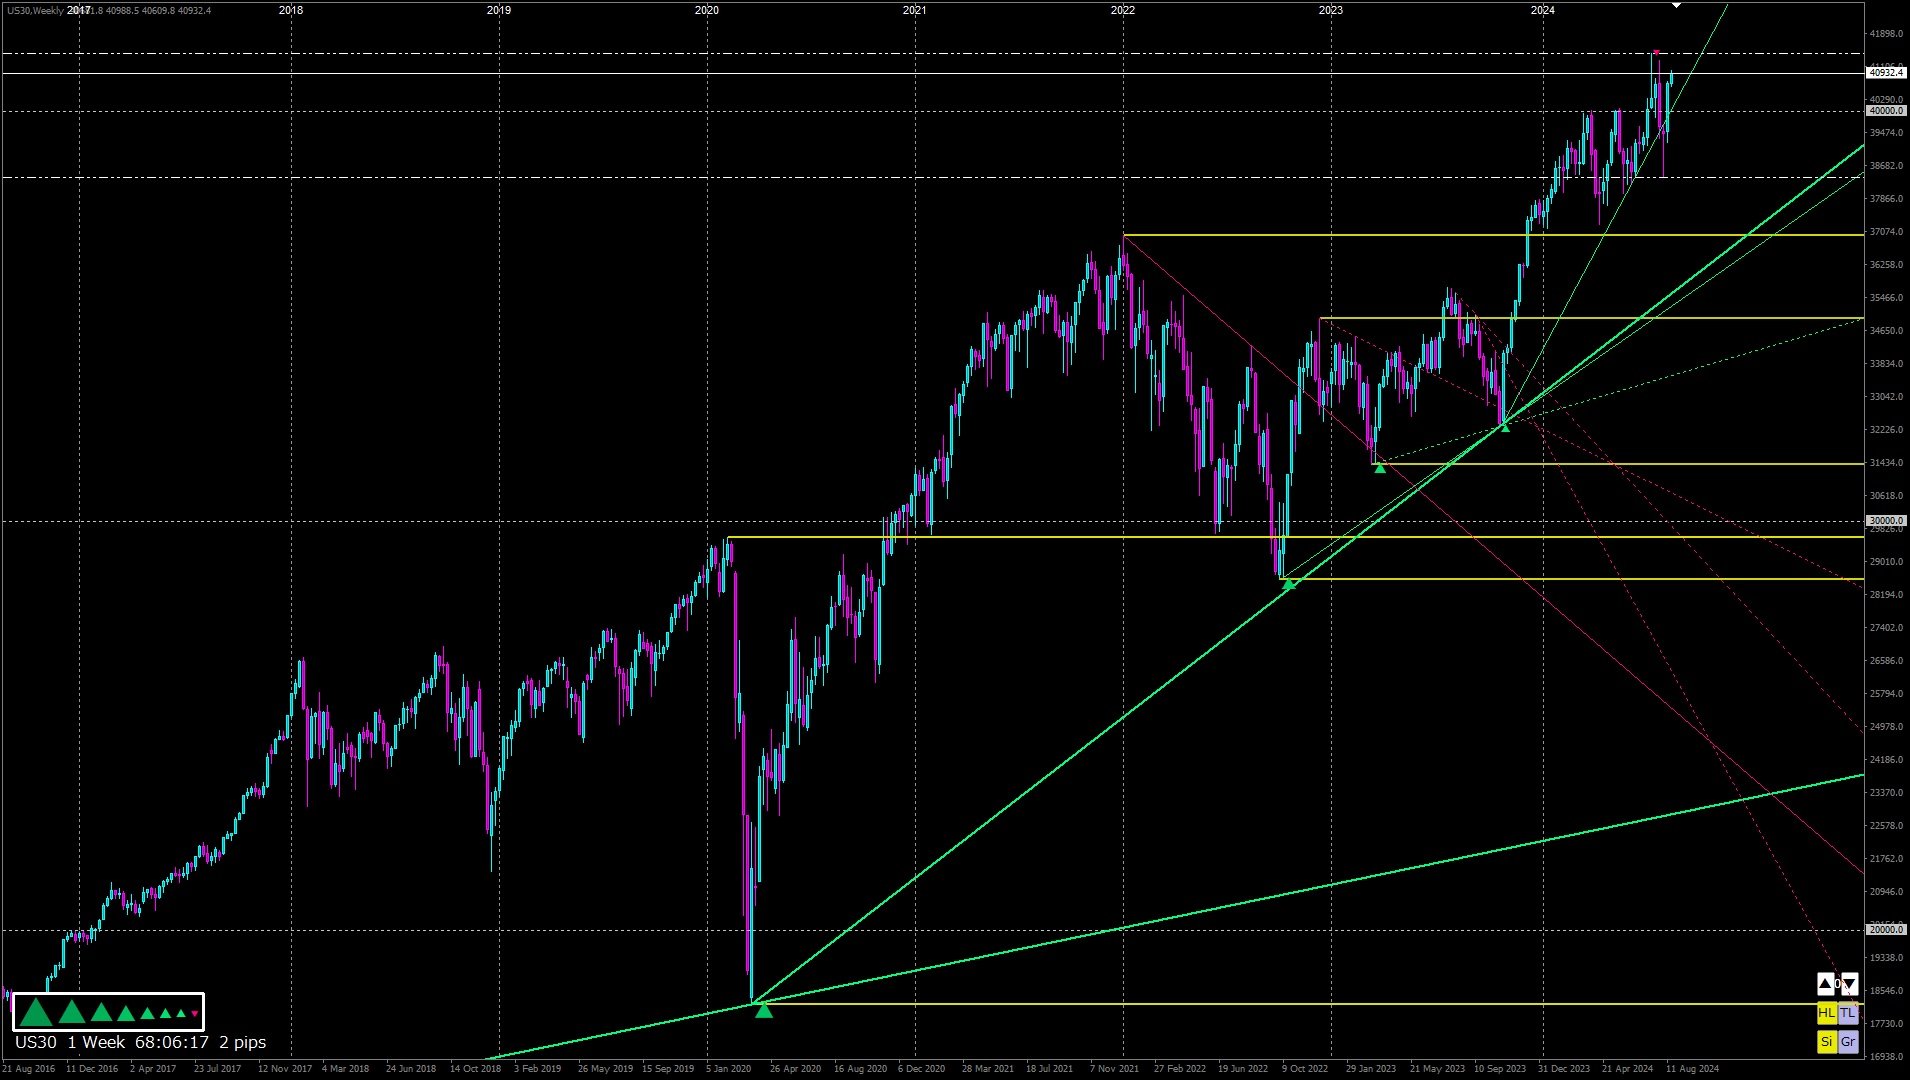
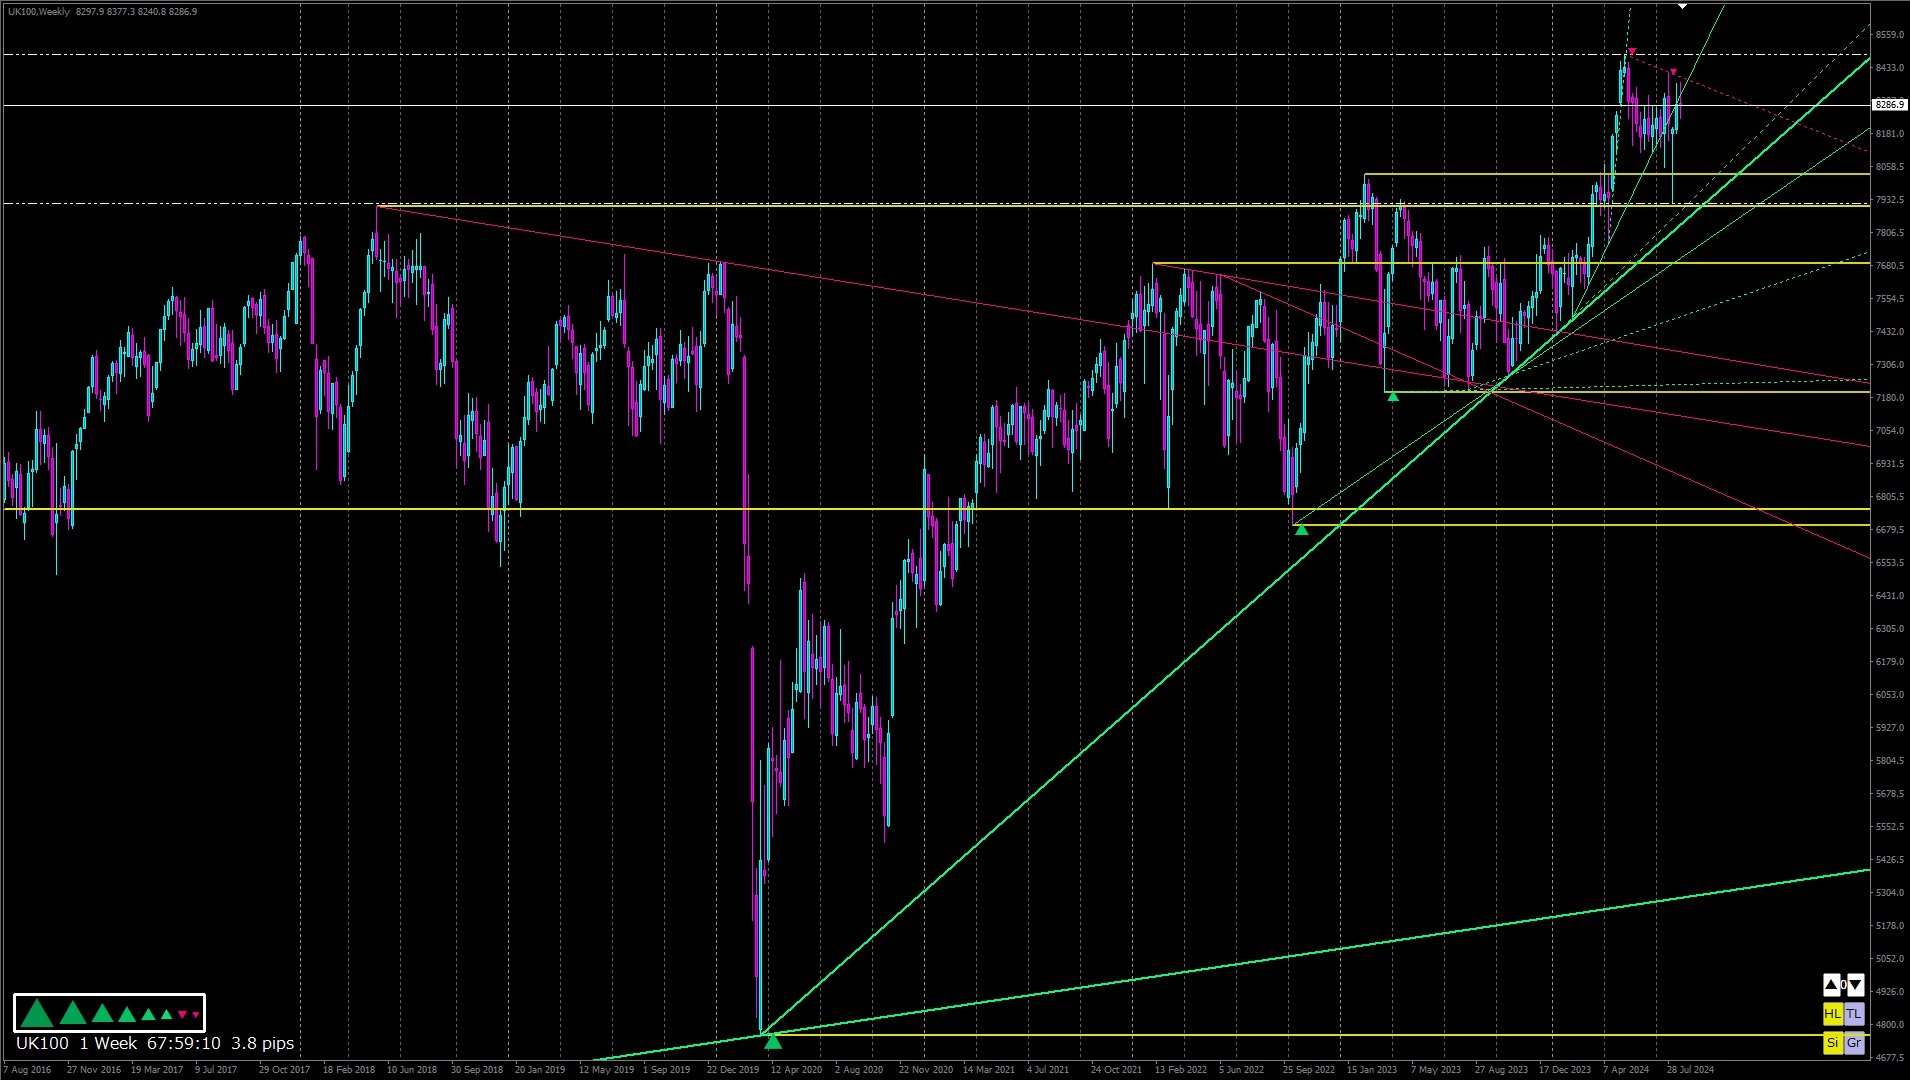
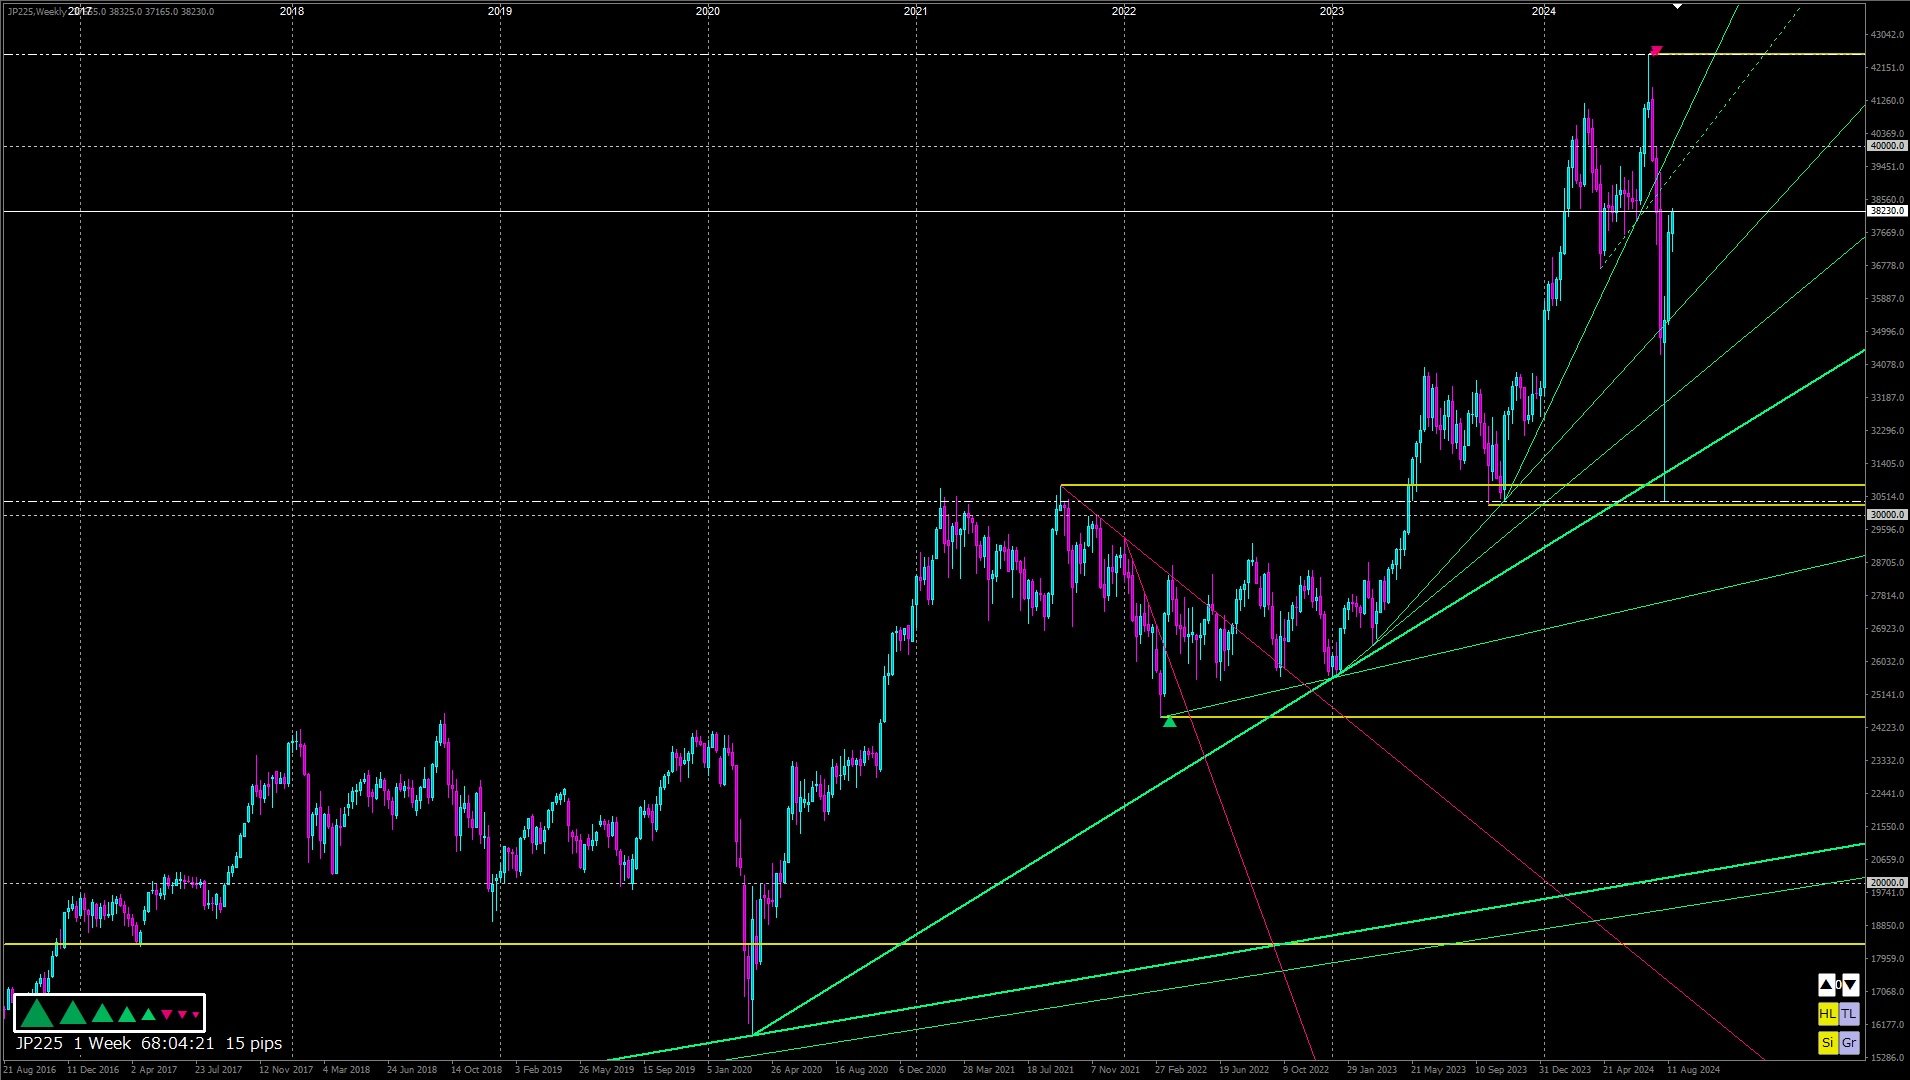
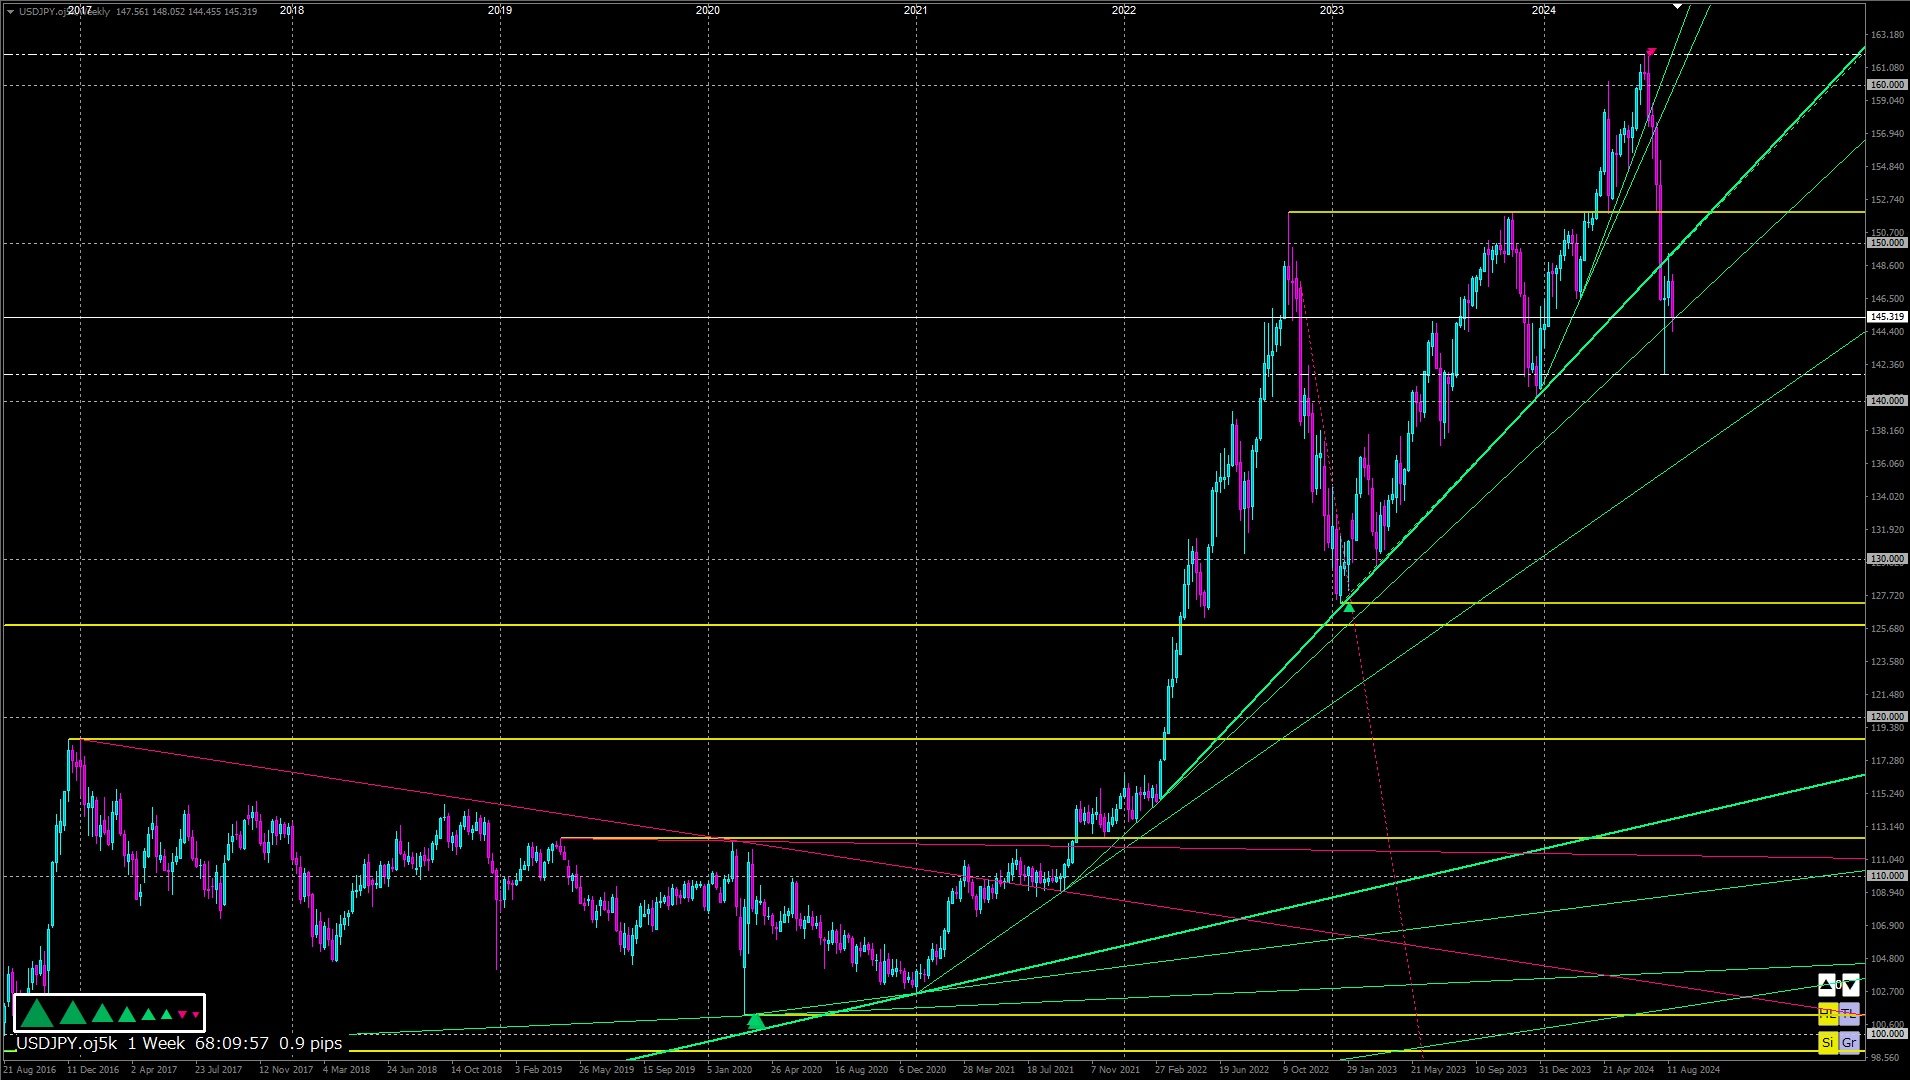

【トレンドラインPro2】

MT4(MetaTrader4)ライントレード補助インジケーターです。

ダウ理論に忠実であることを前提とした、誰にでもお勧めできる、とてもベーシックな仕様です。

ダウ理論に基づくトレンドを認識し、さらにサポートライン・レジスタンスライン・トレンドラインをリアルタイム自動描画・自動削除します。

精度は非常に高いです。


【挙動確認】

Youtubeでは、毎週末に挙動確認用動画をアップしています。


【ZigZag】

チャート形状から作られる、ダウ理論に沿ったオリジナルのジグザグをベースとしています。

ジグザグから読み取れるトレンドは、ダウ理論に沿って8段階まで束ねられています。


【Sign】

ダウ理論に基づく8段階のジグザグに沿って、トレンド方向を表示します。

▲緑(アップトレンド) ▼赤(ダウントレンド) ■白(トレンドレス)

▲黄(最小から5つ以上のトレンドが上を示している) ▼黄(最小から5つ以上のトレンドが下を示している)


【Lines】

ダウ理論に基づく8段階のジグザグに沿って、トレンドライン・サポートライン・レジスタンスラインを引きます。

各種ラインは、適切なタイミングで自動描画・自動削除されます。

手動でチャネルラインを引きたい時は、ラインをダブルクリックして、Ctrlキーを押しながら移動させます。


【Grid】

縦軸(価格)・横軸(時間)は、キリの良い場所で区切り線を入れる仕様としています。

区切りの本数は最大値を決めることができ、それに合わせて自動で本数が変動します。
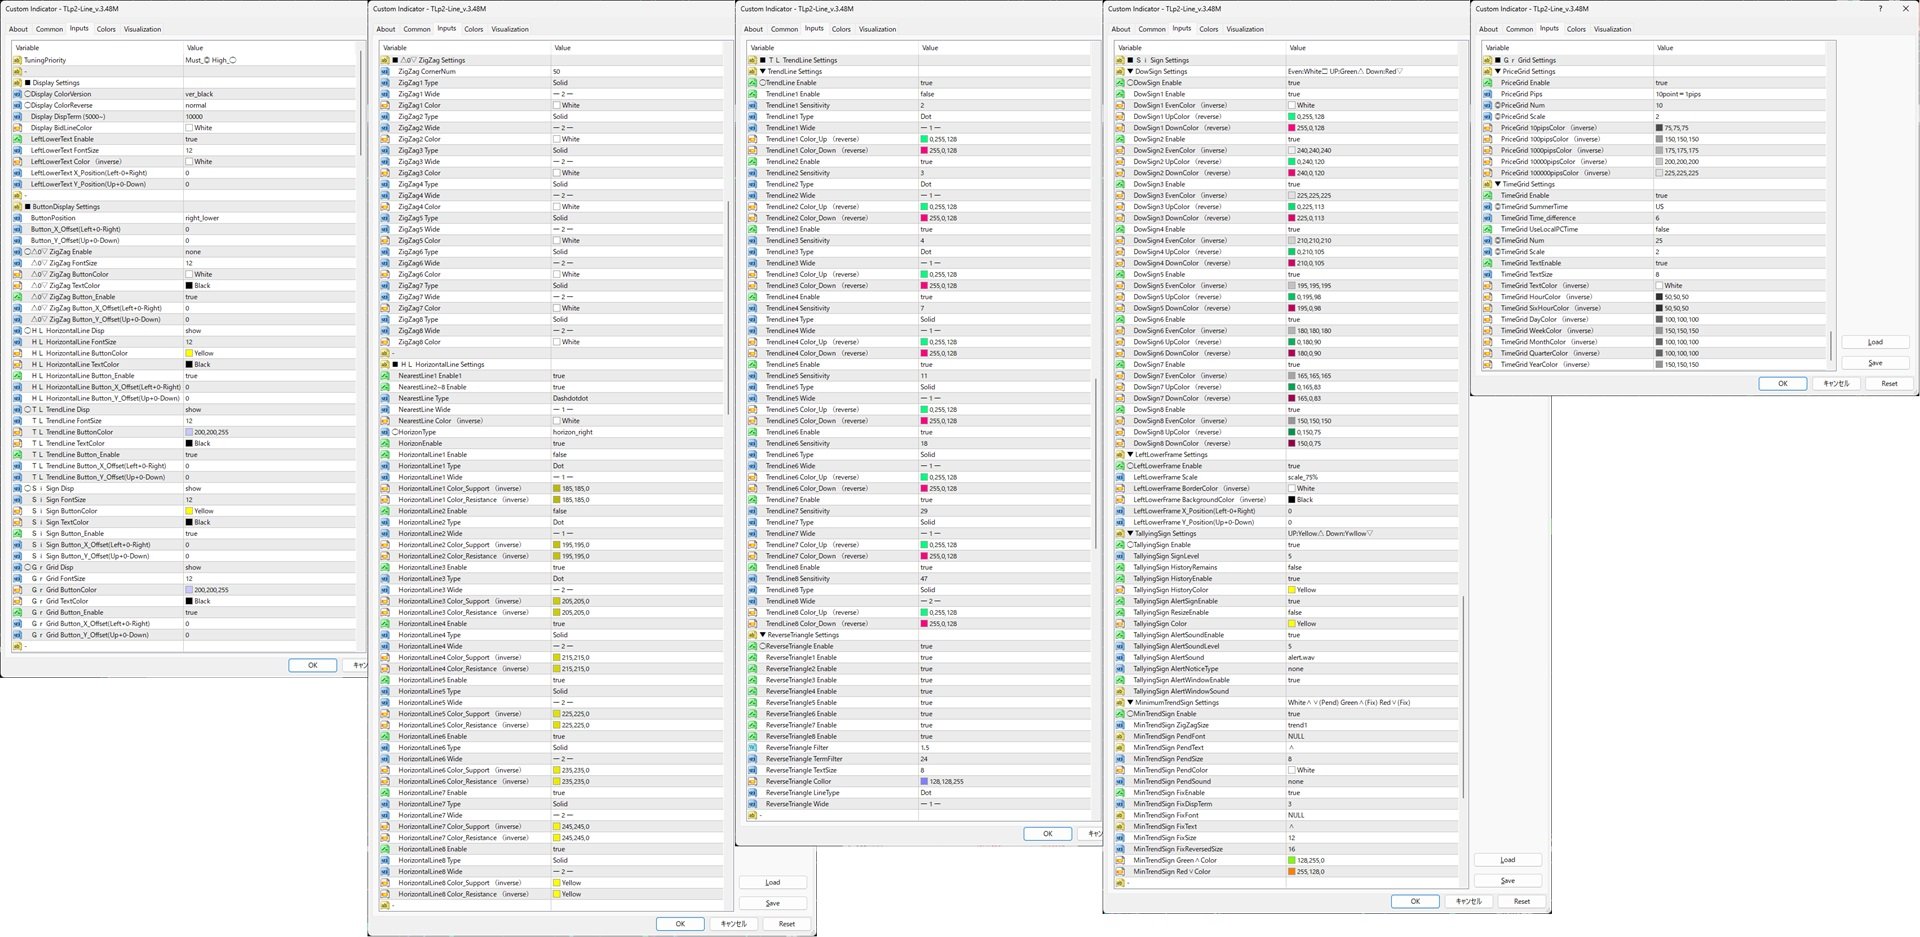

【Parameter】

以下では、パラメーターの説明をいたします。

ーーーーーーーーーーーーーーー

 TuningPriority → 各パラメーター左側にあるマーク ◎:変更必須 ○:変更優先

 -

 ■ Display Settings → 全体的な表示設定をする項目です。


 ◯Display ColorVersion → 背景が黒なら黒を、白なら白を選択してください。対象にはパラメーター名に(inverse)が付いている。

 ◯Display ColorReverse → 上げの緑と下げの赤を反転させたい場合は変更してください。 対象にはパラメーター名にreverse)が付いている。

  Display DispTerm (5000~) → 計算範囲を指定します。5000以上を推奨します。

  Display BidLineColor → ビッドラインの色を指定します。

  LeftLowerText Enable → チャート左下テキストの表示・非表示

  LeftLowerText FontSize → チャート左下テキストの文字サイズ

  LeftLowerText Color (inverse) → チャート左下テキストの表示

  LeftLowerText X_Position(Left-0+Right) → チャート左下テキストの横軸移動

  LeftLowerText Y_Position(Up+0-Down) → チャート左下テキストの縦軸移動

 -

 ■ ButtonDisplay Settings → チャート右下ボタンの設定


  ButtonPosition → チャート右下ボタンの位置を右上にできる

  Button_X_Offset(Left+0-Right) → チャート右下ボタンの横軸移動

  Button_Y_Offset(Up+0-Down) → チャート右下ボタンの縦軸移動

 ◯△0▽ ZigZag Enable → ジグザグの表示(1~8)・非表示(0)

  △0▽ ZigZag FontSize → チャート右下 △0▽ ボタンの文字サイズ

  △0▽ ZigZag ButtonColor → チャート右下 △0▽ ボタンの色

  △0▽ ZigZag TextColor → チャート右下 △0▽ ボタンの文字色

  △0▽ ZigZag Button_Enable → チャート右下 △0▽ ボタンの表示・非表示

  △0▽ ZigZag Button_X_Offset(Left+0-Right) → チャート右下 △0▽ ボタンの横軸移動

  △0▽ ZigZag Button_Y_Offset(Up+0-Down) → チャート右下 △0▽ ボタンの縦軸移動

 ◯HL HorizontalLine Disp → 水平線の表示・非表示

  HL HorizontalLine FontSize → チャート右下HLボタンの文字サイズ

  HL HorizontalLine ButtonColor → チャート右下HLボタンの色

  HL HorizontalLine TextColor → チャート右下HLボタンの文字色

  HL HorizontalLine Button_Enable → チャート右下HLボタンの表示・非表示

  HL HorizontalLine Button_X_Offset(Left+0-Right) → チャート右下HLボタンの横軸移動

  HL HorizontalLine Button_Y_Offset(Up+0-Down) → チャート右下HLボタンの縦軸移動

 ◯TL TrendLine Disp → トレンドラインの表示・非表示

  TL TrendLine FontSize → チャート右下TLボタンの文字サイズ

  TL TrendLine ButtonColor → チャート右下TLボタンの色

  TL TrendLine TextColor → チャート右下TLボタンの文字色

  TL TrendLine Button_Enable → チャート右下TLボタンの表示・非表示

  TL TrendLine Button_X_Offset(Left+0-Right) → チャート右下TLボタンの横軸移動

  TL TrendLine Button_Y_Offset(Up+0-Down) → チャート右下TLボタンの縦軸移動

 ◯Si Sign Disp → サインの表示・非表示

  Si Sign FontSize → チャート右下Siボタンの文字色

  Si Sign ButtonColor → チャート右下Siボタンの色

  Si Sign TextColor → チャート右下Siボタンの文字色

  Si Sign Button_Enable → チャート右下Siボタンの表示・非表示

  Si Sign Button_X_Offset(Left+0-Right) → チャート右下Siボタンの横軸移動

  Si Sign Button_Y_Offset(Up+0-Down) → チャート右下Siボタンの縦軸移動

 ◯Gr Grid Disp → グリッドの表示・非表示

  Gr Grid FontSize → チャート右下Grボタンの文字サイズ

  Gr Grid ButtonColor → チャート右下Grボタンの色

  Gr Grid TextColor → チャート右下Grボタンの文字色

  Gr Grid Button_Enable → チャート右下Grボタンの表示・非表示

  Gr Grid Button_X_Offset(Left+0-Right) → チャート右下Grボタンの横軸移動

  Gr Grid Button_Y_Offset(Up+0-Down) → チャート右下Grボタンの縦軸移動

 -

 ■ △0▽ ZigZag Settings → △0▽ ジグザグの設定


  ZigZag CornerNum → ジグザグの表示範囲(角の数)

  ZigZag1 Type → ジグザグ1のラインタイプ

  ZigZag1 Wide → ジグザグ1のライン太さ

  ZigZag1 Color → ジグザグ1のライン色

  ZigZag2 Type → ジグザグ2の…

  ZigZag2 Wide →

  ZigZag2 Color →

  ZigZag3 Type →

  ZigZag3 Wide →

  ZigZag3 Color →

  ZigZag4 Type →

  ZigZag4 Wide →

  ZigZag4 Color →

  ZigZag5 Type →

  ZigZag5 Wide →

  ZigZag5 Color →

  ZigZag6 Type →

  ZigZag6 Wide →

  ZigZag6 Color →

  ZigZag7 Type →

  ZigZag7 Wide →

  ZigZag7 Color →

  ZigZag8 Type →

  ZigZag8 Wide →

  ZigZag8 Color →

 -

 ■ HL HorizontalLine Settings → HL 水平線の設定


  NearestLine1 Enable1 → 未確定の直近高値・安値ライン1の表示・非表示

  NearestLine2~8 Enable → 未確定の直近高値・安値ライン2~8の表示・非表示

  NearestLine Type → 未確定の直近高値・安値ラインのタイプ

  NearestLine Wide → 未確定の直近高値・安値ラインの太さ

  NearestLine Color (inverse) → 未確定の直近高値・安値ラインの色

 ◯HorizonType → 水平線のタイプ(普通・レート付き・右側だけ)を選択できる

  HorizonEnable → 水平線の表示・非表示

  HorizontalLine1 Enable → 水平線1の表示・非表示

  HorizontalLine1 Type → 水平線1のタイプ

  HorizontalLine1 Wide → 水平線1の太さ

  HorizontalLine1 Color_Support (inverse) → 水平線1のサポートラインの色

  HorizontalLine1 Color_Resistance (inverse) → 水平線1のレジスタンスラインの色

  HorizontalLine2 Enable → 水平線2の…

  HorizontalLine2 Type →

  HorizontalLine2 Wide →

  HorizontalLine2 Color_Support (inverse) →

  HorizontalLine2 Color_Resistance (inverse) →

  HorizontalLine3 Enable →

  HorizontalLine3 Type →

  HorizontalLine3 Wide →

  HorizontalLine3 Color_Support (inverse) →

  HorizontalLine3 Color_Resistance (inverse) →

  HorizontalLine4 Enable →

  HorizontalLine4 Type →

  HorizontalLine4 Wide →

  HorizontalLine4 Color_Support (inverse) →

  HorizontalLine4 Color_Resistance (inverse) →

  HorizontalLine5 Enable →

  HorizontalLine5 Type →

  HorizontalLine5 Wide →

  HorizontalLine5 Color_Support (inverse) →

  HorizontalLine5 Color_Resistance (inverse) →

  HorizontalLine6 Enable →

  HorizontalLine6 Type →

  HorizontalLine6 Wide →

  HorizontalLine6 Color_Support (inverse) →

  HorizontalLine6 Color_Resistance (inverse) →

  HorizontalLine7 Enable →

  HorizontalLine7 Type →

  HorizontalLine7 Wide →

  HorizontalLine7 Color_Support (inverse) →

  HorizontalLine7 Color_Resistance (inverse) →

  HorizontalLine8 Enable →

  HorizontalLine8 Type →

  HorizontalLine8 Wide →

  HorizontalLine8 Color_Support (inverse) →

  HorizontalLine8 Color_Resistance (inverse) →

 -

 ■ TL TrendLine Settings → TL トレンドラインの設定


 ▼ TrendLine Settings → トレンドラインの設定


 ◯TrendLine Enable → トレンドラインの表示・非表示

  TrendLine1 Enable → トレンドライン1の表示・非表示

  TrendLine1 Sensitivity → トレンドライン1の描画感度(指定数以下のラインを間引く)

  TrendLine1 Type → トレンドライン1のラインタイプ

  TrendLine1 Wide → トレンドライン1のライン太さ

  TrendLine1 Color_Up (reverse) → トレンドライン1上昇の色

  TrendLine1 Color_Down (reverse) → トレンドライン1の下降の色

  TrendLine2 Enable → トレンドライン2の…

  TrendLine2 Sensitivity →

  TrendLine2 Type →

  TrendLine2 Wide →

  TrendLine2 Color_Up (reverse) →

  TrendLine2 Color_Down (reverse) →

  TrendLine3 Enable →

  TrendLine3 Sensitivity →

  TrendLine3 Type →

  TrendLine3 Wide →

  TrendLine3 Color_Up (reverse) →

  TrendLine3 Color_Down (reverse) →

  TrendLine4 Enable →

  TrendLine4 Sensitivity →

  TrendLine4 Type →

  TrendLine4 Wide →

  TrendLine4 Color_Up (reverse) →

  TrendLine4 Color_Down (reverse) →

  TrendLine5 Enable →

  TrendLine5 Sensitivity →

  TrendLine5 Type →

  TrendLine5 Wide →

  TrendLine5 Color_Up (reverse) →

  TrendLine5 Color_Down (reverse) →

  TrendLine6 Enable →

  TrendLine6 Sensitivity →

  TrendLine6 Type →

  TrendLine6 Wide →

  TrendLine6 Color_Up (reverse) →

  TrendLine6 Color_Down (reverse) →

  TrendLine7 Enable →

  TrendLine7 Sensitivity →

  TrendLine7 Type →

  TrendLine7 Wide →

  TrendLine7 Color_Up (reverse) →

  TrendLine7 Color_Down (reverse) →

  TrendLine8 Enable →

  TrendLine8 Sensitivity →

  TrendLine8 Type →

  TrendLine8 Wide →

  TrendLine8 Color_Up (reverse) →

  TrendLine8 Color_Down (reverse) →


 ▼ ReverseTriangle Settings → 逆三角(ブロードニングフォーメーション)の設定


 ◯ReverseTriangle Enable → 逆三角の表示・非表示

  ReverseTriangle1 Enable → 逆三角1の表示・非表示

  ReverseTriangle2 Enable → 逆三角2…

  ReverseTriangle3 Enable →

  ReverseTriangle4 Enable →

  ReverseTriangle5 Enable →

  ReverseTriangle6 Enable →

  ReverseTriangle7 Enable →

  ReverseTriangle8 Enable →

  ReverseTriangle Filter → 逆三角の角度倍率・上限

  ReverseTriangle TermFilter → 逆三角の描画本数・下限

  ReverseTriangle TextSize → 逆三角の文字サイズ

  ReverseTriangle Collor → 逆三角のライン色

  ReverseTriangle LineType → 逆三角のラインタイプ

  ReverseTriangle Wide → 逆三角のライン太さ

 -

 ■ Si Sign Settings → Si サインの設定


 ▼ DowSign Settings → ダウ理論サイン 白□緑△赤▽ の設定


 ◯DowSign Enable → ダウ理論サインの表示・非表示

  DowSign1 Enable → ダウ理論サイン1の表示・非表示

  DowSign1 EvenColor (inverse) → ダウ理論 白□ サイン1の色

  DowSign1 UpColor (reverse) → ダウ理論 緑△ サイン1の色

  DowSign1 DownColor (reverse) → ダウ理論 赤▽ サイン1の色

  DowSign2 Enable → ダウ理論 白□ サイン2の…

  DowSign2 EvenColor (inverse) →

  DowSign2 UpColor (reverse) →

  DowSign2 DownColor (reverse) →

  DowSign3 Enable →

  DowSign3 EvenColor (inverse) →

  DowSign3 UpColor (reverse) →

  DowSign3 DownColor (reverse) →

  DowSign4 Enable →

  DowSign4 EvenColor (inverse) →

  DowSign4 UpColor (reverse) →

  DowSign4 DownColor (reverse) →

  DowSign5 Enable →

  DowSign5 EvenColor (inverse) →

  DowSign5 UpColor (reverse) →

  DowSign5 DownColor (reverse) →

  DowSign6 Enable →

  DowSign6 EvenColor (inverse) →

  DowSign6 UpColor (reverse) →

  DowSign6 DownColor (reverse) →

  DowSign7 Enable →

  DowSign7 EvenColor (inverse) →

  DowSign7 UpColor (reverse) →

  DowSign7 DownColor (reverse) →

  DowSign8 Enable →

  DowSign8 EvenColor (inverse) →

  DowSign8 UpColor (reverse) →

  DowSign8 DownColor (reverse) →


 ▼ LeftLowerFrame Settings → チャート左下白枠の設定


 ◯LeftLowerFrame Enable → チャート左下白枠の表示・非表示

  LeftLowerFrame Scale → チャート左下白枠の表示倍率

  LeftLowerFrame BorderColor (inverse) → チャート左下白枠の枠色

  LeftLowerFrame BackgroundColor (inverse) → チャート左下白枠の背景色

  LeftLowerFrame X_Position(Left-0+Right) → チャート左下白枠の横軸移動

  LeftLowerFrame Y_Position(Up+0-Down) → チャート左下白枠の縦軸移動


 ▼ TallyingSign Settings → 黄△黄▽の設定


1~8の白□緑△赤▽の向きが揃うと反応する△黄▽

TallyingSign SignLevel=“5”(デフォルト値)の場合

▽▲▲▲▲▲ トレンド数 =5 5までのトレンド方向が▲で揃った状態

▲▲▲▲▲▲ トレンド数 =6 6までのトレンド方向が▲で揃った状態

▽▲▲▲▲▲▲▲ トレンド数 =7 7までのトレンド方向が▲で揃った状態

▲▲▲▲▲▲▲▲ トレンド数 =8 8つ全てのトレンド方向が▲で揃った状態

⑧⑦⑥⑤④③②① 大きい基準⑧~小さい基準①を表しています。

▼▼▼▼▼▼▼▼ トレンド数 =8 8つ全てのトレンド方向が▼で揃った状態

△▼▼▼▼▼▼▼ トレンド数 =7 7までのトレンド方向が▼で揃った状態

▼▼▼▼▼▼ トレンド数 =6 6までのトレンド方向が▼で揃った状態

△▼▼▼▼▼ トレンド数 =5 5までのトレンド方向が▼で揃った状態


 ◯TallyingSign Enable → △黄▽の表示・非表示

  TallyingSign SignLevel → △黄▽のトレンド数

  TallyingSign HistoryRemains → △黄▽反転後の過去履歴を残す・残さない

  TallyingSign HistoryEnable → 小さい△黄▽の表示・非表示( 白□緑△赤▽の向きが揃う度に表示される

  TallyingSign HistoryColor → 小さい△黄▽の色

  TallyingSign AlertSignEnable → 大きい△黄▽の表示・非表示

  TallyingSign ResizeEnable → 大きい△黄▽のトレンド数増大で追加表示

  TallyingSign Color → 大きい△黄▽の色

  TallyingSign AlertSoundEnable → 大きい△黄▽のアラート可否

  TallyingSign AlertSoundLevel → 大きい△黄▽のアラートを鳴らすトレンド数

  TallyingSign AlertSound → 大きい△黄▽のアラート音

  TallyingSign AlertNoticeType → 大きい△黄▽のアラートタイプ

  TallyingSign AlertWindowEnable → 大きい△黄▽のアラートウィンドウ

  TallyingSign AlertWindowSound → 設定不可 アラートウィンドウ表示時はMT4の音設定が優先される


 ▼ MinimumTrendSign Settings → 直近高値安値更新 白∧∨緑∧赤∨ の設定


白∧∨:指定された小さいトレンドの直近高値安値更新時に表示(未確定)

赤∨:指定された小さいトレンドの直近高値安値更新時に表示(確定)


 ◯MinTrendSign Enable → 白∧∨緑∧赤∨の表示・非表示

  MinTrendSign ZigZagSize → 白∧∨緑∧赤∨のトレンドサイズ

  MinTrendSign PendFont → 白∧∨のフォント

  MinTrendSign PendText → 白∧∨の表示記号

  MinTrendSign PendSize → 白∧∨のサイズ

  MinTrendSign PendColor → 白∧∨の色

  MinTrendSign PendSound → 白∧∨のアラート

  MinTrendSign FixEnable → ∧赤∨の表示・非表示

  MinTrendSign FixDispTerm → ∧赤∨の表示個数

  MinTrendSign FixFont → ∧赤∨のフォント

  MinTrendSign FixText → ∧赤∨の表示記号

  MinTrendSign FixSize → ∧赤∨のサイズ

  MinTrendSign FixReversedSize → ∧赤∨のサイズ・反転時

  MinTrendSign Green∧Color → ∧の色

  MinTrendSign Red∨Color → 赤∨の色

 -

 ■ Gr Grid Settings → Gr グリッドの設定


 ▼ PriceGrid Settings → 縦軸(価格)グリッドの設定


  PriceGrid Enable → 縦軸の表示・非表示

  PriceGrid Pips → 縦軸の倍率 MT4によって倍率が異なることに対応

 ◎PriceGrid Num → チャート縮小時の縦軸のグリッド本数上限

 ◎PriceGrid Scale → チャート縮小時の縦に並ぶチャート枚数(チャート拡大時のグリッド本数上限に影響する)

  PriceGrid 10pipsColor (inverse) → 10pips毎のグリッドの色

  PriceGrid 100pipsColor (inverse) → 100pips毎の…

  PriceGrid 1000pipsColor (inverse) →

  PriceGrid 10000pipsColor (inverse) →

  PriceGrid 100000pipsColor (inverse) →


 ▼ TimeGrid Settings → 横軸(時間)グリッドの設定


  TimeGrid Enable → 横軸の表示・非表示

 ◎TimeGrid SummerTime → 横軸サーバー時間の基準(XM以外は米国式)

  TimeGrid Time_difference → 横軸時差調整

  TimeGrid UseLocalPCTime → PC時間を使う

 ◎TimeGrid Num → チャート縮小時の横軸のグリッド本数上限

 ◎TimeGrid Scale → チャート縮小時の縦に並ぶチャート枚数(チャート拡大時のグリッド本数上限に影響する)

  TimeGrid TextEnable → 横軸の日時テキスト表示・非表示

  TimeGrid TextSize → 横軸の日時テキストサイズ

  TimeGrid TextColor (inverse) → 横軸の日時テキスト色

  TimeGrid HourColor (inverse) → 1時間毎のグリッドの色

  TimeGrid SixHourColor (inverse) →6時間毎の…

  TimeGrid DayColor (inverse) →

  TimeGrid WeekColor (inverse) →

  TimeGrid MonthColor (inverse) →

  TimeGrid QuarterColor (inverse) →

  TimeGrid YearColor (inverse) →

ーーーーーーーーーーーーーーー

おすすめのプロダクト
VR Cub
Vladimir Pastushak
VR Cub は、質の高いエントリーポイントを獲得するためのインジケーターです。このインジケーターは、数学的計算を容易にし、ポジションへのエントリーポイントの検索を簡素化するために開発されました。このインジケーターが作成されたトレーディング戦略は、長年にわたってその有効性が証明されてきました。取引戦略のシンプルさはその大きな利点であり、初心者のトレーダーでもうまく取引することができます。 VR Cub はポジション開始ポイントとテイクプロフィットとストップロスのターゲットレベルを計算し、効率と使いやすさを大幅に向上させます。取引の簡単なルールを理解するには、以下の戦略を使用した取引のスクリーンショットを見てください。 設定、設定ファイル、デモ版、説明書、問題解決方法は、以下から入手できます。 [ブログ] レビューを読んだり書いたりすることができます。 [リンク] のバージョン [MetaTrader 5] エントリーポイントの計算ルール ポジションをオープンする エントリーポイントを計算するには、VR Cub ツールを最後の高値から最後の安値までストレッチする必要があります。
Strong Retracement Points Pro edition! SRP (Strong Retracement/Reversal Points) is a powerful and unique support and resistance indicator. It displays the closest important levels which we expect the price retracement/reversal! If all level are broken from one side, it recalculates and draws new support and resistance levels, so the levels might be valid for several days depending on the market! If you are still hesitating to start using this wonderful tool, you can check this link to see how ef
PABT Pattern Indicator - it's classical system one of the signal patterns. Indicator logic - the Hi & Lo of the bar is fully within the range of the preceding bar, look to trade them as pullback in trend. In the way if indicator found PABT pattern it's drawing two lines and arrow what showing trend way.  - First line - it's entry point and drawing at: 1. On the high of signal bar or on middle of the signal bar (depending from indicator mode) for buy; 2. On the low of signal bar or on middle of t
Market Structure Zig Zag
Lesedi Oliver Seilane
4.77 (22)
Free Market structure zig zag to assist in price action trading the screenshots describe how to use and how to spot patterns new version comes with alerts, email alert and  push notification alert can be used on all pairs  can be used on all timeframes  you can add additional confirmation indicators the indicator shows you your higher high and low highs as well as your lower lows and lower highs  the indication makes price action analysis easier to spot.
FREE
Black series MT4 - The indicator is designed for trading on binary options with Timeframe M1-M5-M15 Multicurrency (Works on cryptocurrency and currency pairs) The signal appears when the candle opens Up to 90% correct signals There is no signal redrawing at all Can be used with other indicators. Good for scalping! In Settings there is: -Indicator working methods -I Allert Arrow color Red signal down Blue signal up Also watch the video how the indicator works and signals
Next level of trend trading here. Possibility 75%, the indicator analyzes the current market to determine short (small dot), middle (circle with a dot inside) and long (cross with a circle and a dot inside) trends.  Wingdings characters of  Aqua color represents the beginning of the UP trend. Wingdings characters of  Orange color represents the beginning of the DOWN trend. Possibility 75% Indicator will improve your trading in the world of forex, commodities, cryptocurrencies and indices.
Fourteen plus nine What is it for? Applying Tom DeMark’s TD Sequential serves the purpose of identifying a price point where an uptrend or a downtrend exhausts itself and reverses. . What are the main components of TD Sequential? TD Sequential has two parts – TD Setup and TD Countdown. The first phase of TD Sequential starts with a TD Setup and is completed with a 9 count. When the 9 count is completed, it is at that point, a price pause, price pullback, or reversal is likely. It is also at tha
Noize Absorption Index - is the manual trading system that measures the difference of pressure between bears forces and bulls forces. Green line - is a noize free index that showing curent situation. Zero value of index shows totally choppy/flat market.Values above zero level shows how powerfull bullish wave is and values below zero measures bearish forces.Up arrow appears on bearish market when it's ready to reverse, dn arrow appears on weak bullish market, as a result of reverse expectation. S
Owl smart levels
Sergey Ermolov
4.13 (23)
MT5版  |   FAQ Owl Smart Levels Indicator   は、 Bill Williams   の高度なフラクタル、市場の正しい波構造を構築する Valable ZigZag、エントリの正確なレベルをマークする Fibonacci レベルなどの一般的な市場分析ツールを含む 1 つのインジケーター内の完全な取引システムです。 利益を得るために市場と場所に。 戦略の詳細な説明 インジケータを操作するための指示 顧問-取引助手 プライベートユーザーチャット ->購入後に私に書いて、私はプライベートチャットにあなたを追加し、あなたはそこにすべてのボーナスをダウンロードすることができます 力はシンプルさにあります! Owl Smart Levels   取引システムは非常に使いやすいので、専門家にも、市場を勉強し始めて自分で取引戦略を選択し始めたばかりの人にも適しています。 戦略と指標に秘密の数式や計算方法が隠されているわけではなく、すべての戦略指標は公開されています。 Owl Smart Levels を使用すると、取引を開始するためのシグナルをすばやく確認し、
Forex Gump
Andrey Kozak
2.75 (4)
Forex Gump is a fully finished semi-automatic trading system. In the form of arrows, signals are displayed on the screen for opening and closing deals. All you need is to follow the instructions of the indicator. When the indicator shows a blue arrow, you need to open a buy order. When the indicator shows a red arrow, you need to open a sell order. Close orders when the indicator draws a yellow cross. In order to get the most effective result, we recommend using the timeframes H1, H4, D1. There
This is a trend indicator without redrawing Developed instead of the binary options strategy (by the color of the Martingale candlestick) Also works well in forex trading When to open trades (binary options) A signal will appear in the place with a candle signaling the current candle It is recommended to open a deal for one candle of the current timeframe M1 and M5 When a blue dot appears, open a deal up When a red dot appears, open a trade down. How to open trades on Forex. When a signal is rec
"The trend is your friend" is one of the best known sayings in investing, because capturing large trendy price movements can be extremely profitable. However, trading with the trend is often easier said than done, because many indicators are based on price reversals not trends. These aren't very effective at identifying trendy periods, or predicting whether trends will continue. We developed the Trendiness Index to help address this problem by indicating the strength and direction of price trend
GMMA Trade X is an EA based on GMMA. GMMA parameters such as MovingAveragePeriod1-24, MovingAverageMAShift1-24, MovingAverageShift1-24 and CandlestickShift1-24 can be adjusted. GMMA Trade X applies BTN TECHNOLOGY's state-of-the-art intelligent technology to help you create optimal results for your trades. May your dreams come true through GMMA Trade X. Good luck. = == == Inquiries = == == E-Mail:support@btntechfx.com
This indicator displays Stochastic osc signals on the price chart and allows the user to receive notifications of such signals. The Stochastic indicator is a classic and proven indicator of the technical analysis of the markets. Despite its age, it is still relevant today. Depending on the settings, the indicator allows you to work effectively on various TFs and any markets. Signals are given on fully formed bars and are not redrawn. Custom Parameters: Stochastic_Price (0-1) - The applied pric
FREE
Chart Patterns Detect 15 patterns (Ascending Triangle, Descending Triangle, Rising Wedge, Falling Wedge, Bullish Flag, Bearish Flag, Bullish Rectangle, Bearish Rectangle Symmetrical triangle, Head and Shoulders, Inverted Head and Shoulders, Triple top, Triple Bottom, Double Top, Double Bottom) Use historical data to calculate the probability of each pattern to succeed (possibility to filter notification according to the chance of success) gives graphic indication about the invalidation level and
Fibonacci indicator based on fractal.This software can automatically draw the golden section proportional line of two trend lines, and mark all the recent high and low prices.And the percentage value of volatility is a multi-cycle, multi-currency oscillation indicator.It is very effective for traders to find support and resistance lines and find entry and exit points near them.
The Stepping Trend Indicator     The Steppi ng Trend indicator uses the  average true range  (ATR indicator) in its calculation. This gives you control to set your own average true range period, I set the Default as 10.   Indicator Details. Green Arrow Up: This means you are at the starting point of a new bullish trend, it’s time to buy.   Red  Arrow  Down : This means you are at the starting point of a new  bearish  trend, it’ s time to sell .   What if you miss the Arrow Signal?   No
For sure, this indicator has become very popular amongst traders. Through coding this indicator will give you the most accurate levels possible for your trading analysis. We have also added in the ability for you to receive alerts when the price breaks above or below a Support or Resistance lines! HOW TO USE The red rectangles represent your resistance/supply zone. The green rectangles represent your support/demand zone.  BONUS FEATURES We coded this indicator with the ability to switch between
Insider Scalper Binary This tool is designed to trade binary options. for short temporary spends. to make a deal is worth the moment of receiving the signal and only 1 candle if it is m1 then only for a minute and so in accordance with the timeframe. for better results, you need to select well-volatile charts.... recommended currency pairs eur | usd, usd | jpy .... the indicator is already configured, you just have to add it to the chart and trade .... The indicator signals the next can
Advance Currency Meter is a currency meter that detects strong market trends. This indicator is good for scalping, intraday trading and swing trading. The indicator will detect short term to long term market trends. This will give you good insight which currencies are best to trade as of the moment. Note : Kindly contact me before you make any purchases. Works well with my MACD Currency Strength Meter
トレンドキャッチャー: アラートインジケーター付きのトレンドキャッチャーストラテジーは、市場トレンドやポテンシャルなエントリーポイントやエグジットポイントを特定するのに役立つ多目的な技術分析ツールです。動的なトレンドキャッチャーストラテジーを備えており、市場状況に適応してトレンドの方向を明確に視覚化します。トレーダーは、自身の好みやリスク許容度に合わせてパラメーターをカスタマイズできます。このインジケーターはトレンドの識別を支援し、ポテンシャルなリバーサルをシグナルし、トレイリングストップのメカニズムとして機能し、市場への迅速な対応のためのリアルタイムアラートを提供します。 特徴: - トレンドの識別:上昇トレンドと下降トレンドをシグナルします。 - トレンドのリバーサル:ローソク足の色が上昇から下降に変わった場合やその逆の場合に、ポテンシャルなリバーサルを警告します。 - リアルタイムアラート:新しいトレンドの識別に対するアラートを生成します。 推奨事項: - 通貨ペア:EURUSD、AUDUSD、XAUUSDなど... - タイムフレーム:H1。 - アカウン
FREE
Shark Deal Book
Philip Pankaj Suthagar
4 (3)
Term  "shark"  in the business world denotes a high volume investor who just made a good investment in a highly Potential business deal.So, sharks are the ones who make the market move. In our case, if an American shark bought a Japanese company, he/she has to convert American dollars into Japanese yen to make the deal. So, the demand for the Japanese yen will increase sharply. Thus USD/JPY will go short rapidly if the deal was from the shark. Another example, In the case of forex, if fed increa
The Riko Trend indicator is a revolutionary trend trading and filtering solution with all the important features of a trend tool built into one tool! The Riko Trend indicator is good for any trader, suitable for any trader for both forex and binary options. You don’t need to configure anything, everything is perfected by time and experience, it works great during a flat and in a trend. The Riko Trend indicator is a technical analysis tool for financial markets that reflects the current price
これは、キャンドルの終値を予測する指標です。 このインジケータは、主にD1チャートでの使用を目的としていますが. この指標は、従来の外国為替取引とバイナリオプション取引の両方に適しています。 インジケーターは、スタンドアロンのトレーディングシステムとして使用することも、既存のトレーディングシステムへの追加として機能させることもできます。 このインジケーターは、現在のキャンドルを分析し、キャンドル自体の内部の特定の強度係数と、前のキャンドルのパラメーターを計算します。 したがって、この指標は、市場の動きのさらなる方向性と現在のキャンドルの終値を予測します。 この方法のおかげで、この指標は、短期の日中取引だけでなく、中期および長期の取引にも適しています。 インジケーターを使用すると、市場の状況の分析中にインジケーターが生成する潜在的な信号の数を設定できます。 インジケーターの設定には、このための特別なパラメーターがあります。 また、インジケーターは、チャート上のメッセージの形式で、電子メールで、およびPUSH通知の形式で、新しい信号について通知することができます。 購入後は必ず私に書いて
The Chaikin Oscillator is a technical indicator developed by Marc Chaikin that combines price and volume data to measure the accumulation and distribution of a financial instrument. It aims to identify potential buying and selling opportunities in the market. The Chaikin Oscillator is calculated by subtracting a 10-day exponential moving average of the Accumulation Distribution Line (ADL) from a 3-day exponential moving average of the ADL. Here's how to use the Chaikin Oscillator indicator in tr
IconTradeSL.  Возможность выставлять sl по уровням. В индикаторе установлена возможность показывать историю уровней на графике. Возможность выставлять sl по уровням. Настройки индикатора: ЦВЕТ_BAR - цвет баров по которым ищем SL ЦВЕТ_Тек_BAR - Purple;//цвет текущего бара BAR - поиск в последних BAR барах (по умолчанию 200) show_bar - показывать бары по которым ищем SL
Introduction It is common practice for professional trades to hide their stop loss / take profit from their brokers. Either from keeping their strategy to the themselves or from the fear that their broker works against them. Using this indicator, the stop loss / take profit points will be drawn on the product chart using the bid price. So, you can see exactly when the price is hit and close it manually.  Usage Once attached to the chart, the indicator scans the open orders to attach lines fo
Indicator for binary options arrow is easy to use and does not require configuration works on all currency pairs, cryptocurrencies buy signal blue up arrow sell signal red down arrow tips do not trade during news and 15-30 minutes before their release, as the market is too volatile and there is a lot of noise it is worth entering trades one or two candles from the current period (recommended for 1 candle) timeframe up to m 15 recommended money management fixed lot or fixed percentage of the depo
5 signal in 1  Product     TimeFrame   Recommend   1m-5m recommend  signal   TF  5m    Banks Pro Binary Option is Indicator for binary option Can Use Manaul Trade or Robot on Platform  Mt2Trading  https://www.mt2trading.com/?ref=104    Time Trading   good work  EU session    Recommend  Curency   EUR  GBP USD        careful   AUD JPY      Recommend  Martingale 2-5 Step   Recommend  set profit  2%-5%/Day Setting Brake  News Event High volatility   recommend  15-30 min Have Problem Contract
Diamond PRO
Fanur Galamov
4.84 (19)
Diamond PRO is enhanced powerful version of Diamond for advanced traders. Pro version includes optimized cores, new impoved entry points filters, new multistage profit closure algorithm and сontains number of external control parameter that allows build and fine tune own tradind decisions and algorithms. The system provides more accurate market entries, analyzes and filters upcoming economic news, contains spread protection and an advanced position management algorithm. Main goal of Diamond PRO
このプロダクトを購入した人は以下も購入しています
製品を購入する前に、以下の情報をお読みください。 Apollo Pips PLUS SP はユニークな製品です。これは、私の新しい「アポロ ピップス」インジケーターと、私のすべての取引インジケーターにアクセスできる「スーパー パック」ボーナスを手に入れたい人のためのものです。 Apollo Pips PLUS SP 製品を購入すると、実際には私の Apollo Pips インジケーターのまったく新しいバージョンを購入することになります。このバージョンのインジケーターには改良されたアルゴリズムと使いやすいパラメーターがあり、あらゆる市場およびあらゆる取引スタイルでインジケーターを使用する機会が得られます。 この製品の購入者は、私のスーパーボーナスとして、他のすべてのインジケーターにも無料でアクセスできます!私のすべての取引ツールにアクセスしたい場合は、この製品が最適です!:) しかし、これがすべてではありません!:) この製品のすべての購入者は、私の新しいインジケーターを無料で入手する資格もあります!:)新しい取引インジケーターを利用できるようになりました。私の特権のある「スーパー パッ
Connect Indicator is a tool used for connecting indicators between the MQL market and MT4. The connected indicators are made by our group and can be used for other applications, such as sending messages to the Line application or Telegram application. If you have any questions, please don't hesitate to ask us to receive support. Function and indicator buffer Buffer one is the high price of the previous candle. Buffer two is the high price of the previous candle. Usage To connect indicators to fu
Enigmera
Ivan Stefanov
5 (2)
エニグメラ:市場の中核 https://www.enigmera.com はじめに このインディケータと取引システムは、金融市場に対する驚くべきアプローチです。ENIGMERAは、フラクタルサイクルを使用して、サポートとレジスタンスレベルを正確に計算します。本格的な蓄積局面を示し、方向性と目標を示します。 トレンド中でも調整中でも機能するシステムです。 どのように作動するのか? ENIGMERAは、支持線・抵抗線、目標線、乖離線の3つのラインで構成されています。このシステムは、過去のデータを現在と未来に外挿する典型的な市場指標とは異なり、現在の完全な画像を提供します。支持線上にある場合、それは本当の支持を意味し、抵抗線上にある場合、それは本当の抵抗を意味する。ある水準が破られた場合、それはトレンドの変化を意味する。再描画はしない。 市場は常に進化しているため、ENIGMERAはその評価ツールを適応させ、定期的に戦略を修正しています。  これにより、すべてのシナリオが徹底的に評価されることが保証されます。この市場指標の独自性は、その能力を見れば明らかです。  ENIGM
Indicator : RealValueIndicator Description : RealValueIndicator is a powerful tool designed specifically for trading on the EURUSD pair. This indicator analyzes all EUR and USD pairs, calculates their real currency strength values, and displays them as a single realistic value to give you a head start on price. This indicator will tell you moves before they happen if you use it right. RealValueIndicator allows you to get a quick and accurate overview of the EURUSD currency pair tops and bottoms,
The indicator is designed to work on any trading platform. The program is based on proprietary algorithms and W.D.Ganna's mathematics, allowing you to calculate target levels of price movement based on three points with the highest degree of certainty. It is a great tool for stock trading. The indicator has three buttons: NEW - call up a triangle for calculation. DEL - delete the selected triangle. DELS - completely remove all constructions. The probability of achieving the goals is more than 80
TrendMaestro
Stefano Frisetti
5 (3)
note: this indicator is for METATRADER4, if you want the version for METATRADER5 this is the link:  https://www.mql5.com/it/market/product/108106 TRENDMAESTRO ver 2.4 TRENDMAESTRO recognizes a new TREND in the bud, he never makes mistakes. The certainty of identifying a new TREND is priceless. DESCRIPTION TRENDMAESTRO identifies a new TREND in the bud, this indicator examines the volatility, volumes and momentum to identify the moment in which there is an explosion of one or more of these data a
Max Payneは、矢印の形でシグナルを与える反転/トレンドシグナルインジケーターです。このインジケーターは、同じバーの終値でシグナルを出します。このインジケーターは、異なる期間でチャート上に複数回ドロップして、シグナルの2倍/3倍の確認を取得できます。 このインジケーターは、あらゆる取引スタイルに合わせて高度に調整できますが、再描画やバックペイントは一切行われません。購入後には、使用したテンプレートとともにスクリーンショットに表示される完全なシステムが表示されます。 ----------------- 取引方法: トレンドフィルター(購入後に得られるペイントレンド)が方向に一致している間、同じバーでトリプル確認が得られるまで待ちます 取引を開始し、買い取引の場合は金色の矢印 (テンプレート) より下、売り取引の場合は金色の矢印 (テンプレート) より上にストップロスを設定します。終了シグナルは最初の反対側の白い点のシグナル (テンプレート) です。 ----------------- パラメーター : 信号周期:矢印周期 フィルター: 信号フィルター 距離 : ローソクからの矢印
JULY OFFER 80% OFF next price for unlimited version will be 17000$. This is the only time you can get this institutional and professional indicator at this price for unlimited version. Don't dare to miss this. The tool I am about to introduce to you you can't compare it with other tools due to its strategy and accuracy level in predicting the next price directional movement . This tool is designed for serious traders who have decided to make a difference through trading. Be the next person to wi
Dear Traders this is my another tool called " Swing Master Indicator ". As the name above the indicator is designed to help you in swing trading by capturing the low and highs of the price. You may us this tool with any trading strategy and style from scalping to position trading. It is made for level of traders including newbies and advanced traders even prop-firms, hedge funds and banks to help them make sold market analysis. I create tools for serious traders who want to make a difference in
The indicator " ZigZag on Trend " is an assistant in determining the direction of price movement, as well as a calculator of bars and points. It consists of a trend indicator, which follows the price direction by the trend line presented in the form of a zigzag and a counter calculating the number of bars traversed in the direction of the trend and the number of points on the vertical scale. (calculations are carried out by the opening of the bar) The indicator does not redraw. For convenience,
Bomb Bank シグナル: MetaTrader 4 の信頼度インジケーター Bomb Bank Signal は、金融市場で最も関連性の高いトレンドを特定するように設計された MetaTrader 4 の強力なインジケーターです。動きを正確に予測するツールをお探しなら、Bomb Bank が最適です。 仕組み: このインジケーターは、出来高分析、ローソク足終値、対称トレンドという 3 つの異なる方法を組み合わせて、売買の機会を検出してシグナルを送ります。 Bomb Bank は、買いの機会を特定するときは「爆弾」のようなものであり、売りシグナルを検出するときは「ドクロ」のようなものです。 ボムバンクはなぜ違うのですか? 完全な信頼性: Bomb Bank Signal は信号を削除しません。一度シグナルが発せられると、シグナルは残り続けるので、チャンスを逃すことはありません。 極めて高い精度: Bomb Bank は誤った信号を送信しません。リアルタイムで最新情報を更新し、市場の進化に合わせて調整しながら、以前のシグナルの透明性を維持します。 ライブアップデ
Contact us to receive a comprehensive user guide after purchasing. William Delbert Gann, commonly known as W.D. Gann, was an exceptional market analyst renowned for his unique trading style in the early 20th century.  His trading techniques were based on a blend of mathematics, geometry, astrology, and ancient mathematics. Gann believed that stock market movements followed specific patterns and cycles, rather than being random. His methodologies, celebrated for their accuracy and relevance, con
NOTE: PRICE WILL RISE VERY SOON. DON'T SKIP THIS OFFER! Dear traders I am glad to introduce the " Market Swing Scanner Board" indicator to you. This indicator was made mainly to be used in combination with the Market Swing Index Indicator. You use the  "Market Swing Scanner Board"  indicator to scan for trading opportunities on the  Market Swing Index Indicator . This tool is designed for serious traders who have decided to make a difference through trading. Be the next person to witness this st
This indicator is based on the mathematics of the great trader W.D. Ganna. With its help, you can easily find strong levels by analyzing swings to find the optimal entry point. The indicator works on all instruments and all timeframes. The indicator is fully manual and has control buttons. All you need to do is press the NEW button, a segment will appear, which you can place on any movement, swing or even 1 candle that you want to analyze. By placing the segment, press the OK button. A grid (th
The indicator of a Professional Trader is an arrow indicator for predicting the direction of price movement. I have been working on this indicator since 2014. You can use this indicator as your main indicator, use its entry signals, and use it as your only indicator to find entry points. About the product: Recommended TF [H4-D1-W1]   . The indicator predicts the direction of the next candle. Fits a variety of tools; Flexibility in settings for different instruments and intervals through the
TRANSACTION SPEEDは、大口注文がいつどこで市場に集積され、その恩恵を受けているかを示す最高品質の指標です。トレンドの変化を非常に早い段階で検知します。インジケーターであると同時にトレーディングシステムでもあります。そのコンセプトはユニークで、驚くほど収益性が高い。 FXでは、ティックボリュームはボリュームと呼ばれ、誤解を招きやすい。実際は、単位時間当たりの価格変動であり、事実上、取引速度(TRANSACTION SPEED)です。 このインジケーターは、FXにおける出来高の概念を完全に見直し、正しい方法で論理的に定義し、このロジックを適用することで、ユニークで正確なトップレベルの収益ツールになります。 スピードが上がれば、それはより大きな関心とそれに対応するエントリーとエグジットのサインです。 使い方は? このインジケーターは、市場の取引スピードを測定・比較するため、まず最初に行うべきことは以下の通りです。 比較を行う期間を選択することです。 通常、15日前が比較の出発点となります。 インジケータに日付を入力して実行する。 30分または1時間のタイムフレー
Cyclical indicator for trading and predicting the direction of the market. Shows the cyclical behavior of the price in the form of an oscillator. Gives signals for opening deals when rebounding from the upper and lower boundaries of the oscillator. In the form of a histogram, it shows the smoothed strength of the trend. Will complement any trading strategy, from scalping to intraday. The indicator does not redraw. Suitable for use on all symbols/instruments. Suitable time frames for short-term
Full Forex Market View Dashboard
Opengates Success International
5 (2)
FULL FOREX MARKET VIEWダッシュボードインジケーター これは、トレーダーが市場で何が起こっているかを完全に把握できるようにするために作成されたカスタム指標です。 リアルタイム データを使用して市場にアクセスし、取引を成功させるために必要なあらゆる情報を表示します。 インストール: このインジケーターをウィンドウ チャートに添付する前に、MT4 のマーケット ウォッチ パネルに移動し、不要な通貨ペアまたは取引しないすべての通貨ペアを非表示にして、残りをそこに残します。 その理由は、FFMV ダッシュボードが MT4 の気配値表示に表示されるすべての通貨ペアを表示するためです。 最大 30 通貨ペア以下を表示できます。 MT4 の気配値表示でそれ以上だと、FFMV ダッシュボードのフォントと画像がぼやけて変形します。 正しく表示されません。 使用法:      個人取引の場合      バスケット取引の場合 (方法についてはスクリーンショットを参照してください)      複数注文取引にも使用可能      独自の取引システムなどから
Gann Signal is a very simple indicator at first glance, but hidden inside is many years of experience in studying W.D.Ganna methods. The indicator gives accurate BUY/SELL signals, without redrawing. The indicator is very easy to use. All you need to do is attach it to your chart and follow its recommendations. The indicator constantly analyzes the market for entry opportunities. When such an opportunity appears, the indicator gives a signal in the form of an arrow. I repeat, all signals are NOT
The Nihilist 5.0 Indicator includes Forexalien and Nihilist Easy Trend trading strategies and systems. It is composed of an MTF Dashboard where you can analyze the different input possibilities of each strategy at a glance. It has an alert system with different types of configurable filters. You can also configure which TF you want to be notified on your Metatrader 4 platform and Mobile application The indicator has the option to view how could be a TP and SL by using ATR or fixed points, even
Moving pivot Average Fibonacci The  indicator compares the selected period with its counterpart from the previous period. The indicator determines the moving Fibonacci levels for the day or any time interval to assess the price movement range from the time average. The indicator helps predict the expected high or low for the day based on historical time data. The pivot line can be considered an average trend line and use it in a variety of trading strategies. If you have any question about t
User feedback : "This indicator is collection of important dynamic support and resistance giving a trader crystal clear idea , where to sell and where to buy. it completely complements trend lines, support, resistance, and sideways market and allow a trader to make sustainable profits. The thickness of lines suggests its strengths, the thicker the dynamic line, the stronger is rejection or pullback allowing a trader to make multi-fold profit, as they can clearly see them." Introducing Your Ult
Dear Onis, This Indicator is used for   GBPUSD, US30 and GOLD on 1-Min Chart . For US30 , Depending on your broker, Minimum Lot Size will differ from 0.01 to 1.0 lots. My Current Account is trading at 1.0 lots at $1 per point . Please check with your Broker what's the Margin Required for your Minimum lot sizes before you trade on your Real account. I have Forward Tested the indicator for around 6 months before releasing it to the public. ( No Demo is available for the Indicator, Strategy
Currently Price 20% OFF ( for unlimited use )   BONUS  AUX VIP Club 2024 : Include  EA Airbag  and  Load Data History  to enhance the performance of this tool to its maximum potential  Click Here to Download Files   ( for users only )   Hello World! Introducing.. SMCpro VIP tool and Indicator for MetaTrader 4, designed to revolutionize your trading experience with the ICT Smart Money Concept. This system is meticulously crafted to empower traders with advanced insights and precision in
フルSTOインジケータ(3つのSTOインジケータのすべてのバージョンを含む:プレミアム、ゴールド、シルバー) - STABLE TRADE OPTIONは、自動バイナリーオプション取引のために設計されています。 注意深くお読みください! 重要 1つのターミナルで、異なる有効期限を持つ2つのテンプレートを作成します。18:01、18:02のテンプレートは有効期限が1~15分、22:00のテンプレートは有効期限が10~20分です。 勝率:過去5年間で71 資金管理: 預金から0.3 このバージョンのインジケータは、モスクワ時間18:01、18:02、22:00の取引にのみ設定され、有効期限は銀と金が1~15分、プレミアムバージョンは10~20分です。シグナルはローソク足の内側に表示され、すぐに取引を開始します。 インジケータは完全に設定されているので、自分で何かを変更する必要はありません。インストールして取引してください! 実際の口座でstoの全バージョンをチェックし、結果を確認するのに2年以上かかりました。長年のテストの結果、最適なパラメータが選択さ
This indicator uses support and resistance, volume and some special formula to calculate the volume to filter the candles. If the volume reaches a specific value, And at the same time, Candle breaks the support/resistance line, There would be a signal and we can enter the market. Signals appear when the current candle closes. then you can enter the trade when a new candle appears. Please don't forget to follow your money management plan. MT5 Version Support/Resistance Breakout MT5 :   https:
WARNING: PRICE IS SUBJECT TO RISE AT ANY TIME. GET YOUR COPY TODAY TO AVOID MORE COST! Dear Traders I am so glad to introduce to you my other tool called the Forex Sniper Entries Indicator. This tool is designed to help serious traders and investors capture big moves in the currency price movements. The philosophy behind this tool is all about winning big and riding the price movement from its beginning until the maximum point. We want to capture those big moves in both down and up markets as mu
️️ Attention:   There is a new update at 22-08-2024. What's new in this update? -* New strategy integration. -* The trade is with the price trend only. -* The success rate of trades has increased by a very large percentage.      No more losses with this indicator, test it for years ago and see if there is losses in one day results. but before testing it please see the explaining video down here.    FxBears Powers is working on all forex pairs, metals, commodities, futures, indices, energies,
WARNING!! THIS SWORD IS TOO SHARP!    ONLY 10 COPIES LEFT FOR THE NEXT PRICE TO BE 8,000$ FOR UNLIMITED PLAN. Dear traders I am very glad once again to introduce to you my other tool called "Forex Sword Indicator". In short this tool is meant to give you an edge over the market that you have been waiting for  so long. Now, here it is. It is a very very simple tool but yet a dangerous sword. I call it a  Holy grail indicator!. I will not talk a lot about this tool. Just let the tool speak by itse
Limitless MT4は、すべての初心者と経験豊富なトレーダーに適したユニバーサルインジケーターです。 すべての通貨ペア、暗号通貨、生の株式で動作します 無制限のMT4-構成済みで、追加の構成は不要 そして今、主なもの なぜ無制限のMT4なのか? 1再描画の完全な欠如 2トレーディングの最高のスペシャリストによる2年間のテスト 3正しい信号の精度が80%を超える 4ニュースリリース中の取引で好調 取引ルール 1買いシグナル-青い上向き矢印の出現 下向きの赤い矢印の外観を販売するシグナル シグナル後の次のローソク足で取引を開始するには2 3テイクプロフィット チャート上 М1-40ピップ М5-50ピップ М15-55-60ピップ 4ストップロスは利益をとる 5誤った信号をフィルタリングするために、 パラボリックSAR-トレンドとのトレードへの参入を除外する移動平均または同様のトレンドインジケーター。 
フィルタ:
レビューなし
レビューに返信