• Genel bakış
  • İncelemeler
  • Yorumlar

TrendLinePro2

★★★★★4.8(25 reviews) Rating on gogojungle


【 TrendLinePro2 】

   MT4 (MetaTrader 4) line trading aid indicator.

   It is a very basic specification that is recommended for everyone, assuming that it is faithful to the Dow Theory.

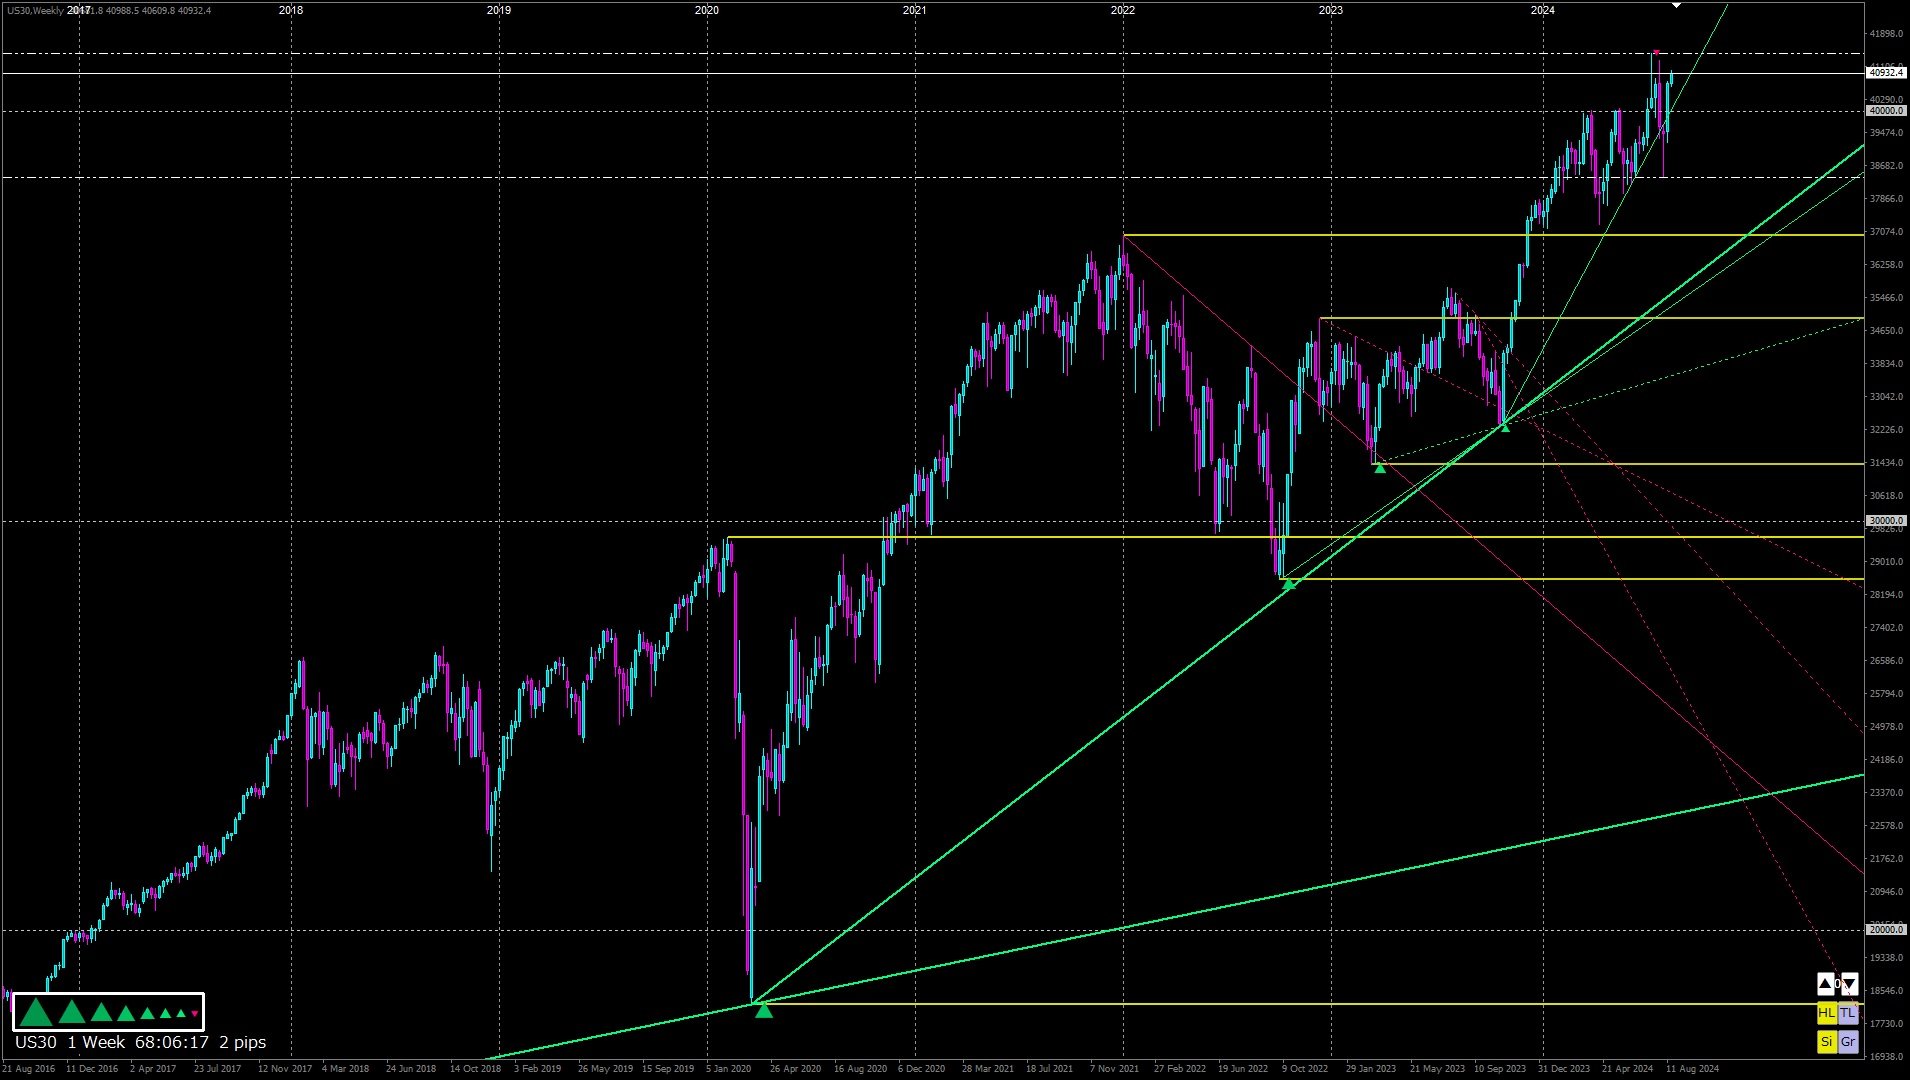
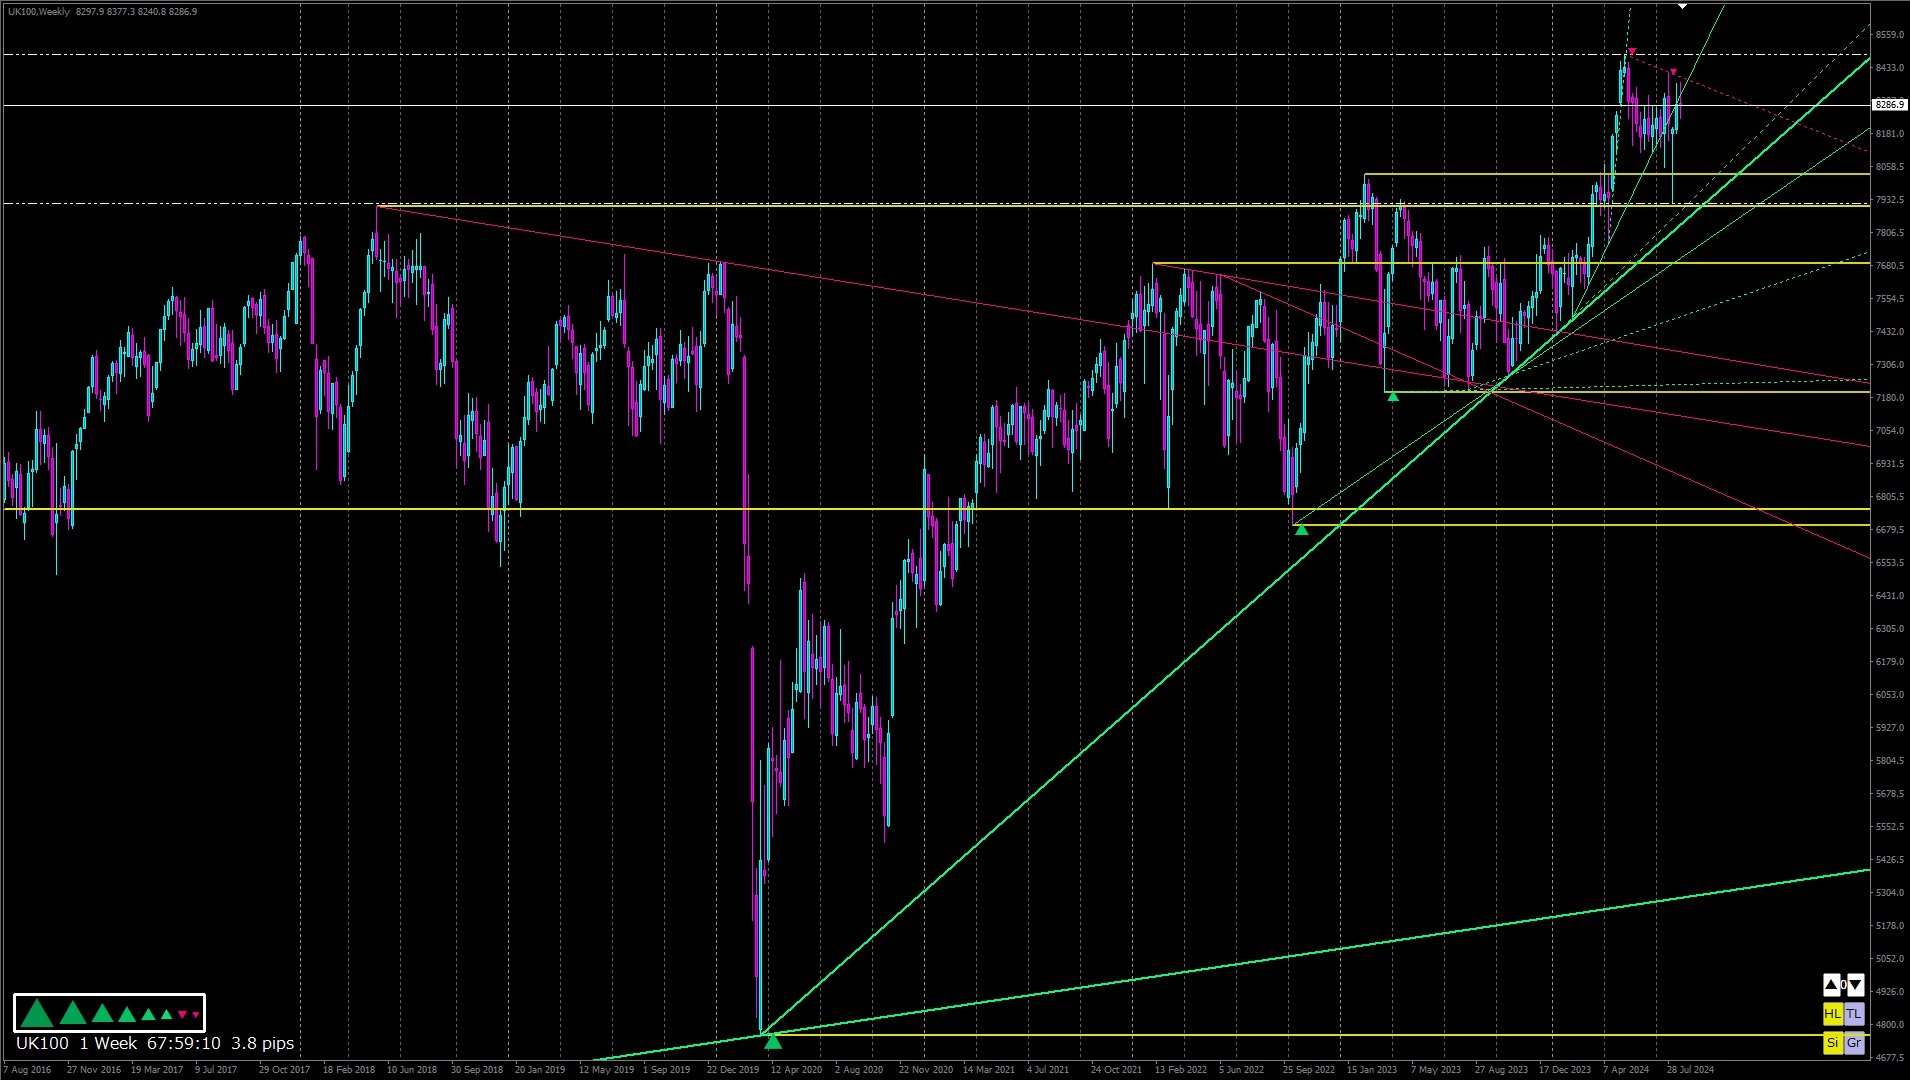
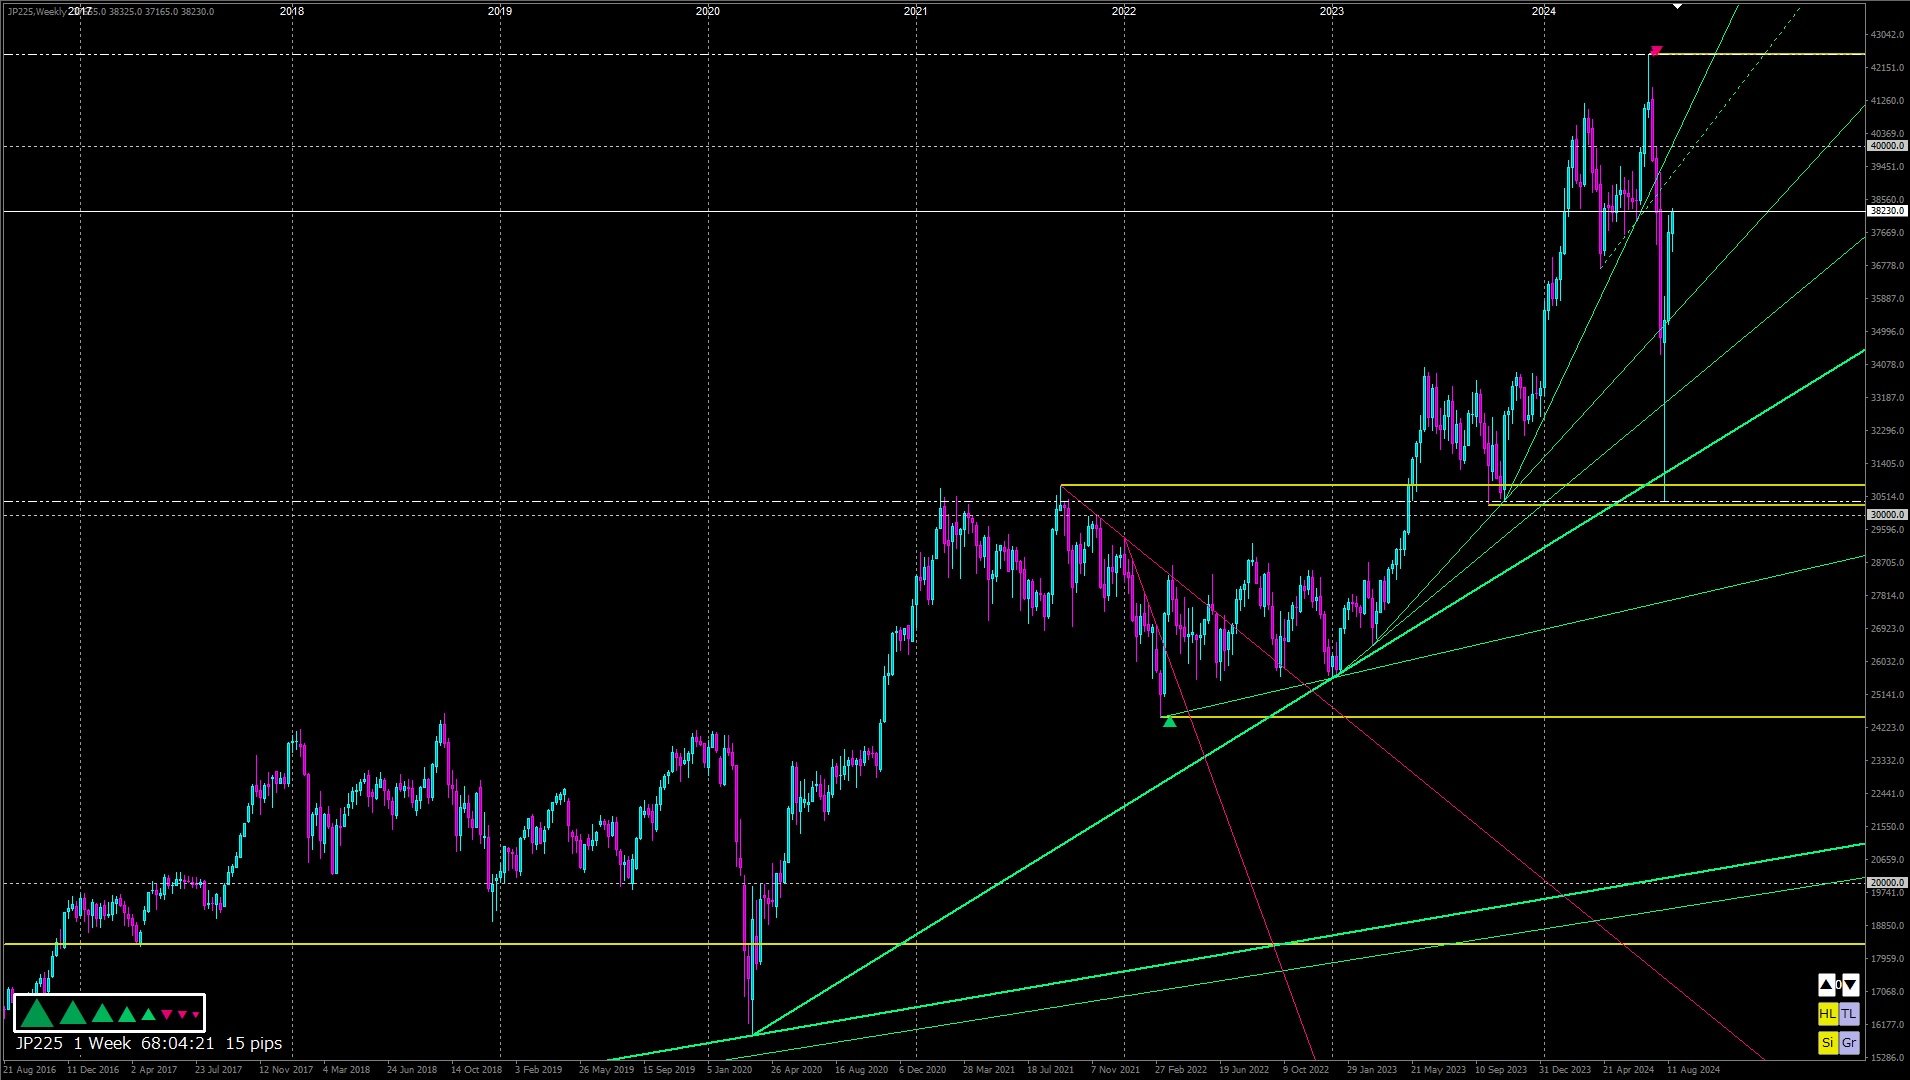
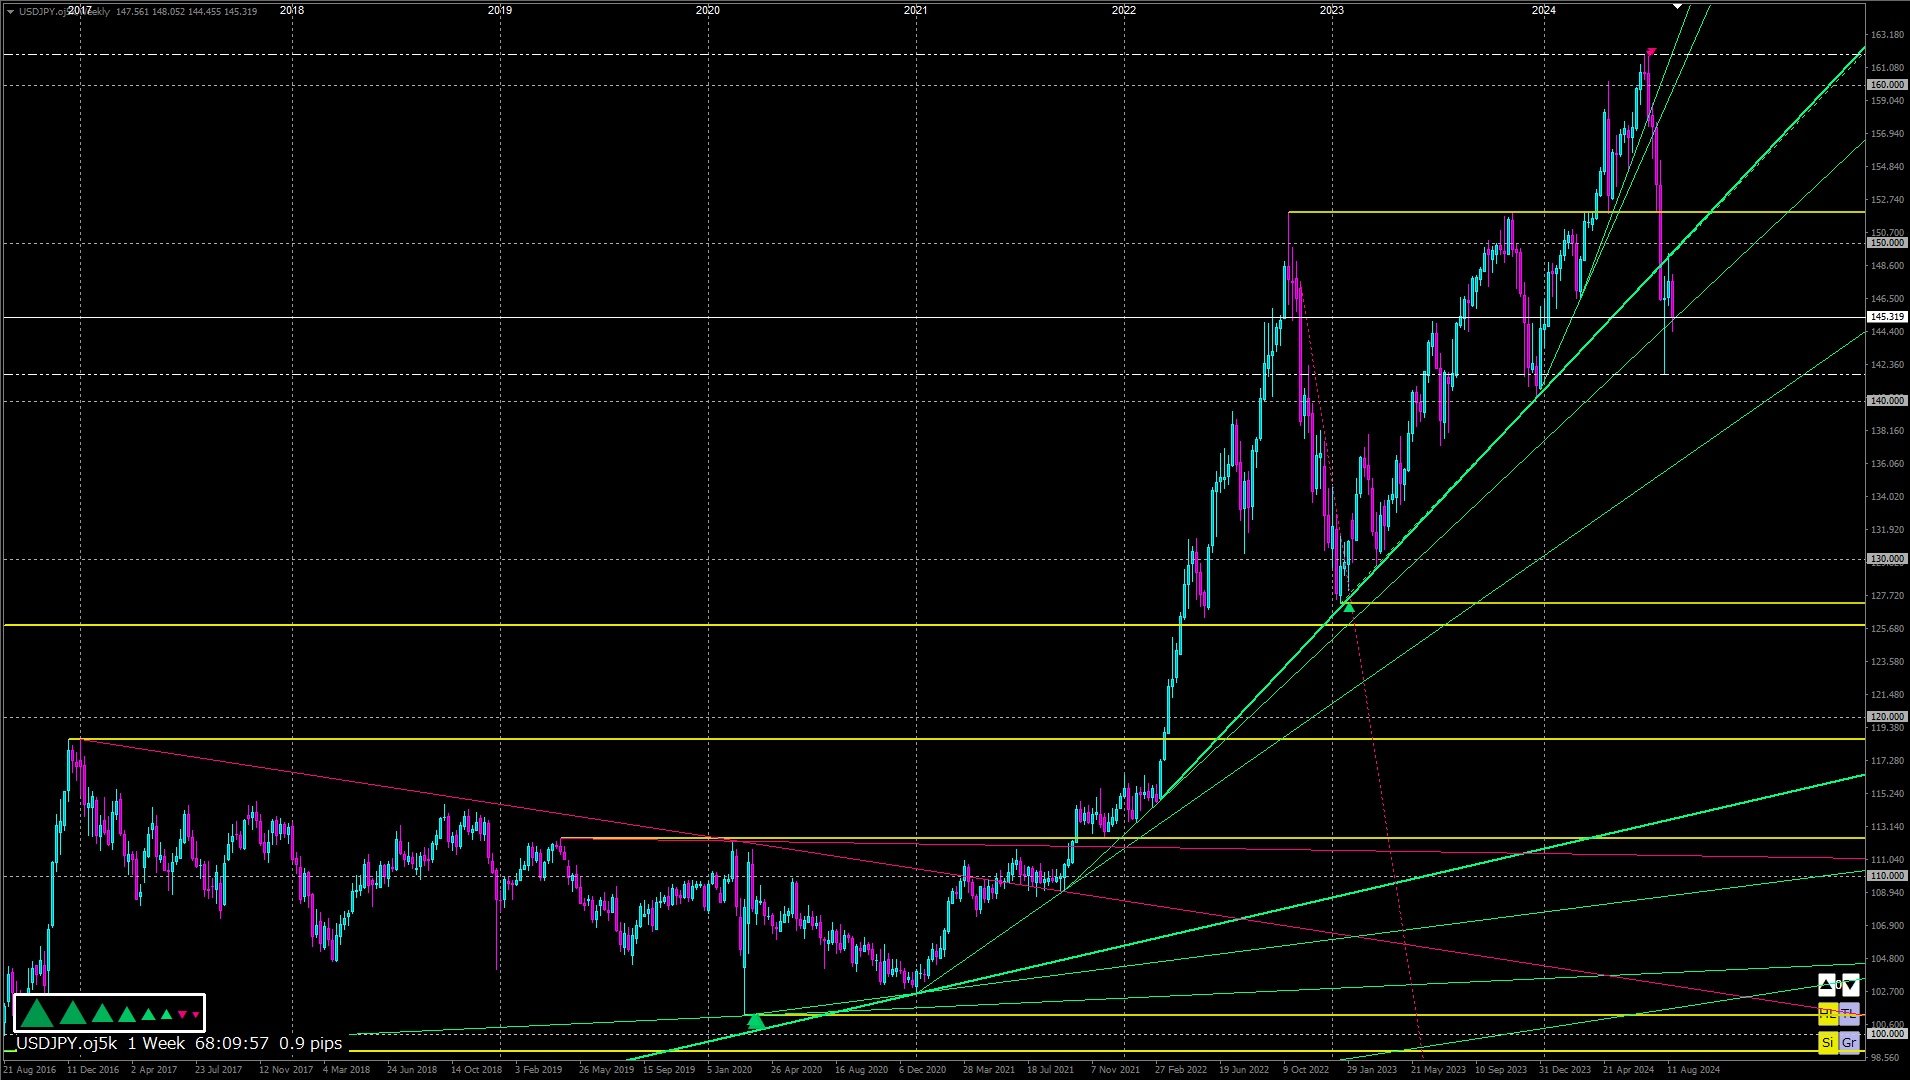
   It recognises trends based on the Dow Theory and furthermore automatically draws support, resistance and trend lines in real time.

   The accuracy is very high.


【 Behaviour check 】

   On Youtube, a video is uploaded every weekend to confirm the behaviour.


【 ZigZag 】

   Based on the original zigzag created from the chart shape and in line with Dow Theory.

   The trend that can be read from the zigzag is bundled up to eight levels in line with Dow Theory.


【 Sign 】

   Shows the trend direction along the 8-step zigzag based on Dow Theory.

   ▲ Green (uptrend) ▼ Red (downtrend) ■ White (trendless)

   ▲Yellow (five or more trends from the minimum indicate an uptrend) ▼Yellow (five or more trends from the minimum indicate a downtrend)


【 Lines 】

   Trendlines, supportlines and resistancelines (Horizon) are drawn along an eight-step zigzag based on Dow Theory.

   The various lines are automatically drawn and deleted at the appropriate time.

   If you want to draw channel lines manually, double-click the line and move it while holding down the Ctrl key.


【 Grid 】

   The vertical (price) and horizontal (time) axes are designed to be delimited at the right place.

   The number of separators can be set to a maximum value, and the number will automatically change accordingly.
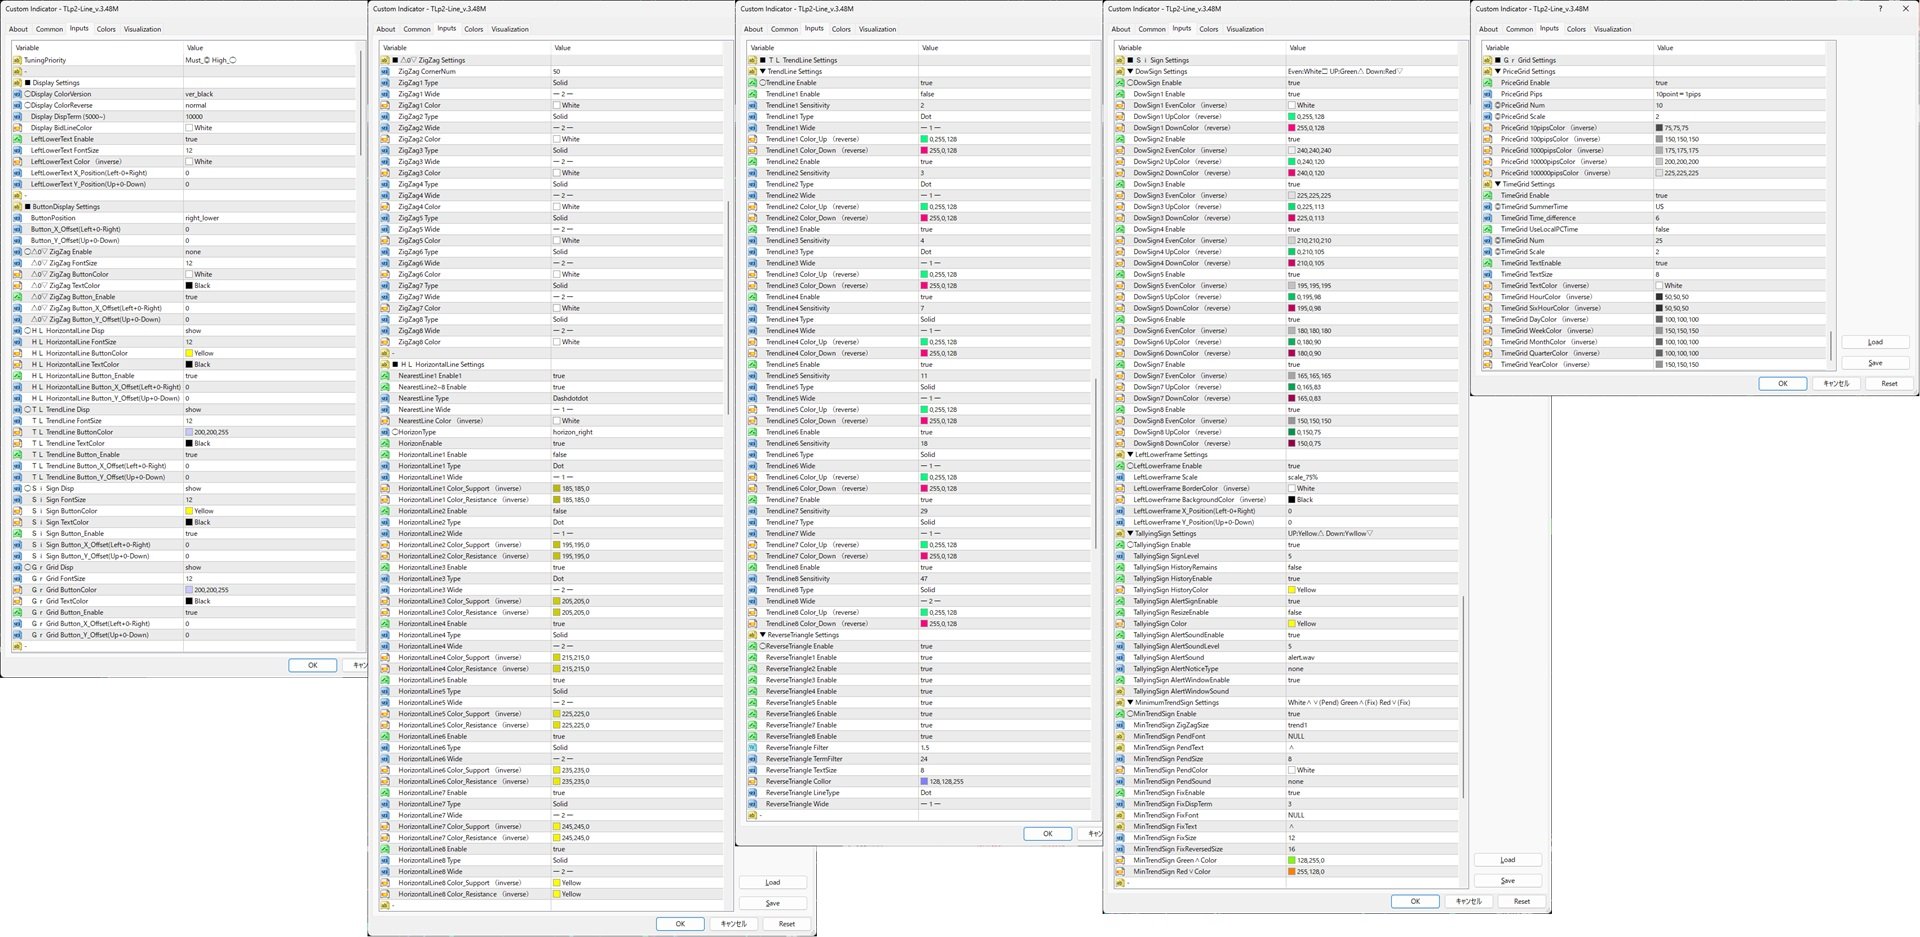
   

【 Parameter

   The parameters are explained below.

ーーーーーーーーーーーーーーー

   TuningPriority → Mark on the left side of each parameter ◎: Change required ○: Change priority

-

■ Display Settings → Item for setting the overall display.


◯Display ColorVersion → Select black if the background is black, or white if it is white. The target parameter has (inverse) next to its name.

◯Display ColorReverse → Change this if you want to invert the green for raising and the red for lowering. The target parameter has (reverse) next to its name.

   Display DispTerm (5000~) → Specify the calculation range. We recommend 5000 or higher.

   Display BidLineColor → Specify the color of the bid line.

   LeftLowerText Enable → Show/hide the text at the bottom left of the chart

   LeftLowerText FontSize → Font size of the text at the bottom left of the chart

   LeftLowerText Color (inverse) → Show the text at the bottom left of the chart

   LeftLowerText X_Position(Left-0+Right) → Move the text at the bottom left of the chart along the horizontal axis

   LeftLowerText Y_Position(Up+0-Down) → Move the text at the bottom left of the chart along the vertical axis

-

■ ButtonDisplay Settings → Settings for the bottom right button of the chart


    ButtonPosition → You can move the bottom right button of the chart to the top right

    Button_X_Offset(Left+0-Right) → Move the bottom right button of the chart on the horizontal axis

    Button_Y_Offset(Up+0-Down) → Move the bottom right button of the chart on the vertical axis

◯△0▽ ZigZag Enable → Display (1~8)/Hide (0) the zigzag

   △0▽ ZigZag FontSize → Bottom right of the chart △0▽ Button text size

   △0▽ ZigZag ButtonColor → Bottom right of the chart △0▽ Button color

   △0▽ ZigZag TextColor → Bottom right of the chart △0▽ Button text color

   △0▽ ZigZag Button_Enable → Bottom right of the chart △0▽ Display/hide the button

   △0▽ ZigZag Button_X_Offset(Left+0-Right) → Bottom right of the chart △0▽ Move the button on the horizontal axis

   △0▽ ZigZag Button_Y_Offset(Up+0-Down) → Bottom right of the chart △0▽ Move the button on the vertical axis

   ◯HL HorizontalLine Disp → Show/hide the horizontal line (Horizon) 

   HL HorizontalLine FontSize → Font size of the HL button on the bottom right of the chart

   HL HorizontalLine ButtonColor → Color of the HL button on the bottom right of the chart

   HL HorizontalLine TextColor → Font color of the HL button on the bottom right of the chart

   HL HorizontalLine Button_Enable → Show/hide the HL button on the bottom right of the chart

   HL HorizontalLine Button_X_Offset(Left+0-Right) → Move the HL button on the horizontal axis on the bottom right of the chart

   HL HorizontalLine Button_Y_Offset(Up+0-Down) → Move the HL button on the vertical axis on the bottom right of the chart

◯TL TrendLine Disp → Show/hide the trend line

   TL TrendLine FontSize → Font size of the TL button at the bottom right of the chart

   TL TrendLine ButtonColor → Color of the TL button at the bottom right of the chart

   TL TrendLine TextColor → Font color of the TL button at the bottom right of the chart

   TL TrendLine Button_Enable → Display/hide the TL button at the bottom right of the chart

   TL TrendLine Button_X_Offset(Left+0-Right) → Move the TL button at the bottom right of the chart along the horizontal axis

   TL TrendLine Button_Y_Offset(Up+0-Down) → Move the TL button at the bottom right of the chart along the vertical axis

◯Si Sign Disp → Display/hide the sign

   Si Sign FontSize → Font color of the SI button at the bottom right of the chart

   Si Sign ButtonColor → Color of the SI button at the bottom right of the chart

   Si Sign TextColor → Font color of the SI button at the bottom right of the chart

   Si Sign Button_Enable → Display/hide the SI button at the bottom right of the chart

   Si Sign Button_X_Offset(Left+0-Right) → Move the Si button at the bottom right of the chart along the horizontal axis

   Si Sign Button_Y_Offset(Up+0-Down) → Move the Si button at the bottom right of the chart along the vertical axis

◯Gr Grid Disp → Show/hide the grid

   Gr Grid FontSize → Font size of the Gr button at the bottom right of the chart

   Gr Grid ButtonColor → Color of the Gr button at the bottom right of the chart

   Gr Grid TextColor → Font color of the Gr button at the bottom right of the chart

   Gr Grid Button_Enable → Show/hide the Gr button at the bottom right of the chart

   Gr Grid Button_X_Offset(Left+0-Right) → Move the Gr button at the bottom right of the chart along the horizontal axis

   Gr Grid Button_Y_Offset(Up+0-Down) → Move the Gr button at the bottom right of the chart along the vertical axis

-

■ △0▽ ZigZag Settings → △0▽ ZigZag Settings

   ZigZag CornerNum → ZigZag display range (number of corners)

   ZigZag1 Type → ZigZag1 line type

   ZigZag1 Wide → ZigZag1 line thickness

   ZigZag1 Color → ZigZag1 line color

   ZigZag2 Type → ZigZag2…

   ※ The rest is the same as 1.

-

■ HL HorizontalLine Settings → HL horizontal line (Horizon) settings

   NearestLine1 Enable1 → Display/hide undetermined most recent high/low line 1

   NearestLine2~8 Enable → Display/hide undetermined most recent high/low line 2~8

   NearestLine Type → Type of undetermined most recent high/low line

   NearestLine Wide → Width of undetermined most recent high/low line

   NearestLine Color (inverse) → Color of undetermined most recent high/low line

◯HorizonType → Select the type of horizontal line (normal, with rate, right side only)

   HorizonEnable → Display/hide horizontal line

   HorizontalLine1 Enable → Display/hide horizontal line 1

   HorizontalLine1 Type → Type of horizontal line 1

   HorizontalLine1 Wide → Width of horizontal line 1

   HorizontalLine1 Color_Support (inverse) → Color of support line of horizontal line 1

   HorizontalLine1 Color_Resistance (inverse) → Color of resistance line of horizontal line 1 

   HorizontalLine2 Enable → Display/hide horizontal line 2…

   ※ The rest is the same as 1.

-

■ TL TrendLine Settings → TL Trendline Settings


▼ TrendLine Settings → Trendline Settings


◯TrendLine Enable → Show/hide trendline

   TrendLine1 Enable → Show/hide trendline 1

   TrendLine1 Sensitivity → Trendline 1 drawing sensitivity (thin out lines below the specified number)

   TrendLine1 Type → Line type of trendline 1

   TrendLine1 Wide → Line width of trendline 1

   TrendLine1 Color_Up (reverse) → Color of trendline 1 rising

   TrendLine1 Color_Down (reverse) → Color of trendline 1 falling

   TrendLine2 Enable → Show/hide trendline 2

   ※ The rest is the same as 1.


▼ ReverseTriangle Settings → Inverse triangle (broadening formation) settings


◯ReverseTriangle Enable → Show/hide inverse triangle

   ReverseTriangle1 Enable → Show/hide inverse triangle 1

   ReverseTriangle2 Enable → Show/hide inverse triangle 2

   ReverseTriangle3 Enable → Show/hide inverse triangle 3

   ReverseTriangle4 Enable → Show/hide inverse triangle 4

   ReverseTriangle5 Enable → Show/hide inverse triangle 5

   ReverseTriangle6 Enable → Show/hide inverse triangle 6

   ReverseTriangle7 Enable → Show/hide inverse triangle 7

   ReverseTriangle8 Enable → Show/hide inverse triangle 8

   ReverseTriangle Filter → Angle magnification/upper limit of inverse triangle

   ReverseTriangle TermFilter → Number of inverse triangles drawn/lower limit

   ReverseTriangle TextSize → Font size of inverse triangle

   ReverseTriangle Color → Line color of the inverted triangle

   ReverseTriangle LineType → Line type of the inverted triangle

   ReverseTriangle Wide → Line width of the inverted triangle

-

■ SI Sign Settings → SI Sign Settings


▼ DowSign Settings → Dow Theory Sign White□Green△Red▽ Settings


◯DowSign Enable → Show/Hide Dow Theory Sign

   DowSign1 Enable → Show/Hide Dow Theory Sign 1

   DowSign1 EvenColor (inverse) → Dow Theory White□ Sign 1 Color

   DowSign1 UpColor (reverse) → Dow Theory Green△ Sign 1 Color

   DowSign1 DownColor (reverse) → Dow Theory Red▽ Sign 1 Color

   DowSign2 Enable → Dow Theory White□ Sign 2…

   ※ The rest is the same as 1.


▼ LeftLowerFrame Settings → Setting the white border at the bottom left of the chart


◯LeftLowerFrame Enable → Show/hide the white border at the bottom left of the chart

   LeftLowerFrame Scale → Display magnification of the white border at the bottom left of the chart

   LeftLowerFrame BorderColor (inverse) → Border color of the white border at the bottom left of the chart

   LeftLowerFrame BackgroundColor (inverse) → Background color of the white border at the bottom left of the chart

   LeftLowerFrame X_Position(Left-0+Right) → Movement of the white border at the bottom left of the chart along the horizontal axis

   LeftLowerFrame Y_Position(Up+0-Down) → Movement of the white border at the bottom left of the chart along the vertical axis


▼ TallyingSign Settings → Setting Yellow△Yellow▽


   Yellow△Yellow▽ that responds when the orientations of 1 to 8 white□green△red▽ are aligned

   When TallyingSign SignLevel = “5” (default value)


   ▽▽▽▲▲▲▲▲ Number of trends = 5 A state where trend directions up to number 5 are aligned with ▲

   ▽▽▲▲▲▲▲▲ Trend count = 6 A state where trend directions up to number 6 are aligned with ▲

   ▽▲▲▲▲▲▲▲ Trend count = 7 A state where trend directions up to number 7 are aligned with ▲

   ▲▲▲▲▲▲▲▲ Trend count = 8 A state where all 8 trend directions are aligned with ▲

   ⑧⑦⑥⑤④③②① Represents the larger standard ⑧ to the smaller standard ①.

   ▼▼▼▼▼▼▼▼ Number of trends = 8 All 8 trend directions are aligned with ▼

   △▼▼▼▼▼▼▼ Number of trends = 7 Trend directions up to 7 are aligned with ▼

   △△▼▼▼▼▼▼ Number of trends = 6 Trend directions up to 6 are aligned with ▼

   △△△▼▼▼▼▼ Number of trends = 5 Trend directions up to 5 are aligned with ▼


◯TallyingSign Enable → Show/hide yellow△yellow▽

   TallyingSign SignLevel → Number of yellow△yellow▽ trends

   TallyingSign HistoryRemains → Keep/do not keep past history after yellow△yellow▽ reversal

   TallyingSign HistoryEnable → Show/hide small yellow△yellow▽ (displayed each time the orientation of white□green△red▽ is aligned)

   TallyingSign HistoryColor → Color of small yellow△yellow▽

   TallyingSign AlertSignEnable → Show/hide large yellow△yellow▽

   TallyingSign ResizeEnable → Displays additional trends when the number of large yellow △ yellow ▽ trends increases

   TallyingSign Color → Color of large yellow △ yellow ▽

   TallyingSign AlertSoundEnable → Enable or disable large yellow △ yellow ▽ alerts

   TallyingSign AlertSoundLevel → Number of trends that trigger a large yellow △ yellow ▽ alert

   TallyingSign AlertSound → Alert sound for large yellow △ yellow ▽

   TallyingSign AlertNoticeType → Alert type for large yellow △ yellow ▽

   TallyingSign AlertWindowEnable → Alert window for large yellow △ yellow ▽

   TallyingSign AlertWindowSound → Cannot be set. MT4 sound settings take priority when the alert window is displayed.


▼ MinimumTrendSign Settings → Settings for updating the most recent high and low values ​​White ∧∨ Green ∧ Red ∨


   White ∧∨: Displayed when the most recent high and low values ​​of the specified small trend are updated (unconfirmed)

   Green ∧ Red ∨: Displayed when the most recent high and low values ​​of the specified small trend are updated (confirmed)

◯MinTrendSign Enable → Display/hide White ∧∨ Green ∧ Red ∨

   MinTrendSign ZigZagSize → Trend size of White ∧∨ Green ∧ Red ∨

   MinTrendSign PendFont → Font of White ∧∨

   MinTrendSign PendText → Display symbol of White ∧∨

   MinTrendSign PendSize → Size of White ∧∨

   MinTrendSign PendColor → Color of White ∧∨

   MinTrendSign PendSound → White ∧∨ alert

   MinTrendSign FixEnable → Show/hide Green ∧ Red ∨

   MinTrendSign FixDispTerm → Number of Green ∧ Red ∨ displayed

   MinTrendSign FixFont → Font for Green ∧ Red ∨

   MinTrendSign FixText → Display symbol for Green ∧ Red ∨

   MinTrendSign FixSize → Size of Green ∧ Red ∨

   MinTrendSign FixReversedSize → Size of Green ∧ Red ∨ when reversed

   MinTrendSign Green∧Color → Color of Green ∧

   MinTrendSign Red∨Color → Color of Red ∨

-

■ Gr Grid Settings → Gr Grid Settings


▼ PriceGrid Settings → Vertical axis (price) grid settings


   PriceGrid Enable → Show/hide vertical axis

   PriceGrid Pips → Vertical axis magnification Corresponds to different magnifications depending on MT4

◎PriceGrid Num → Maximum number of grids on vertical axis when chart is reduced

◎PriceGrid Scale → Number of charts lined up vertically when chart is reduced (affects maximum number of grids when chart is expanded)

   PriceGrid 10pipsColor (inverse) → Color of grid every 10 pips

   PriceGrid 100pipsColor (inverse) → Color of grid every 100 pips

   PriceGrid 1000pipsColor (inverse) → Color of grid every 1000 pips

   PriceGrid 10000pipsColor (inverse) → Color of grid every 10000 pips

   PriceGrid 10000pipsColor (inverse) → Color of grid every 10000 pips

   PriceGrid 100000pipsColor (inverse) → Color of grid every 100000 pips


▼ TimeGrid Settings → Horizontal axis (time) grid settings


   TimeGrid Enable → Show/hide horizontal axis

◎TimeGrid SummerTime → Horizontal axis server time standard (US format for all but XM)

   TimeGrid Time_difference → Adjust horizontal axis time difference

   TimeGrid UseLocalPCTime → Use PC time

◎TimeGrid Num → Upper limit of horizontal axis grids when the chart is reduced

◎TimeGrid Scale → Number of charts lined up vertically when the chart is reduced (Affects the number of grids when the chart is maximized.)

   TimeGrid TextEnable → Show/hide date and time text on the horizontal axis

   TimeGrid TextSize → Date and time text size on the horizontal axis

   TimeGrid TextColor (inverse) → Date and time text color on the horizontal axis

   TimeGrid HourColor (inverse) → Color of grids for every hour

   TimeGrid SixHourColor (inverse) → Color of grids for every six hours

   TimeGrid DayColor (inverse) → Color of grids for every day

   TimeGrid WeekColor (inverse) → Weekly grid color

   TimeGrid MonthColor (inverse) → Monthly grid color

   TimeGrid QuarterColor (inverse) → Quarterly grid color

   TimeGrid YearColor (inverse) → Yearly grid color

ーーーーーーーーーーーーーーー

Önerilen ürünler
VR Cub
Vladimir Pastushak
VR Cub , yüksek kaliteli giriş noktaları elde etmenin bir göstergesidir. Gösterge, matematiksel hesaplamaları kolaylaştırmak ve bir pozisyona giriş noktalarının aranmasını basitleştirmek için geliştirildi. Göstergenin yazıldığı ticaret stratejisi uzun yıllardan beri etkinliğini kanıtlamaktadır. Ticaret stratejisinin basitliği, acemi yatırımcıların bile başarılı bir şekilde ticaret yapmasına olanak tanıyan büyük avantajıdır. VR Cub, pozisyon açılış noktalarını ve Kâr Al ve Zararı Durdur hedef sev
SRP Pro
Farhad Kia
5 (1)
Strong Retracement Points Pro edition! SRP (Strong Retracement/Reversal Points) is a powerful and unique support and resistance indicator. It displays the closest important levels which we expect the price retracement/reversal! If all level are broken from one side, it recalculates and draws new support and resistance levels, so the levels might be valid for several days depending on the market! If you are still hesitating to start using this wonderful tool, you can check this link to see how ef
PABT Pattern Indicator - it's classical system one of the signal patterns. Indicator logic - the Hi & Lo of the bar is fully within the range of the preceding bar, look to trade them as pullback in trend. In the way if indicator found PABT pattern it's drawing two lines and arrow what showing trend way.  - First line - it's entry point and drawing at: 1. On the high of signal bar or on middle of the signal bar (depending from indicator mode) for buy; 2. On the low of signal bar or on middle of t
Market Structure Zig Zag
Lesedi Oliver Seilane
4.77 (22)
Free Market structure zig zag to assist in price action trading the screenshots describe how to use and how to spot patterns new version comes with alerts, email alert and  push notification alert can be used on all pairs  can be used on all timeframes  you can add additional confirmation indicators the indicator shows you your higher high and low highs as well as your lower lows and lower highs  the indication makes price action analysis easier to spot.
FREE
Black series MT4
Dmitriy Kashevich
1 (1)
Black series MT4 - The indicator is designed for trading on binary options with Timeframe M1-M5-M15 Multicurrency (Works on cryptocurrency and currency pairs) The signal appears when the candle opens Up to 90% correct signals There is no signal redrawing at all Can be used with other indicators. Good for scalping! In Settings there is: -Indicator working methods -I Allert Arrow color Red signal down Blue signal up Also watch the video how the indicator works and signals
Next level of trend trading here. Possibility 75%, the indicator analyzes the current market to determine short (small dot), middle (circle with a dot inside) and long (cross with a circle and a dot inside) trends.  Wingdings characters of  Aqua color represents the beginning of the UP trend. Wingdings characters of  Orange color represents the beginning of the DOWN trend. Possibility 75% Indicator will improve your trading in the world of forex, commodities, cryptocurrencies and indices.
Fourteen plus nine What is it for? Applying Tom DeMark’s TD Sequential serves the purpose of identifying a price point where an uptrend or a downtrend exhausts itself and reverses. . What are the main components of TD Sequential? TD Sequential has two parts – TD Setup and TD Countdown. The first phase of TD Sequential starts with a TD Setup and is completed with a 9 count. When the 9 count is completed, it is at that point, a price pause, price pullback, or reversal is likely. It is also at tha
Noize Absorption Index MT4
Ekaterina Saltykova
5 (1)
Noize Absorption Index - is the manual trading system that measures the difference of pressure between bears forces and bulls forces. Green line - is a noize free index that showing curent situation. Zero value of index shows totally choppy/flat market.Values above zero level shows how powerfull bullish wave is and values below zero measures bearish forces.Up arrow appears on bearish market when it's ready to reverse, dn arrow appears on weak bullish market, as a result of reverse expectation. S
Owl smart levels
Sergey Ermolov
4.13 (23)
MT5 versiyonu  |  FAQ Owl Smart Levels Indicator ,   Bill Williams'ın gelişmiş fraktalları , piyasanın doğru dalga yapısını oluşturan Valable ZigZag ve kesin giriş seviyelerini gösteren   Fibonacci seviyeleri   gibi popüler piyasa analiz araçlarını içeren tek gösterge içinde eksiksiz bir ticaret sistemidir. pazara ve kar elde edilecek yerlere. Stratejinin ayrıntılı açıklaması Gösterge ile çalışma talimatı Baykuş Yardımcısı ticaretinde Danışman Yardımcısı Kullanıcıların özel sohbeti -> Satın ald
Forex Gump
Andrey Kozak
2.75 (4)
Forex Gump is a fully finished semi-automatic trading system. In the form of arrows, signals are displayed on the screen for opening and closing deals. All you need is to follow the instructions of the indicator. When the indicator shows a blue arrow, you need to open a buy order. When the indicator shows a red arrow, you need to open a sell order. Close orders when the indicator draws a yellow cross. In order to get the most effective result, we recommend using the timeframes H1, H4, D1. There
This is a trend indicator without redrawing Developed instead of the binary options strategy (by the color of the Martingale candlestick) Also works well in forex trading When to open trades (binary options) A signal will appear in the place with a candle signaling the current candle It is recommended to open a deal for one candle of the current timeframe M1 and M5 When a blue dot appears, open a deal up When a red dot appears, open a trade down. How to open trades on Forex. When a signal is rec
Trendiness Index
Libertas LLC
5 (3)
"The trend is your friend" is one of the best known sayings in investing, because capturing large trendy price movements can be extremely profitable. However, trading with the trend is often easier said than done, because many indicators are based on price reversals not trends. These aren't very effective at identifying trendy periods, or predicting whether trends will continue. We developed the Trendiness Index to help address this problem by indicating the strength and direction of price trend
GMMA Trade X is an EA based on GMMA. GMMA parameters such as MovingAveragePeriod1-24, MovingAverageMAShift1-24, MovingAverageShift1-24 and CandlestickShift1-24 can be adjusted. GMMA Trade X applies BTN TECHNOLOGY's state-of-the-art intelligent technology to help you create optimal results for your trades. May your dreams come true through GMMA Trade X. Good luck. = == == Inquiries = == == E-Mail:support@btntechfx.com
Sto Signal AM
Andriy Matviyevs'kyy
This indicator displays Stochastic osc signals on the price chart and allows the user to receive notifications of such signals. The Stochastic indicator is a classic and proven indicator of the technical analysis of the markets. Despite its age, it is still relevant today. Depending on the settings, the indicator allows you to work effectively on various TFs and any markets. Signals are given on fully formed bars and are not redrawn. Custom Parameters: Stochastic_Price (0-1) - The applied pric
FREE
Chart Patterns Detect 15 patterns (Ascending Triangle, Descending Triangle, Rising Wedge, Falling Wedge, Bullish Flag, Bearish Flag, Bullish Rectangle, Bearish Rectangle Symmetrical triangle, Head and Shoulders, Inverted Head and Shoulders, Triple top, Triple Bottom, Double Top, Double Bottom) Use historical data to calculate the probability of each pattern to succeed (possibility to filter notification according to the chance of success) gives graphic indication about the invalidation level and
Fibonacci indicator based on fractal.This software can automatically draw the golden section proportional line of two trend lines, and mark all the recent high and low prices.And the percentage value of volatility is a multi-cycle, multi-currency oscillation indicator.It is very effective for traders to find support and resistance lines and find entry and exit points near them.
The Stepping Trend Indicator     The Steppi ng Trend indicator uses the  average true range  (ATR indicator) in its calculation. This gives you control to set your own average true range period, I set the Default as 10.   Indicator Details. Green Arrow Up: This means you are at the starting point of a new bullish trend, it’s time to buy.   Red  Arrow  Down : This means you are at the starting point of a new  bearish  trend, it’ s time to sell .   What if you miss the Arrow Signal?   No
For sure, this indicator has become very popular amongst traders. Through coding this indicator will give you the most accurate levels possible for your trading analysis. We have also added in the ability for you to receive alerts when the price breaks above or below a Support or Resistance lines! HOW TO USE The red rectangles represent your resistance/supply zone. The green rectangles represent your support/demand zone.  BONUS FEATURES We coded this indicator with the ability to switch between
Insider Scalper Binary This tool is designed to trade binary options. for short temporary spends. to make a deal is worth the moment of receiving the signal and only 1 candle if it is m1 then only for a minute and so in accordance with the timeframe. for better results, you need to select well-volatile charts.... recommended currency pairs eur | usd, usd | jpy .... the indicator is already configured, you just have to add it to the chart and trade .... The indicator signals the next can
Advance Currency Meter is a currency meter that detects strong market trends. This indicator is good for scalping, intraday trading and swing trading. The indicator will detect short term to long term market trends. This will give you good insight which currencies are best to trade as of the moment. Note : Kindly contact me before you make any purchases. Works well with my MACD Currency Strength Meter
Trend Yakalayıcı: Alarm İndikatörü ile Trend Yakalayıcı Stratejisi, piyasa trendlerini ve potansiyel giriş ve çıkış noktalarını belirlemede yardımcı olan çok yönlü bir teknik analiz aracıdır. Piyasa koşullarına uyum sağlayarak trend yönünün net görsel temsili için dinamik bir Trend Yakalayıcı Stratejisi sunar. Tüccarlar tercihlerine ve risk toleranslarına göre parametreleri özelleştirebilirler. Gösterge, trendleri tanımlamaya yardımcı olur, potansiyel ters dönüşleri sinyaller, trailing stop m
FREE
Shark Deal Book
Philip Pankaj Suthagar
4 (3)
Term  "shark"  in the business world denotes a high volume investor who just made a good investment in a highly Potential business deal.So, sharks are the ones who make the market move. In our case, if an American shark bought a Japanese company, he/she has to convert American dollars into Japanese yen to make the deal. So, the demand for the Japanese yen will increase sharply. Thus USD/JPY will go short rapidly if the deal was from the shark. Another example, In the case of forex, if fed increa
The Riko Trend indicator is a revolutionary trend trading and filtering solution with all the important features of a trend tool built into one tool! The Riko Trend indicator is good for any trader, suitable for any trader for both forex and binary options. You don’t need to configure anything, everything is perfected by time and experience, it works great during a flat and in a trend. The Riko Trend indicator is a technical analysis tool for financial markets that reflects the current price
Bu, bir mumun kapanış fiyatını tahmin eden bir göstergedir. Gösterge öncelikle D1 çizelgelerinde kullanılmak üzere tasarlanmıştır. Bu gösterge hem geleneksel forex ticareti hem de ikili opsiyon ticareti için uygundur. Gösterge, bağımsız bir ticaret sistemi olarak kullanılabilir veya mevcut ticaret sisteminize ek olarak hareket edebilir. Bu gösterge, mevcut mumu analiz ederek mumun gövdesi içindeki belirli güç faktörlerini ve önceki mumun parametrelerini hesaplar. Böylece gösterge, piyasa hareket
The Chaikin Oscillator is a technical indicator developed by Marc Chaikin that combines price and volume data to measure the accumulation and distribution of a financial instrument. It aims to identify potential buying and selling opportunities in the market. The Chaikin Oscillator is calculated by subtracting a 10-day exponential moving average of the Accumulation Distribution Line (ADL) from a 3-day exponential moving average of the ADL. Here's how to use the Chaikin Oscillator indicator in tr
IconTradeSL
Vadim Gorodetskii
IconTradeSL.  Возможность выставлять sl по уровням. В индикаторе установлена возможность показывать историю уровней на графике. Возможность выставлять sl по уровням. Настройки индикатора: ЦВЕТ_BAR - цвет баров по которым ищем SL ЦВЕТ_Тек_BAR - Purple;//цвет текущего бара BAR - поиск в последних BAR барах (по умолчанию 200) show_bar - показывать бары по которым ищем SL
Introduction It is common practice for professional trades to hide their stop loss / take profit from their brokers. Either from keeping their strategy to the themselves or from the fear that their broker works against them. Using this indicator, the stop loss / take profit points will be drawn on the product chart using the bid price. So, you can see exactly when the price is hit and close it manually.  Usage Once attached to the chart, the indicator scans the open orders to attach lines fo
Indicator for binary options arrow is easy to use and does not require configuration works on all currency pairs, cryptocurrencies buy signal blue up arrow sell signal red down arrow tips do not trade during news and 15-30 minutes before their release, as the market is too volatile and there is a lot of noise it is worth entering trades one or two candles from the current period (recommended for 1 candle) timeframe up to m 15 recommended money management fixed lot or fixed percentage of the depo
5 signal in 1  Product     TimeFrame   Recommend   1m-5m recommend  signal   TF  5m    Banks Pro Binary Option is Indicator for binary option Can Use Manaul Trade or Robot on Platform  Mt2Trading  https://www.mt2trading.com/?ref=104    Time Trading   good work  EU session    Recommend  Curency   EUR  GBP USD        careful   AUD JPY      Recommend  Martingale 2-5 Step   Recommend  set profit  2%-5%/Day Setting Brake  News Event High volatility   recommend  15-30 min Have Problem Contract
Diamond PRO
Fanur Galamov
4.84 (19)
Diamond PRO is enhanced powerful version of Diamond for advanced traders. Pro version includes optimized cores, new impoved entry points filters, new multistage profit closure algorithm and сontains number of external control parameter that allows build and fine tune own tradind decisions and algorithms. The system provides more accurate market entries, analyzes and filters upcoming economic news, contains spread protection and an advanced position management algorithm. Main goal of Diamond PRO
Bu ürünün alıcıları ayrıca şunları da satın alıyor
ÜRÜNÜ SATIN ALMADAN ÖNCE LÜTFEN AŞAĞIDAKİ BİLGİLERİ OKUYUNUZ! Apollo Pips PLUS SP benzersiz bir üründür! YENİ "APOLLO PIPS" GÖSTERGEMİ ARTI TÜM İŞLEM GÖSTERGELERİME ERİŞİM İLE "SÜPER PAKET" BONUSUNU ALMAK İSTEYENLER İÇİN! Apollo Pips PLUS SP ürününü satın alarak aslında Apollo Pips göstergemin tamamen yeni bir versiyonunu satın almış oluyorsunuz. Göstergenin bu sürümü, geliştirilmiş bir algoritmaya ve kullanımı kolay bir parametreye sahiptir; bu, size göstergeyi herhangi bir piyasada ve herhangi
Connect Indicator
Sukunthakan Ngernbamrung
Connect Indicator is a tool used for connecting indicators between the MQL market and MT4. The connected indicators are made by our group and can be used for other applications, such as sending messages to the Line application or Telegram application. If you have any questions, please don't hesitate to ask us to receive support. Function and indicator buffer Buffer one is the high price of the previous candle. Buffer two is the high price of the previous candle. Usage To connect indicators to fu
Enigmera
Ivan Stefanov
5 (2)
ENIGMERA: Pazarın çekirdeği https://www.enigmera.com Giriş Bu gösterge ve ticaret sistemi, finansal piyasalar için dikkate değer bir yaklaşımdır. ENIGMERA, destek ve direnç seviyelerini doğru bir şekilde hesaplamak için fraktal döngüleri kullanır. Gerçek birikim aşamasını gösterir ve yön ve hedefler verir.  İster bir trendde ister bir düzeltmede olalım çalışan bir sistem.  Nasıl çalışır? ENIGMERA üç çizgiden oluşur: destek/direnç çizgisi, hedef çizgisi ve sapma çizgisi. Sistem, geçmiş veril
Indicator : RealValueIndicator Description : RealValueIndicator is a powerful tool designed specifically for trading on the EURUSD pair. This indicator analyzes all EUR and USD pairs, calculates their real currency strength values, and displays them as a single realistic value to give you a head start on price. This indicator will tell you moves before they happen if you use it right. RealValueIndicator allows you to get a quick and accurate overview of the EURUSD currency pair tops and bottoms,
The indicator is designed to work on any trading platform. The program is based on proprietary algorithms and W.D.Ganna's mathematics, allowing you to calculate target levels of price movement based on three points with the highest degree of certainty. It is a great tool for stock trading. The indicator has three buttons: NEW - call up a triangle for calculation. DEL - delete the selected triangle. DELS - completely remove all constructions. The probability of achieving the goals is more than 80
TrendMaestro
Stefano Frisetti
5 (3)
note: this indicator is for METATRADER4, if you want the version for METATRADER5 this is the link:  https://www.mql5.com/it/market/product/108106 TRENDMAESTRO ver 2.4 TRENDMAESTRO recognizes a new TREND in the bud, he never makes mistakes. The certainty of identifying a new TREND is priceless. DESCRIPTION TRENDMAESTRO identifies a new TREND in the bud, this indicator examines the volatility, volumes and momentum to identify the moment in which there is an explosion of one or more of these data a
Max Paynex
Abdulkarim Karazon
Max Payne, ok şeklinde sinyaller veren bir ters/trend sinyal göstergesidir, bu gösterge sinyalini aynı çubuk kapanışında verir, bu gösterge sinyallerin ikili/üçlü onayını almak için grafik üzerinde farklı periyotlarla birden çok kez düşebilir Gösterge, hiçbir zaman yeniden boyamaz veya arkasını boyamazken, herhangi bir ticaret stiline uyacak şekilde son derece ayarlanabilir; satın alma sonrasında, kullanılan şablonların yanı sıra ekran görüntülerinde gösterilen tüm sistemi elde edeceksiniz. ---
JULY OFFER 80% OFF next price for unlimited version will be 17000$. This is the only time you can get this institutional and professional indicator at this price for unlimited version. Don't dare to miss this. The tool I am about to introduce to you you can't compare it with other tools due to its strategy and accuracy level in predicting the next price directional movement . This tool is designed for serious traders who have decided to make a difference through trading. Be the next person to wi
Dear Traders this is my another tool called " Swing Master Indicator ". As the name above the indicator is designed to help you in swing trading by capturing the low and highs of the price. You may us this tool with any trading strategy and style from scalping to position trading. It is made for level of traders including newbies and advanced traders even prop-firms, hedge funds and banks to help them make sold market analysis. I create tools for serious traders who want to make a difference in
" ZigZag on Trend " göstergesi, fiyat hareketinin yönünü belirlemenin yanı sıra bir çubuk ve pip hesaplayıcıdır. Zikzak şeklinde sunulan bir trend çizgisi ile fiyatın yönünü izleyen bir trend göstergesi ve trend yönünde geçen çubuk sayısını ve dikey ölçekteki nokta sayısını hesaplayan bir sayaçtan oluşur. (Hesaplamalar çubuğun açılmasıyla yapılır) Gösterge yeniden çizilmez. Kolaylık sağlamak için renkli çubuklar veya çizgiler şeklinde tasarlanmıştır. Tüm TF'lerde kullanılabilir, ancak en iyisi M
Bomb Bank Signal
Igor Pereira Calil
Bomb Bank Signal: Your Trusted Indicator for MetaTrader 4 The Bomb Bank Signal is a powerful indicator for MetaTrader 4, designed to identify the most relevant trends in the financial market. If you are looking for a tool that accurately anticipates movements, Bomb Bank is the ally you need. How it Works: This indicator combines three distinct methods – volume analysis, candle closes and symmetrical trend – to detect and signal buying and selling opportunities. Bomb Bank is like a "bomb"
Contact us to receive a comprehensive user guide after purchasing. William Delbert Gann, commonly known as W.D. Gann, was an exceptional market analyst renowned for his unique trading style in the early 20th century.  His trading techniques were based on a blend of mathematics, geometry, astrology, and ancient mathematics. Gann believed that stock market movements followed specific patterns and cycles, rather than being random. His methodologies, celebrated for their accuracy and relevance, con
NOTE: PRICE WILL RISE VERY SOON. DON'T SKIP THIS OFFER! Dear traders I am glad to introduce the " Market Swing Scanner Board" indicator to you. This indicator was made mainly to be used in combination with the Market Swing Index Indicator. You use the  "Market Swing Scanner Board"  indicator to scan for trading opportunities on the  Market Swing Index Indicator . This tool is designed for serious traders who have decided to make a difference through trading. Be the next person to witness this st
This indicator is based on the mathematics of the great trader W.D. Ganna. With its help, you can easily find strong levels by analyzing swings to find the optimal entry point. The indicator works on all instruments and all timeframes. The indicator is fully manual and has control buttons. All you need to do is press the NEW button, a segment will appear, which you can place on any movement, swing or even 1 candle that you want to analyze. By placing the segment, press the OK button. A grid (th
The indicator of a Professional Trader is an arrow indicator for predicting the direction of price movement. I have been working on this indicator since 2014. You can use this indicator as your main indicator, use its entry signals, and use it as your only indicator to find entry points. About the product: Recommended TF [H4-D1-W1]   . The indicator predicts the direction of the next candle. Fits a variety of tools; Flexibility in settings for different instruments and intervals through the
İŞLEM HIZI, piyasada büyük emirlerin nerede ve ne zaman biriktiğini ve bunun faydalarını gösteren en kaliteli göstergedir. Trend değişikliklerini çok erken aşamada tespit eder. Aynı anda hem bir gösterge hem de bir ticaret sistemidir. Konsept benzersiz ve inanılmaz derecede karlı. Forex'te tik hacmi oldukça yanıltıcı bir şekilde hacim olarak adlandırılır. Aslında, fiilen İŞLEM HIZI olan birim zaman başına fiyat değişimidir. Bu gösterge, Forex'teki hacim fikrini mantıksal olarak doğru şekilde
Ticaret ve piyasa yönünü tahmin etmek için döngüsel gösterge. Fiyatın döngüsel davranışını osilatör biçiminde gösterir. Osilatörün üst ve alt sınırlarından bir geri dönüş olduğunda, işlem açılmasına yönelik sinyaller verir. Histogram biçiminde trendin yumuşatılmış gücünü gösterir.  Ölçeklendirmeden gün içi işlemlere kadar her türlü ticaret stratejisini tamamlayacak.  Gösterge yeniden çizilmez.  Tüm sembollerde/aletlerde kullanıma uygundur.  Kısa vadeli işlemler için uygun zaman dilimleri M5,
Full Forex Market View Dashboard
Opengates Success International
5 (2)
TAM FOREX PİYASASI GÖRÜNÜMÜ Pano Göstergesi Bu, Yatırımcılara piyasada neler olup bittiğine dair tam bir görüş sağlamak için oluşturulmuş özel bir göstergedir. Piyasaya erişmek ve başarılı ticaret yapmak için gereken her türlü bilgiyi görüntülemek için gerçek zamanlı bir veri kullanır. KURULUM: Bu Göstergeyi pencere grafiğinize eklemeden önce, MT4'ünüzün Piyasa İzleme paneline gidin ve ihtiyaç duymadığınız veya ticaret yapmadığınız tüm Döviz çiftlerini GİZLEYİN ve geri kalanını orada bı
Gann Signal
Kirill Borovskii
Gann Signal is a very simple indicator at first glance, but hidden inside is many years of experience in studying W.D.Ganna methods. The indicator gives accurate BUY/SELL signals, without redrawing. The indicator is very easy to use. All you need to do is attach it to your chart and follow its recommendations. The indicator constantly analyzes the market for entry opportunities. When such an opportunity appears, the indicator gives a signal in the form of an arrow. I repeat, all signals are NOT
The Nihilist 5.0 Indicator includes Forexalien and Nihilist Easy Trend trading strategies and systems. It is composed of an MTF Dashboard where you can analyze the different input possibilities of each strategy at a glance. It has an alert system with different types of configurable filters. You can also configure which TF you want to be notified on your Metatrader 4 platform and Mobile application The indicator has the option to view how could be a TP and SL by using ATR or fixed points, even
Moving pivot Average Fibonacci The  indicator compares the selected period with its counterpart from the previous period. The indicator determines the moving Fibonacci levels for the day or any time interval to assess the price movement range from the time average. The indicator helps predict the expected high or low for the day based on historical time data. The pivot line can be considered an average trend line and use it in a variety of trading strategies. If you have any question about t
Al in one level
Kundan Kumar Srivastava
User feedback : "This indicator is collection of important dynamic support and resistance giving a trader crystal clear idea , where to sell and where to buy. it completely complements trend lines, support, resistance, and sideways market and allow a trader to make sustainable profits. The thickness of lines suggests its strengths, the thicker the dynamic line, the stronger is rejection or pullback allowing a trader to make multi-fold profit, as they can clearly see them." Introducing Your Ult
Oni Scalper
Goh Cheng Wai
5 (1)
Dear Onis, This Indicator is used for   GBPUSD, US30 and GOLD on 1-Min Chart . For US30 , Depending on your broker, Minimum Lot Size will differ from 0.01 to 1.0 lots. My Current Account is trading at 1.0 lots at $1 per point . Please check with your Broker what's the Margin Required for your Minimum lot sizes before you trade on your Real account. I have Forward Tested the indicator for around 6 months before releasing it to the public. ( No Demo is available for the Indicator, Strategy
Currently Price 20% OFF ( for unlimited use )   BONUS  AUX VIP Club 2024 : Include  EA Airbag  and  Load Data History  to enhance the performance of this tool to its maximum potential  Click Here to Download Files   ( for users only )   Hello World! Introducing.. SMCpro VIP tool and Indicator for MetaTrader 4, designed to revolutionize your trading experience with the ICT Smart Money Concept. This system is meticulously crafted to empower traders with advanced insights and precision in
Full STO
Roman Smoroda
Tam STO göstergesi (üç STO göstergesinin tüm sürümlerini içerir: Premium, Gold, Silver) - STABLE TRADE OPTION, otomatik ikili opsiyon ticareti için tasarlanmıştır.  DİKKATLİCE OKUYUN!!!!! ÖNEMLİ Bir terminalde farklı sürelere sahip iki şablon oluşturun: 18:01, 18:02 için 1 ila 15 dakika arasında süreleri olan bir şablon ve 22:00 için 10 ila 20 dakika arasında süreleri olan bir şablon. Kazanma oranı: Son 5 yılda %71 Para yönetimi: Mevduattan %0,3 Göstergenin bu sürümü yalnızca Gümüş ve
This indicator uses support and resistance, volume and some special formula to calculate the volume to filter the candles. If the volume reaches a specific value, And at the same time, Candle breaks the support/resistance line, There would be a signal and we can enter the market. Signals appear when the current candle closes. then you can enter the trade when a new candle appears. Please don't forget to follow your money management plan. MT5 Version Support/Resistance Breakout MT5 :   https:
WARNING: PRICE IS SUBJECT TO RISE AT ANY TIME. GET YOUR COPY TODAY TO AVOID MORE COST! Dear Traders I am so glad to introduce to you my other tool called the Forex Sniper Entries Indicator. This tool is designed to help serious traders and investors capture big moves in the currency price movements. The philosophy behind this tool is all about winning big and riding the price movement from its beginning until the maximum point. We want to capture those big moves in both down and up markets as mu
FxBears Powers
Rachid Lafhil
3 (2)
️️ Attention:   There is a new update at 22-08-2024. What's new in this update? -* New strategy integration. -* The trade is with the price trend only. -* The success rate of trades has increased by a very large percentage.      No more losses with this indicator, test it for years ago and see if there is losses in one day results. but before testing it please see the explaining video down here.    FxBears Powers is working on all forex pairs, metals, commodities, futures, indices, energies,
WARNING!! THIS SWORD IS TOO SHARP!    ONLY 10 COPIES LEFT FOR THE NEXT PRICE TO BE 8,000$ FOR UNLIMITED PLAN. Dear traders I am very glad once again to introduce to you my other tool called "Forex Sword Indicator". In short this tool is meant to give you an edge over the market that you have been waiting for  so long. Now, here it is. It is a very very simple tool but yet a dangerous sword. I call it a  Holy grail indicator!. I will not talk a lot about this tool. Just let the tool speak by itse
Limitless MT4
Dmitriy Kashevich
Limitless MT4 is a universal indicator suitable for every beginner and experienced trader. works on all currency pairs, cryptocurrencies, raw stocks Limitless MT4 - already configured and does not require additional configuration And now the main thing Why Limitless MT4? 1 complete lack of redrawing 2 two years of testing by the best specialists in trading 3 the accuracy of correct signals exceeds 80% 4 performed well in trading during news releases Trading rules 1 buy signa
Filtrele:
İnceleme yok
İncelemeye yanıt