Смотри обучающее видео по маркету на YouTube
Как купить торгового робота или индикатор
Запусти робота на
виртуальном хостинге
виртуальном хостинге
Протестируй индикатор/робота перед покупкой
Хочешь зарабатывать в Маркете?
Как подать продукт, чтобы его покупали
Новые торговые роботы и индикаторы для MetaTrader 5 - 152

1. Why did I develop this series of indicators
I found that most traders need to use multiple time frame indicators. They usually switch time frame to see indicators. However, once the timeframe is switched, you cannot see the corresponding relationship between the price in the smaller timeframe and the indicator in the larger timeframe . For example: if your price chart is in H1 timeframe, you can see H4, D1 and W1 indicators in H1 timeframe Chart. This is more helpful for you to find t

Just $10 for six months!!!. This will draw Supply & Demand zones just by clicking on a candle. It can also draw a 50% line on the zone. https://youtu.be/XeO_x7cpx8g As a drawing tool, it is not active all the time after adding it to the chart.
Activate by pressing 's' twice on the keyboard within a second. If activated but then decided not to draw, deactivate by pressing 's' once. Box color depends if candle is above or below current price.
Features: Draw the box up to the last current can
Rectangle Detector Alert
About Rectangle Detector Alert Indicator
Rectangle detector alert detects manually drawn rectangle shapes on charts and sends out push notifications
also auto extending the rectangles at the same time as new candles form.
The concept behind this indicator is based on the manual trading of supply and demand zones. Most traders prefer
to draw their supply (resistance) and demand (support) zones manually instead of depending on indicators to auto draw
the
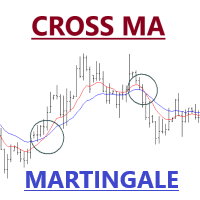
Expert Advisor of Cross two moving averages accompanied by stop loss, take profit, martingale and multi timeframes on each moving averages. You can change all the parameters contained in the moving averages
Please use as appropriate, hopefully can be useful and assist you in the transaction Don't forget to give a review if this product helps you
MA Method 0 = simple 1 = exponential 2 = smoothed 3 = LW
FREE
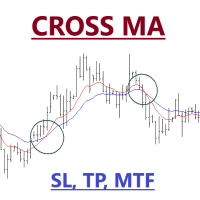
Expert Advisor of Cross two moving averages accompanied by stop loss, take profit and multi timeframes on each moving averages. You can change all the parameters contained in the moving averages
Please use as appropriate, hopefully can be useful and assist you in the transaction Don't forget to give a review if this product helps you
MA Method 0 = simple 1 = exponential 2 = smoothed 3 = LW
FREE

Simple utility to help identify local time of price movements. This way you can analyze better and prepare for future movements. Just point to the candle and it will display the time of the candle in your local time zone.
See my other products in the MQL market: https://www.mql5.com/en/users/jdelgadocr/seller Thanks for checking them out. If you have a need for something not too complex, let me know.
FREE

Fibonacci Múltiple 12, utiliza la serie fibonacci plasmado en el indicador fibonacci, aumentadolo 12 veces según su secuencia. El indicador fibonacci normalmente muestra una vez, el presente indicador se mostrara 12 veces empezando el numero que le indique siguiendo la secuencia. Se puede utilizar para ver la tendencia en periodos cortos y largos, de minutos a meses, solo aumentado el numero MULTIPLICA.

This Price indicator aid you to read prices of a bar without using native MT5 instuments like crosshair.
The indicator gives you the OPEN HIGH LOW CLOSE and 50% bar prices of the current or one of the previous bar.
Parameter setting are: TimeShift: Used for bar selection (0 stand for current 1 for previous 2 for 2 bars ago) Other parameter are using for esthetics. Each Label can be moved away from its initial position.
FEEL FREE TO REPORT BUG AND REVIEW THIS INDICATOR. THANKS
FREE

Backtest from 2003-2019 MetaQuotes Data Every Tick Mode
EA created for EURUSD H1
Open transaction based on MA and Volume
Close transaction based on RSI or take profit
One transaction at the time.
No adding position, no martingale, no grid.
My recommendations: For "safe mode" i recommend 0.1 lot per 10000USD
For "risky mode" i recommend 0.5 lot per 10000USD
Personally i use 0.3 lot per 10000 USD
Fell free to increase lot size while you earn.
This EA does not open transaction e

Этот мульти-таймфрейм и мультисимвольный индикатор идентифицирует двойную вершину / основание, голову и плечо, вымпел / треугольник и образцы флагов. Также можно настроить оповещения только тогда, когда произошел прорыв линии шеи / треугольника / флагштока (прорыв линии шеи = подтвержденный сигнал для вершины / оснований и головы и плеч). Индикатор также можно использовать в режиме одиночного графика. Подробнее об этой опции читайте в разделе продукта. блог . В сочетании с вашими собстве

Walking Pips - это скальперский советник предназначен для работы на волатильном рынке. Подходит для работы с любыми брокерами, включая Американских брокеров с требованием FIFO - закрытия в первую очередь ранее открытых сделок. Все ордера сопровождается виртуальным стоп-лоссом и тейк-профитом в пипсах, а так-же имеются функции безубытка и трейлинг-стопа. На графике выводится информация о скорости исполнения ордеров и проскальзывании. Советник не использует мартингейл или сетку. Работа советника н

В своей работе советник использует пробойную стратегию при открытии всех без исключения сделок. Торговля ведется исключительно отложенными ордерами. Точки входа располагаются на локальных минимумах и максимумах, при этом внутренним фильтром советника некоторые уровни исключаются. Максимальное количество ордеров устанавливается в настройках. Советник автоматически определяет количество знаков в котировках, поэтому пользователю не надо думать об этом и вносить соответствующие изменения в настройк
Советник работает только на НЕTТИНГОВЫХ СЧЕТАХ !
Торговый советник " FuturesBot NQ100 " предназначен только и исключительно для торговли фьючерсами на бирже CME Group
Советник адаптирован для торговли фьючерсными контрактами : - E-mini Nasdaq-100 Futures - micro E-mini Nasdaq-100 Future
Спецификация контракта E-mini Nasdaq-100 Future доступна по следующей ссылке на сайте биржи:
https://www.cmegroup.com/trading/equity-index/us-index/e-mini-nasdaq-100_contract_specific

Indicador Taurus All4 Taurus All4
O Taurus All4 é um indicador de alto desempenho, que indica a força da tendência e você pode observar a força da vela. Nosso indicador tem mais de 4 confirmações de tendência.
É muito simples e fácil de usar.
Modos de confirmação Confirmações de tendências de velas: Quando a vela muda para verde claro, a tendência é alta. Quando a vela muda para vermelho, a tendência está voltando para baixo. Quando a vela muda para vermelho escuro, a tendência é baixa.

Индикатор горизонтальных объемов ( Horizontal Volumes ) - отражает с помощью гистограммы, объем заключенных сделок по определенной цене без привязки за временем. При этом гистограмма появляется непосредственно в окне терминала, а каждый столбик объема легко сопоставить со значением котировки валютной пары. Индикатор практически не требует изменения настроек, а при желании с ними может разобраться любой трейдер.
Объемы заключенных сделок имеют большое значение в биржевой торговле, обычно увели

Go Depth of Market This product helps to watch the order book in a easily and friendly way, helping traders to take decisions that are more consistent with the timing of the market.
Parameters: Activating EA (robot) mode if you leave true it will become a robot, if you leave false it will become an indicator. Initial volume VolumeDynamic if you leave it enabled will be automatic batch Proportion: Example: If you put 500 every 500 $ it will open a lot of 1.0 Takeprofit Stoploss Daily p
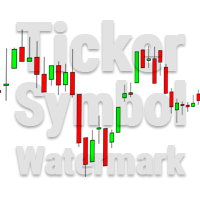
This utility tool draws the ticker symbol and timeframe information as a watermark in the background of the chart. It may come in handy if you have multiple charts on the screen at the same time. Inputs: Font Name: You can change text font by typing in the name of your favorite font installed on your operating system. (e.g.: Verdana, Palatino Linotype, Roboto, etc...) Font Color: You can choose your favorite from the available colors or type in a custom RGB color (values from 0 to 255, e.g.:

Free version of https://www.mql5.com/en/market/product/44815 Simple indicator to calculate profit on fibonacci retracement levels with fixed lot size, or calculate lot size on fibonacci levels with fixed profit. Add to chart and move trend line to set the fibonacci retracement levels. Works similar as default fibonacci retracement line study in Metatrader. Inputs Fixed - select what value will be fix, lot or profit (available in full version, lot is set on free version) Fixed value - value tha
FREE

*Non-Repainting Indicator Arrow Indicator with Push Notification based on the Synthethic Savages strategy for synthethic indices on binary broker.
Signals will only fire when the Synthethic Savages Strategy Criteria is met BUT MUST be filtered.
Best Signals on Fresh Alerts after our Savage EMA's Cross. Synthethic Savage Alerts is an indicator that shows entry signals with the trend. A great tool to add to any chart. Best Signals occur on Fresh Alerts after our Savage EMA's Cross + Signal

mql4 version: https://www.mql5.com/en/market/product/44606 Simple indicator to calculate profit on fibonacci retracement levels with fixed lot size, or calculate lot size on fibonacci levels with fixed profit. Add to chart and move trend line to set the fibonacci retracement levels. Works similar as default fibonacci retracement line study in Metatrader. Inputs Fixed - select what value will be fix, lot or profit Fixed value - value that will be fix on all levels Levels - levels for which

The Candlestick Patterns indicator for MT5 includes 12 types of candlestick signales in only one indicator. - DoubleTopsAndBottoms - SmallerGettingBars - BiggerGettingBars - ThreeBarsPlay - TwoBarsStrike - Hammers - InsideBars - OutsideBars - LongCandles
- TwoGreenTwoRed Candles - ThreeGreenThreeRed Candles The indicator creats a arrow above or under the signal candle and a little character inside the candle to display the type of the signal. For long candles the indicator can display the exac
This indicator measures the largest distance between a price (high or low) and a moving average. It also shows the average distance above and below the moving average. It may come in handy for strategies that open reverse positions as price moves away from a moving average within a certain range, awaiting it to return so the position can be closed. It just works on any symbol and timeframe. Parameters: Moving average period : Period for moving average calculation. Moving average method : You can

Versão Darkray para Bolsa de Valores (Ações, Fundos Imobilirários, contratos futuros, etc.) O Robô DarkrayB3EA usa uma estratégia baseada no retorno a média, conjugada a detecção de zonas de exaustão de compra e de venda. Indicadores disponíveis para configurações de setups: EMA200 à Média móvel de 200 períodos (podem ser usados outros períodos com ótimos resultados também); RSI à Verifica os níveis de sobre venda para abertura das vendas e sobre compra para abertura das compras; ADX à Veri

This incicator shows you when a pin bar is formed, and aid you perform a inversion strategy or a trend continuation based on resistence support and or channel. Typically a pin bar shows you a price rejection from the market and the signal most of time is profitable. So i suggest to use buy/sell limit order over ratrace SL little bit over or below bar and take profit based on your strategy and money management.
Best timeframe are D H4 H1

Сочетание тренда и пробоя уровней в одной системе. Продвинутый алгоритм индикатора фильтрует рыночный шум, определяет тренд, точки входа, а также возможные уровни выхода из позиции. Сигналы индикатора записываются в статистический модуль, который позволяет выбирать наиболее подходящие инструменты, показывая эффективность истории сигналов. Индикатор рассчитывает отметки ТейкПрофитов и стоплосса. Руководство пользователя -> ЗДЕСЬ / MT4 версия -> ЗДЕСЬ Как торговать с индикатором: Торговля с Tr

Искусство Forex - это новый сложный советник, который непрерывно торгует в обоих направлениях. Серия ордеров будет открываться для получения наилучшей средней цены до тех пор, пока не будет достигнут тейк-профит. Это оптимальный вариант для получения прибыли на непредсказуемом рынке. Встроенная система покрытия убытков позволяет восстанавливать ордера, которые слишком удалены от текущей цены. The best results are on EUR/USD H1 but you can use it on any forex pair and timeframe . Liv

Night Scalper - это скальперская система для работы на спокойном рынке в ночное время суток. Не использует мартингейл или сетку. Подходит для всех брокеров, в том числе американских брокеров с правилами FIFO. Все ордера сопровождаются виртуальным стоп-лоссом и тейк-профитом в пипсах, значения могут быть как фиксированные так и динамические. Так-же имеет виртуальный трейлинг стоп и безубыток. На графике выводится информация о скорости исполнения ордеров и проскальзывании.
MT4 версия ссылка В со

KT CCI Divergence robot is a 100% automated expert advisor that trades regular and hidden divergence built between the price and Commodity Channel Index (CCI) oscillator. The divergence signals are fetched from our freely available CCI divergence indicator.
Not every divergence ends up in a successful price reversal, that is why this ea combines the raw divergences signals with its inbuilt technical analysis module to exploit the price inefficiency that occurs after some selected divergence s

Мощный трендовый индикатор, снабженный всем необходимым для торговли и при этом очень прост в использовании. Могу поспорить, что вы сталкивались с индикатором или советником, содержащим множество входных параметров и сложных инструкций. Индикатор полностью оправдывает свое название: входные параметры интуитивно просты и подбирать ничего не нужно — за вас все сделает нейронная сеть.
Отличия от классической версии
Добавлена мультитаймфреймовая панель, чтобы вы могли проверять тренд на других та

Представленая экспертная система работает с валютной парой EURUSD и только с ней . Данная система реализовала в себе принцип пяти ордеров - то есть в одном направлении может быть сделано максимум пять ордеров, после чего суммарная позиция серии должна быть закрыта стопами, или реальными или виртуальными. Торговая система разработана таким образом, чтобы работать отдельно с серией ордеров на buy и отдельно с серией ордеров на sell. что делает торговую систему достаточно универсальной. Эксперт п

The Rise of Sky walker is a trend indicator is a powerful indicator for any par and any timeframe. It doesn't requires any additional indicators for the trading setup.The indicator gives clear signals about opening and closing trades.This Indicator is a unique, high quality and affordable trading tool. Can be used in combination with other indicators Perfect For New Traders And Expert Traders Low risk entries. Never repaints signal. Never backpaints signal. Never recalculates signal. Great Fo

KT RSI Divergence robot is a 100% automated expert advisor that trades regular and hidden divergence built between the price and Relative Strength Index (RSI) oscillator. The divergence signals are fetched from our freely available RSI divergence indicator.
Not every divergence ends up in a successful price reversal, that's why this ea combines the raw divergences signals with its inbuilt technical analysis module to exploit the price inefficiency that occurs after some selected divergence si

KT Stochastic Divergence robot is a 100% automated expert advisor that trades regular and hidden divergence built between the price and Stochastic oscillator. The divergence signals are fetched from our freely available Stochastic Divergence indicator.
Not every divergence ends up in a successful price reversal, that's why this ea combines the raw divergences signals with its inbuilt technical analysis module to exploit the price inefficiency that occurs after some selected divergence signals

Экспертная система Trend Catchers работает на любых типах счетов, как неттинг так и хеджинг. Элементарной единицей анализа является тик, а не бар. Работает с 5-значными котировками. Критическими являются реквоты, необходим брокер с минимальными задержками исполнения.
Экспертная система закачивает исторические данные онлайн, создавая собственную базу данных, хранящуюся в оперативной памяти. При перезагрузке она теряется и при новой загрузке ее необходимо загружать снова. Чтобы добиться хороших

KT Power Pennant finds and marks the famous pennant pattern on the chart. A pennant is a trend continuation pattern with a significant price movement in one direction, followed by a period of consolidation with converging trend-lines.
Once a pennant pattern is formed, a buy/sell signal is provided using a bullish or bearish breakout after the pattern formation. MT4 Version is available here https://www.mql5.com/en/market/product/44713
Features
Pennant patterns provide a low-risk entry aft

Индикатор тренда Carina . Реализация индикатора тренда простая - в виде линий двух цветов. В оаснове алгоритма индикатора лежат стандартные индикаторы а также собственные математические расчеты. Индикатор поможет пользователям определиться с направлением тренда. Также станет незаменимым советчиком для входа в рынок или для закрытия позиции. Этот индикатор рекомендуется для всех, как для новичков так и для профессионалов.
Как трактовать информацию от индикатора. Покупаем, когда происходит смен

The ShowSessions indicator for MT5 shows up to two, self-selected, time intervals, for a free choosen number of days past and a few future days. Weekends are marked with an additional red vertical line. The indicator makes manuel backtesting of strategies more easily, but you can use ist for daily trading as well. Please note that the server time does not always correspond to the actual time.
FREE

Real $1000 depoit. DD is below 10%. Low risk trading. Average profit 15% to 25% Experience the new ultimate trading. This is a news Expert Advisor trading by the economic calendar. Automated Trading – the EA takes the news release time and its importance from the news website. Manual Trading– trader sets the news time on its own To let the EA work automatically, do the following: In the terminal, open Tools ---> Options ---> Expert Advisors ---> add " http://ec.forexprostoolscom " to the "Allow

RageX EA is an unique fully automated EA which analyses current market trend on time-frame basis. Thanks to that it makes performance of this EA stable regardless the current market condition like slippage, execution speed, etc. Every order is protected by automatically calculated stop-loss. RageX EA successfully passed 100% quality data back-tests in Metatrader 5 with different execution speed as well as back-tests with 99.90% quality historical data and variable spread in Metatrader 4. Link
This app supports customer investments with equipment financing and leasing solutions as well with structured chat Our success is built on a unique combination of risk competence, technological expertise and reliable financial resources.
Following topics are covered in the Trading Support Chat -CUSTOMISATION -WORKFLOW -CHARTING TIPS -TRADE ANALYSIS
PLEASE NOTE That when the market is closed, several Brokers/Metatrader servers do not update ticks from other timeframes apart from the current

Советник использует стратегию основанную на использовании пользовательских индикаторов, торговля осуществляется на 4 таймфреймах.
Эксперт использует для торговли адаптивную систему определения входов в рынок которые определяет наиболее правильный момент для открытия ордера. Советник торгует по многочисленным закономерностям на валютных пар. Советник использует экономические новости для достижения более точных сигналов. Используется скрытый Стоп лосс, Тейк профит, Безубыток и Трейлинг стоп. Исп
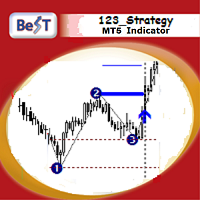
BeST_123 Strategy is clearly based on the 123 Pattern which is a frequent Reversal Chart Pattern of a very high Success Ratio .It occurs at the end of trends and swings and it’s a serious indication of high probability for a change in trend.Theoretically an 123_pattern is valid when the price closes beyond the level of #2 local top/bottom, a moment when the indicator draws an Entry Arrow, raises an Alert, and a corresponding Position can be opened.
The BeST 123_Strategy Indicator is non-repai
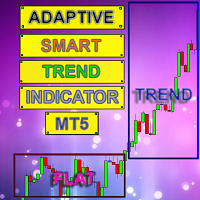
Интеллектуальный индикатор Adaptive Smart Trend Indicator определяет секторы Тренда и Флета и также в виде гистограммы показывает точки пробоя уровней (1 - 5).
Индикатор проводит множество математических вычислений для отображения на графике более оптимальных Трендовых движения.
Программа содержит два индикатора в одном: 1 - рисует секторы Тренда и Флета, 2 - индикатор гистограмма показывает наиболее хорошие сигналы для открытия ордера. Индикатор автономно вычисляет наиболее

Пересечение рыночной цены и скользящей средней со всеми видами предупреждений и возможностями улучшения визуализации на графике.
Возможности Пересечение рыночной цены и скользящей средней на текущем баре или на закрытии последнего бара; Может пропускать однотипные сигналы, идущие один за другим, и после сигнала на продажу отображать только сигнал на покупку и наоборот; Для скользящей средней можно настроить способы усреднения: простое скользящее среднее (SMA), экспоненциальное скользящее сред

- это индикатор направленного движения, позволяющий определять тренд в момент его зарождения и задавать уровни защитного стопа. Трейлинг может осуществляться как снизу, когда уровень стопа ниже текущей цены и подтягивается за ценой, если она возрастает, так и сверху, когда уровни стопа выше текущей цены. В отличие от трейлинга с постоянной дистанцией уровень стопа устанавливается на нижней границе канала квадратичной регрессии (в случае трейлинга снизу). При трейлинге сверху стоп расположен н
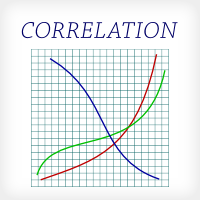
This indicator is fully user-adjustable, calculates corellation between all symbols, which you want. Indicator is real-time updated and fully automated. You can adjust a lot of parameters.
Calculation Parameters List of symbols: write all symbol, which you want to calculate, just separate them by comma Calculated bars: amount of bars from which will be calculated Time frame: time period of calculation Used price: used price - 0 (CLOSE), 1 (OPEN), 2 (HIGH), 3 (LOW), 4 (MEDIAN), 5 (TYPICAL), 6

The Breakout Box for MT5 is a (opening) range breakout Indicator with freely adjustable: - time ranges - end of drawing time - take profit levels by percent of the range size - colors - font sizes It can not only display the range of the current day, but also for any number of days past. It can be used for any instrument. It displays the range size and by request the range levels and the levels of the take profit niveaus too. By request it shows a countdown with time to finish range. The indic

Goliath MT5 - scalper fully automated Expert Advisor for medium-volatile forex markets
P roperties: The Library trades 10 currency pairs (USDCHF, EURCHF, EURGBP, AUDUSD, USDCAD, GBPUSD, EURUSD, NZDUSD, CADCHF, EURAUD, EURCAD, AUDJPY) The Library does not use martingale The Library sets a fixed stop loss and take profit for all orders The Library only trades a user input volume The Library can be installed on any currency pair and any timeframe Recommendations: Before using on a real account,

Эксперт создан для разгона депозита за короткий период времени. Для входа в рынок в эксперте используются точные сигналы в направлении тренда. В паре с авторским критерием оптимизации эксперт позволяет подобрать оптимальные настройки для разгона вашего депозита. Эксперт работает на 4 таймфреймах, что увеличивает точность сигналов. Иногда таймфреймов может быть 3. Внимание! Как известно, на рынке Форекс депозит Трейдера подвергается риску. Особенно, следует учитывать это при его разгоне. Рекоменд
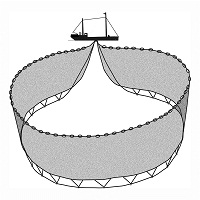
Полностью автоматизированный торговый робот. Не использует индикаторы, постоянно рынке. Для принятия торговых решений анализирует действующие открытые позиции. Мартингейла нет, увеличение торговых лотов нет. Описание настроек Count_All - количество позиций для общей прибыли Lot - объем позиций, при =0 работает параметр Risk Risk - автоматический расчет лота от баланса торгового счета TakeProfit - уровень прибыли одинарной позиции Steps - шаг между позициями ProfitTarget - общая прибыль для настр

A Swing Failure Pattern ( SFP ) is a trade setup in which big traders hunt stop-losses above a key swing high or below a key swing low for the purpose of generating the liquidity needed to push price in the opposite direction. When price 1) pierces above a key swing high but then 2) closes back below that swing high, we have a potential bearish SFP . Bearish SFPs offer opportunities for short trades. When price 1) dumps below a key swing low but then 2) closes back above that swing low, we have

This indicator examines the price structure of fractals of different periods to determine possible reversal points in the market, providing timing to positional traders that already have a fundamental or technical valuation model. Unlike its younger brother, Reversal Fractals , this indicator won't miss reversals because of the period selected, and will find reversal fractals on a zig-zag fashion, ignoring those reversals which do not carry enough momentum to start a sustained price movement. [

Every trader knows that he or she should never Risk more than 2% (or 5%) per trade. This is a Money Management law and an usable LotSize should be calculated each time because a trader must use a different StopLoss value for different Support and Resistant level. This indicator will calculate an appropriate LotSize for the moment when you will put it on the chart and each time you will drag the "Stop Loss Line" in any direction.
Inputs: Order_Type - Buy or Sell TakeProfitPoints - how many p

Based on Brazilian trader André Moraes' Difusor de Fluxo theory, the indicator is a more reliable version of the original MACD. It is a great confirmation indicator for Swing Trading and also can be used as a Day Trading tool. If you are not familiar with the concept or André's trading strategies, I strongly recommend his excelent book named "Se Afastando da Manada" in which he explains in detail how this indicator is used. Even if you don't know the Portuguese language it is not difficult to un
FREE
Simple utility to calculate margin and financial value according to the number of lots and points informed by the user.
This is a product developed by the Renato Fiche Junior and available to all MetaTrader 5 users!
Partners: "Águia Traders" team ( Eagle Traders ) by Larissa Sihle #aguiatraders #larissasihle
Input Parameters
- Balance : Account balance. The margin percentage will be calculated based on the balance informed by the user.
FREE

Индикатор автоматически строит на графике уровни (зоны) поддержки и сопротивления с разных таймфреймов.
Уровни поддержки-сопротивления – это горизонтальные линии. Как правило, рынок реагирует не на конкретный уровень цены, а на диапазон цен вокруг уровня, т.к. спрос и предложение участников рынка формируются не четко на линии, а “размазаны” на некотором расстоянии от уровня
Индикатор определяет и рисует именно такой диапазон цен, в пределах которого формируются сильные позиции на продажу и п

RSI Swinger
Do you want to maximize your trading profits while minimizing your risk exposure and time spent analyzing technical indicators? The RSI Swinger Expert Advisor is the perfect solution for you. By relying on the powerful RSI indicator to identify price swings, this fully customizable EA can help you achieve your trading goals in a risk-averse manner, even if you're not a technical analysis expert. With the RSI Swinger, you can easily configure the RSI ceiling and floor values to suit

Виртуальное (скрытое от брокера) выставление трейлинг-стопа, безубытка, стоп-лосса и тейк-профита. Необходимо разрешить автоматическую торговлю в настройках терминала. В режиме тестирования утилита на первых тиках открывает позиции Buy или Sell, что позволяет в визуальном режиме наблюдать заданную логику, меняя параметры утилиты. В реальном режиме утилита не открывает позиции. Параметры magic - магический номер. Если меньше 0, то сопровождаются позиции с любым магическим числом; only_this_symb

Сопровождение позиций с помощью: трейлинг-стопа, безубытка, стоп-лосса и тейк-профита. Необходимо разрешить автоматическую торговлю в настройках терминала. В режиме тестирования утилита на первых тиках открывает позиции Buy или Sell, что позволяет в визуальном режиме наблюдать заданную логику, меняя параметры утилиты. В реальном режиме утилита не открывает позиции. Параметры magic - магический номер. Если меньше 0, то сопровождаются позиции с любым магическим числом; only_this_symbol - только

Основа стратегии - выявление быстрых коррекционных движений между кроссами рабочей валютной пары или металла. В моменты расхождений цен торговых инструментов советник анализирует возможное направление движения цены на рабочем инструменте и начинает работу.
Каждая позиция имеет стоп-лосс и тейк-профит.
Уникальный алгоритм сопровождения позиций позволяет контролировать превосходство профита над убытком.
Советник не использует опасные методы торговли. Версия советника для МТ4: https://www.
MetaTrader Маркет предлагает каждому разработчику торговых программ простую и удобную площадку для их продажи.
Мы поможем вам с оформлением и подскажем, как подготовить описание продукта для Маркета. Все продаваемые через Маркет программы защищаются дополнительным шифрованием и могут запускаться только на компьютере покупателя. Незаконное копирование исключено.
Вы упускаете торговые возможности:
- Бесплатные приложения для трейдинга
- 8 000+ сигналов для копирования
- Экономические новости для анализа финансовых рынков
Регистрация
Вход
Если у вас нет учетной записи, зарегистрируйтесь
Для авторизации и пользования сайтом MQL5.com необходимо разрешить использование файлов Сookie.
Пожалуйста, включите в вашем браузере данную настройку, иначе вы не сможете авторизоваться.