Смотри обучающее видео по маркету на YouTube
Как купить торгового робота или индикатор
Запусти робота на
виртуальном хостинге
виртуальном хостинге
Протестируй индикатор/робота перед покупкой
Хочешь зарабатывать в Маркете?
Как подать продукт, чтобы его покупали
Технические индикаторы для MetaTrader 5 - 69
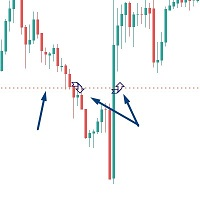
Introductory Offer! *** Only $47 - normal price $97 !! *** Ends soon - don't miis it!! The Close Above or Below Price Indicator is part of my suite of Price and Trendline Alerts Indicators. I'm excited to introduce the Close Above or Below Price Indicator – part of my new suite of Price and Trendline Alert Indicators – fantastic tools designed to alert you when candles close above or below significant prices in the markets you trade. With this indicator, you can set up to 4 price alerts on a
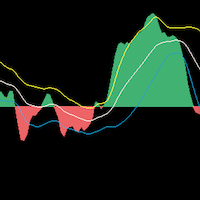
TradingDirection是一个针对中长线交易的趋势指标。在图上你能很清晰的看到什么时候是上涨趋势,什么时候是下跌趋势,同时在趋势中,你能看到很明显的补仓位置和减仓位置。同时它与 BestPointOfInitiation( https://www.mql5.com/zh/market/product/96671 )指标可以形成完美的配合,两个指标相互配合更能很好的把握开单时机。 ===================参数列表===================== fastPeriod: 9 slowPeriod:30 PassivationCoefficient:5 =================参考使用方法=================== 此指标可以适用于任何交易品种,能够用在任何周期。
Please send me Direct message on MQL5 CHAT after purchasing the Indicator for Training and Installation Support There are some additional files that is important to use with the Indicator . So be sure to contact me after purchasing the Indicator So that I can add you for training and support .
If you find any difficulty with installation then send me Direct message here So that I can connect with you via Anydesk or Teamview for the product installation. " Smart Order Block Indicator " to find
This is a modern MACD indicator based on regular MACD indicator. It also has alert system included. This indicator gives you alerts when base line of MACD indicator crosses above or below Zero level so you can look for Buy or Sell opportunity. Available Alerts: 1. Audible Alerts on Chart / Trading Terminal window. 2. Alerts on your email. 3. Alerts on your mobile phone. Type of Alerts Explained: 1. Audible_Chart_Alerts - Audible alerts and Popup message on your computer’s tr

An indicator based on support and resistance levels with many signals (per candle) Can be used in all time frames Can be used in all symbol Blue lines: upward trend. Red lines: downward trend
How It work: This indicator gives signals based on support and resistance levels as well as some complex calculations. Based on past data
As you know, one of the most important trade options are support and resistance levels.
Get good signals using this indicator.
How To work: Run the indicator.

ShortBS是一个很好的短线交易指示器,能很好与 BestPointOfInitiation ( https://www.mql5.com/zh/market/product/96671 )配合,能让你找到最合适的buy和sell位置,指标不含有未来函数,不会重新绘制。是一个针对(如果你感觉到这个指标能够帮助你进行更准确的交易,请帮忙给个好评,希望我的作品能够帮助更多有需要的人) ===================参数列表===================== maPeriod: 25 slowPeriod:20 fastPeriod:10 stepPeriod:5 =================参考使用方法=================== 此指标可以适用于任何交易品种,能够用在任何周期。
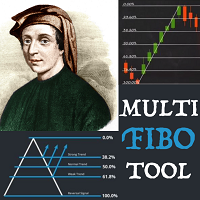
Multi Fibonacci Tool for MT5. User can set up to 5 different Fibonacci Retracements. Save & Load.
Simple settings. Style, line width, colors. Available ray function for all.
Application creates simple and functional panel on the chart (5 buttons for 5 Fibo retracements and DEL button to clear chart from drawn retracements).
Position Point and Range inputs allow to place Fibonacci retracements in the right place on the chart.

You can change the time period of the chart at the touch of a button. You can also change multiple charts at the touch of a button. You can also change multiple charts at the touch of a button, saving you the trouble of changing time periods.
We are live-streaming the actual operation of the system. Please check for yourself if it is usable. Please check it out for yourself. https://www.youtube.com/@ganesha_forex
We do not guarantee your investment results. Investments should be made at y
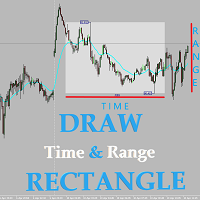
This useful tool helps to draw rectangle - range of price between two points of time for many days. For all trading instruments.
User set start time (Start Hour, Start Min), end time (End Hour, End Min) and number of days to draw a rectangle. Indicator draw a rectangle marking highest and lowest price in set period of time. Below the rectangle it shows range between MAXprice and MINprice in pp.
This tool is almost irreplaceable when you play strategy based on overnight price move (for example

Horizontal tick volumes (HTV)
Горизонтальные тиковые объемы - легкий и удобный индикатор горизонтального профиля рынка в выбранном пользователем интервале времени, теперь и для MT5.
Имеет быструю динамику отображения горизонтальных тиковых объемов на графике. Производит наглядное изображение сильных торговых уровней по максимальным пикам
прошедших объемов и направления торговли по цвету (продажи или покупки), а также позволяет обнаружить более мелкие торговые уровни с помощью дифференциац
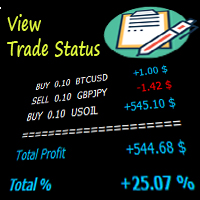
This indicator will help you have a better visualization of the status of your open trades. You can see profits or losses in USD or %, as well as a total of all trades and the percentage of profit or loss according to your account size. You can change the font size and color. I hope you find it useful and it makes monitoring your trades easier. This indicator adjusts to the size of your screen and will be positioned in the bottom right corner of your screen for better convenience.
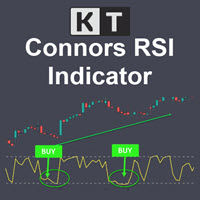
KT Connors RSI is a modified and more advanced version of the original Connors RSI developed by Larry Connors. It was designed to help traders generate trade signals based on short-term price movements.
The Connors combine the standard RSI calculation with two additional elements: a short-term RSI, ROC, and a moving average.
Features Provides more transparent and more actionable buy and sell signals using the overbought/oversold zones. Incorporates short-term RSI and moving average, provid

AutoScroll automatically scrolls the chart by the set width (pips). You can see the next milestone without having to operate the chart yourself. You can concentrate on trading.
We are live-streaming the actual operation of the system. Please check for yourself if it is usable. Please check it out for yourself. https://www.youtube.com/@ganesha_forex
We do not guarantee your investment results. Investments should be made at your own risk. We sharll not be liable for any disadvantage or damage

The time until the end of the bar is counted down. Therefore, you can time your order while watching the chart. You can concentrate on your trading.
We are live-streaming the actual operation of the system. Please check for yourself if it is usable. Please check it out for yourself. https://www.youtube.com/@ganesha_forex
We do not guarantee your investment results. Investments should be made at your own risk. We sharll not be liable for any disadvantage or damage caused by the use of the in

Fibonacci automatically draws Fibonacci retracement, Because Fibonacci automatically draws Fibonacci retracement, you can know at a glance the price to buy at a push or sell back. Therefore, you can trade in favorable conditions in a trending market.
We are live-streaming the actual operation of the system. Please check for yourself if it is usable. Please check it out for yourself. https://www.youtube.com/@ganesha_forex
We do not guarantee your investment results. Investments should be mad

The chart pattern is automatically drawn. It also automatically tells you the price at which you are most likely to buy or sell according to the pattern. Therefore, there is no need to memorize patterns or draw lines by yourself.
* The "WhaleFinder" includes four indicators ("DrawTurningPoint", "DrawHurdle", "DrawChartPattern", "DrawFibonacci"). so, Please be careful not to purchase more than one copy (duplicates).
We are live-streaming the actual operation of the system. Please check for

The system automatically draws resistance and support lines, The system automatically draws resistance and support lines, so you can see at a glance the price range where you are most likely to encounter resistance. Therefore, you can trade in price zones where you are less likely to encounter resistance.
We are live-streaming the actual operation of the system. Please check for yourself if it is usable. Please check it out for yourself. https://www.youtube.com/@ganesha_forex
We do not guar

Based on the Dow Theory, the system automatically draws a turning point, which is the starting point for buying or selling. It also automatically tells you whether the market is in a buying or selling condition and recognizes the environment. It is also a good tool to prevent false trades and to make profitable trades.
We are live-streaming the actual operation of the system. Please check for yourself if it is usable. Please check it out for yourself. https://www.youtube.com/@ganesha_forex

The TrendLinePro indicator for MetaTrader 5 creates a trend line based on the last candle highs and lows. The number of candles to be used to determine the direction can be selected yourself. The trend line can also be used to set an SL. Changes in trend directions can optionally be displayed with an arrow. Input Parameters: Number of Candles for Distance: 3 Display Direction Changes Arrows: false

DYJ Super Trend Wave - это высокоточная торговая система пиков и долинов.
Этот индикатор ищет самые высокие и самые низкие точки свечей при входе и выходе из рынка. Входные цены находятся рядом с самой высокой или самой низкой точкой.
Тип уведомления для сигналов был добавлен в dyj supertrend.
При создании многопространственного сигнала,
Можно использовать следующие типы сигналов уведомления: Alert mailSend, MobilePush.
Input
InpSignalPeriod = 10 BarDistance = 24 InpIsAlert = true

Slopes are an increasingly key concept in Technical Analysis. The most basic type is to calculate them on the prices, but also on technical indicators such as moving averages and the RSI.
In technical analysis, you generally use the RSI to detect imminent reversal moves within a range. In the case of the Blue indicator, we are calculating the slope of the market price and then calculating the RSI of that slope in order to detect instances of reversal.
The Blue indicator is therefore used

If you are using naked eyes to find candlestick patterns on your chart it's a good thing but it requires your time and attention and still you miss some patterns here and there. Don't worry! This indicator will help you to find "Harami Candlestick Pattern" on your chart very easily. *Note: Default inputs are set for EURUSD H1 (1 hour) timeframe. This is an alert system which gives you alerts whenever harami candlestick pattern happens. Types of alerts it can give you are: 1. Audible Alerts - Thi

Super Scalp Indicator MT5 is a unique trend reversal 100% non-repainting multi-algo indicator that can be used on all symbols/instruments: forex, commodities, cryptocurrencies, indices, stocks . Super Scalp Indicator MT5 will determine the current trend at its early stages, gathering information and data from up to 10 standard algos When indicator give a valid buy or sell signal, a corresponding arrow will be printed on the chart, open trade at start of the next candle/bar indic
Интеллектуальный индикатор ZigZag. Имеет всего две настройки. Чем выше значения, тем более значимые экстремальные значения показывает. Область применения. Для определения тренда. Направление рисования линии. Для распознавания многочисленных паттернов. Если наложить два индикатора на один график с быстрыми и медленными значениями. Изменив цвет одного из них, то очень хорошо можно разложить движение цены на волны. Индикатор может оказаться отличным помощником для разметки графика и обозначения к
Add an image or logo on a chart. Parameters: "File name for On mode" - location of image file depending MQL5 folder. "Background object" - set the logo as a background object. “x”, “y” – coordinates on the chart, from which the logo shows. If you want to delete the logo, just remove ea from the chart. The suggested resolution for the image is 200x200 pixels. You can use this ea while recording a video.

Повысьте свой опыт торговли с Wamek Trend Consult!
Разблокируйте силу точного входа на рынок с нашим передовым торговым инструментом, разработанным для выявления ранних и продолжающихся трендов. Wamek Trend Consult дает трейдерам возможность войти на рынок в идеальный момент, используя мощные фильтры, которые уменьшают ложные сигналы, повышают точность сделок и, в конечном итоге, увеличивают прибыльность.
Основные характеристики: 1. Точная идентификация тренда: Индикатор Trend Consult испол

Scalper Pivot detects respectable small reversal areas that can be used to mark repeatable opportunity windows. Originally made for M1 timeframe. Setup/inputs: First, set one pip on price, e.g. EURUSD to 0.0001, USDJPY to 0.01, or XAUUSD to 0.1. Set minimum and maximum range on pips, if you want scalp between 10 to 20 pips then set it to 10 and 20 respectively. Set detection window to any candle count you want. Set it too low or too high would be less accurate.
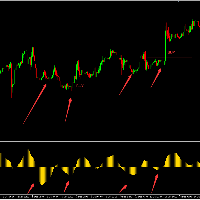
SQZ uses an adaptive algorithm, which can adjust itself well according to the market. If you have studied the introductory model of machine learning, you should understand the linear regression model, which can predict short-term trends very well. Of course, this is only a part of the SQZ indicator. This is an indicator for understanding short-term trend reversals and works very well for tracking triggers. When the price shows HigherHigh and the indicator shows LowerHigh, there is a structural b

[ MT4 Version ] [ Order Blocks ] [ Kill Zones ] [ SMT Divergences ]
ICT Breakers Multi TF
The ICT Breakers Multi TF indicator is currently the most accurate and customizable indicator in the market. It has been designed to give you a strategic edge for trades based on Breaker Blocks and Smart MT. Please note that the UI in the strategy tester may be laggy. However, we assure you that this is only a testing environment issue and that the indicator works perfectly in the real product. The I

Versus USD рассчитывает изменение цены каждой основной валюты по отношению к доллару США и отображает ясное и сравнительное представление их производительности для каждого периода или бара, индексируемого курсором в текущем временном интервале диаграммы с полосами прогресса. Кроме того, он помечает стрелкой бар/период, где данная валюта испытала наибольшее или наименьшее изменение курса по сравнению с другими валютами, тем самым обеспечивая более точную оценку производительности валюты. Доллар С

"Настроения трейдеров" на финансовых рынках это тема, которая нас давно интересует. Со временем мы не смогли найти правильную формулу для определения этих настроения. Мы прошли много этапов в поисках нужной методологии - от взятия данных из внешних источников для расчета открытых позиций покупателей и продавцов до расчета тиковых объемов, но все равно нас не удовлетворили результаты. Расчет открытых позиций покупателей и продавцов из внешних источников имел несколько проблем - это была выборка з
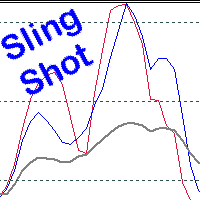
Scalping, Mean reversion or Position trading strategy
Get into an established trend on a pullback in the market. Use the Pinch in the indicator for profit taking. Use the Pinch as a mean reversion strategy, scalping back to a moving average line.
Input Parameters Fast Sling Shot configuration. Slow Sling Shot configuration. Dual Sling Shot configuration. Price line configuration. Trigger zones or levels. Example of Sling Shot trade idea: Price line sets the mood, below the baseline level (5
Введение BreakOut Consult, революционного инструмента, который поднимет ваше торговое мастерство на новый уровень! Наш современный алгоритм комбинирует несколько трендов и осцилляторов для генерации точных сигналов на покупку и продажу, что делает его мощным инструментом для любого трейдера. С BreakOut Consult вы можете легко выявить прорывы на рынке с помощью нашего динамического канала, который использует уровни сопротивления и поддержки для обнаружения прорывов. Наш алгоритм обнаруживает два
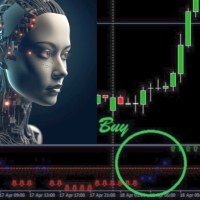
Introducing Trend Fusion 444F, a powerful MQL4 indicator designed to determine market direction using multiple trading indicators. This comprehensive tool offers a unique fusion of technical analysis techniques that help traders make informed decisions in various market conditions. Key Features: Comprehensive Analysis: Trend Fusion 444F combines several widely-used trading indicators to provide a multi-dimensional view of the market. The indicators include Moving Averages, MACD, RSI, DeMarker,

INTRODUCTION The Fib Autotrendline is a basic tool that analysts use to find out when a security's trend is reversing. By determining the support and resistance areas , it helps to identify significant changes in price while filtering out short-term fluctuations, thus eliminating the noise of everyday market conditions. It is an excellent tool for any trader who follows indicators that use swing highs and swing lows . How to Use the fib Auto Trendline Indicator The Fib Auto Trendline

Supply and Demand Indicator + FREE Currency Strength Meter ADD-ON Looking for a powerful tool that can help you identify the most reactive zones in the forex market? Our supply and demand indicator for MetaTrader 4 and 5 is exactly what you need. With its advanced algorithms and real-time analysis, this indicator helps traders of all experience levels make informed trading decisions. The supply and demand indicator is a cutting-edge tool that helps traders identify areas where buyers and sellers
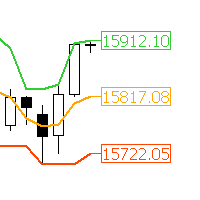
"AV Donchian Channel MT5" is an indicator for MetaTrader 5, which shows the current prices of the donchian channels and the middle line.
Multiple AV Donchian Channel indicators can be placed on one chart. The center line can be used for trailing.
See also Richard Dennis Turtle Trader strategy.
Settings:
- Donchian Channel Period
- Colors and widths of the lines
- Colors and widths of price labels
Please report bugs to me.

Considering the main theories of Forex (Dow Theory, support lines, chart patterns, and Fibonacci retracements), It tells you the price range where whales (large investors) are likely to appear. You can trade at the price points that professionals also aim for. You no longer have to warry about where to aim next.
We are live-streaming the actual operation of the system. Please check for yourself if it is usable. Please check it out for yourself. https://www.youtube.com/@ganesha_forex
We do n

50% Off Today Only! Price Goes Back Up at 11 PM (EST)
uGenesys Volume Indicator: Your Key to Mastering Market Volume Analysis What Traders Are Saying: "A must-have indicator...really a game-changer." – wuzzy66 "Amazing indicator...strongly recommend to beginners." – joinbehar Understanding Market Volume: Volume in the market is a critical indicator of movement and opportunity. The uGenesys Volume Indicator is specially crafted to pinpoint when the market has the most volume, allowing you t

Представляем Auto Trendline, инновационный индикатор MT5, который автоматизирует процесс
рисования линий тренда на ваших графиках. Попрощайтесь с утомительной и трудоемкой задачей ручного рисования линий тренда,
и пусть Auto Trendline сделает всю работу за вас!
*Свяжитесь со мной после покупки, чтобы отправить вам инструкции и пошаговое руководство. Благодаря усовершенствованному алгоритму Auto Trendline автоматически определяет и рисует линии тренда,
экономя ваше время и усилия. Прос

This indicator uses candle stick patterns and moving averages to determine trend , the candle sticks patterns it uses are harami Bull harami Bear Bullish Engulf Bearish Engulf this can both be used to catch trends and also for sculping it has 2 take profits and 2 stop losses which can be turned off if they are not ideal for you. the reward parameter is used to scale the take profit lines , if reward is 2 then the take profit will be 2 times the stoploss the are mobile alerts and terminal alerts

The best instrument for scalping. It allows you to always be correctly positioned in the price. It's a simple and extraordinarily powerful visual reference. Very suitable for price action. It consists of four components. 1. Fork. There are two levels that surround the price and mark the rebound points. They can be varied independently with 4 associated controls, two for each level. Its amplitude is indicated in pips in the indicator data. The minimum fork is updated with each tick. It has
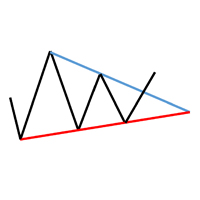
The TrianglesPro indicator for MetaTrader5 draws triangles on the chart based on the local highs and lows. The length of the trendlines can be limited. Optionally, you can display the highs and lows that are used to determine the triangles. It is also possible to determine how far back the identification of triangles should start. Also check out my other indicators.
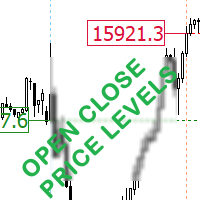
This indicator displays the open and closing price for the selected number of days. Easily identify market open and close Gaps. Select the Day icon to show the open and closing price line. Select the Time icon to show the open and closing hours. Indices and stocks are not a 24hour market as shown on MT5 charts, they open and close at specific times. Marketplace
Time Zone
Trading Hours
New York Stock Exchange (NYSE)
EDT
9:30 a.m. to 4:00 p.m.
Nasdaq Stock Market
EDT
9:30 a.m. to 4
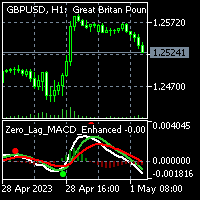
To get access to MT4 version please click here . This is the exact conversion from TradingView: "Zero Lag MACD Enhanced - Version 1.2" by " Albert.Callisto ". This is a light-load processing and non-repaint indicator. All input options are available. Buffers are available for processing in EAs. You can message in private chat for further changes you need. Thanks

The fate of a trade depends on knowing the direction of the price trend. Whatever style you trade, you must know that the direction of the main market trend is in the hands of buyers or sell
YZD Trend indicator helps you to find the main direction by using mathematical parameters and ATR This indicator is a good supplement for your strategy, especially price action, which can reduce your trade losses.
How to use: YZD Trend indicator consists of two ranges in the form of bands, when th

Indicator introduction: A channel and trend line indicator, which is a good tool for manual trading, and also can be used for creating new EAs, without drifting or repainting. It applies to any timeframes and any symbols. The work of the indicator is shown in the screenshots. For any novice and programming trading friend, you can write the signal into the EA to play freely, buffer 0 corresponds to the bold trend line, buffer 4 and 5 respectively corresponds to the channel's upper and lower f
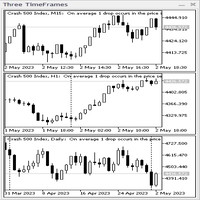
Three TimeFrames indicator-panel. The indicator is made in the form of a panel based on the CAppDialog class. The panel can be minimized or moved around the current chart using the mouse. The indicator shows three timeframes of the current symbol in the panel. In the current version, the indicator has a minimum number of settings - these are the parameters of three timeframes: "Younger timeframe", " Middle timeframe " and " Older timeframe ". When launched, the indicator-panel autom
Schaff trend RSI indicator (It is related with EMA and RSI) It is suited for sub-Indicator to undertand trend(or direction change)
As you can see the screenshot, it's good with Nagaraya-Watson Envelope Indicator (or others) I am using this indicator as Screenshot setting. (Schaff value is default value. 23, 50, 9, close) If you want to get Nagaraya-Watson Envelope, Link: https://www.mql5.com/ko/market/product/97965

The Super Trend is one of the best trend-following indicator for MT5 platforms. It's working fine for real-time trend alerts and accurate signals and it help to identify the best market entry and exit positions. This indicator is the tool you can refers to a trend following overlays. It contains two major parameters: the period and the multiplier. Besides, traders should consider default values that include 10 for every true range aтd 3 for the multiplier. 2 Types TP SL you set in input Point
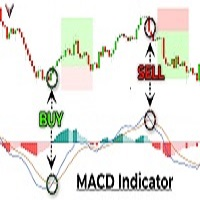
The MACD Gold Scalping Indicator is a powerful tool designed to help traders like you extract profits from the gold market. This indicator is based on the popular Moving Average Convergence Divergence (MACD) indicator, but it's been customized specifically for trading gold. When you use this indicator, you'll be able to quickly identify key entry and exit points in the gold market. It uses a combination of trend analysis, momentum indicators, and support and resistance levels to generate highly

The Off Trend MT5 Forex Indicator is a trend-following tool. Its signals are presented in the cloud. When the cloud is green, the trend momentum is bullish, and traders should take buy opportunities. Conversely, the trend momentum is bearish when the cloud is pink, and traders should take sell opportunities. The Off Trend mt5 Forex Indicator fits all timeframes and mt4 currency pairs.
Introducing our groundbreaking Forex indicator, specifically designed to help traders master the art of identifying critical support and resistance zones, as well as double top and double bottom patterns with unprecedented accuracy. Say goodbye to guesswork and hello to a powerful tool that will revolutionize your trading experience. Our proprietary indicator leverages cutting-edge technology to recognize key price levels where buying and selling pressures are poised to shift the market dynamics

This MT5 version indicator is a unique, high quality and affordable trading tool. The calculation is made according to the author's formula for the beginning of a possible trend. MT4 version is here https://www.mql5.com/ru/market/product/98041 An accurate MT5 indicator that gives signals to enter trades without redrawing!
Ideal trade entry points for currencies, cryptocurrencies, metals, stocks, indices! The indicator builds buy/sell arrows and generates an alert. Use the standart
Индикатор Detector Fix.
Валютные пары никогда не растут и не падают по прямой. Их подъемы и падения перемежаются откатами и разворотами. Каждый рост и каждое падение отражается и на вашем эмоциональном состоянии: надежда сменяется страхом, а когда он проходит, снова появляется надежда. Рынок использует ваш страх для того, чтобы не дать вам воспользоваться сильной позицией. В такие моменты вы наиболее уязвимы.
Все изменится, если вы будете использовать индикатор Detector Fix.
Индикатор De
--- StudentK RVI --- 1. Advanced strategy based on RVI 2. EA adapted (especially for StudentK's EA)
--- Context --- StudentK is not indicated as a master or K Sir for knowledgeable person who claims for winning all the time. (But lots of traders should know the fact that it is rarely truth, especially in fluctuated period of time)
StudentK is a group of years-experienced traders who want to share amazing tools in Free and Paid versions. Aiming helping people getting out of "The Rat Race" by
--- StudentK CCI --- 1. Advanced strategy based on CCI 2. EA adapted (especially for StudentK's EA)
--- Context --- StudentK is not indicated as a master or K Sir for knowledgeable person who claims for winning all the time. (But lots of traders should know the fact that it is rarely truth, especially in fluctuated period of time)
StudentK is a group of years-experienced traders who want to share amazing tools in Free and Paid versions. Aiming helping people getting out of "The Rat Race" by
--- StudentK MACD --- 1. Advanced strategy based on MACD 2. EA adapted (especially for StudentK's EA)
--- Context --- StudentK is not indicated as a master or K Sir for knowledgeable person who claims for winning all the time. (But lots of traders should know the fact that it is rarely truth, especially in fluctuated period of time)
StudentK is a group of years-experienced traders who want to share amazing tools in Free and Paid versions. Aiming helping people getting out of "The Rat Race"

Основная цель данного индикатора это определение моментов входов и выходов из сделок, поэтому индикатор Trend Factorial отображает только линию тренда и точки входа, т0-есть отображает показывают места входа в рынок.
Несмотря на всю видимую простоту индикатора, внутри у него сложные аналитические алгоритмы, при помощи которых система определяет моменты входов.
Индикатор дает точные и своевременные сигналы на вход и на выход из сделки, которые появляются на текущей свече.
Пользоваться инд
Based on data from the Bank for International Settlements, 78.8% of the world's major 8 currency pairs can be checked instantly. It tells you whether the U.S. dollar is being bought or sold in a matter of seconds. So, even in the fast-moving phase after the release of economic indicators, you can see the flow and pushes of the U.S. dollar,
We are live-streaming the actual operation of the system. Please check for yourself if it is usable. Please check it out for yourself. https://www.youtube.
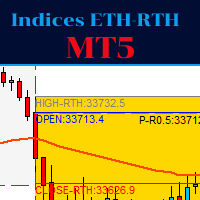
This indicator is for trading indices.
The RTH sessions (regular trading hours) where the underlying cash market is open are distinguished from ETH: for example for the American indices from 9:30 to 16:15 East Coast (New York) time, while for the Dax from 09:00 to 17:35 CET.
For the ETH session (outside RTH) the Fibonacci levels are plotted, as well as sensitive levels such as 25,50,75% retracement from the minimums and maximums.
Also for the RTH session the Fibonacci levels are graphed,
JPYTraderSR is a simple support and resistance indicator with Fibonacci retracement and extension levels added to provide even more trade signal confluence. It provides extra confirmations by indicating support and resistance levels shaping the market structure at any given time, in relation to harmonic trade concepts facilitated by Fibonacci ratios. The JPYTrader Expert Advisor (v1.0) utilizes an older version of this indicator (v1.0), which in turn leads to fairly accurate price action retrace

Market Viewer gives a quick glance on correlation and direction. This indicator takes a list of symbols (max 8) Leave a symbol setting empty if you wish not to use that many - like in the defaults… It will check for each timeframe (Monthly, Weekly, Daily, H4, H1, 30min, 15min, 5min and 1min) if the current candle on that timeframe is bullish or bearish. This will give a good indication of the direction for us to trade in. We need to be in sync with the bigger timeframes.

Introducing the POWER TRADE indicator created by a small group of traders with a few years trading trading the financial market profitably . This is a plug and play indicator that provides you with POWERFUL Entry signals with Profit Taking and rebound zones. The indicator Works with all MT5 trading instruments. The indicator uses previous chart data as receipt to speculate on future market moves.

Внимание! Перед тем как приступить к использованию нашего продукта, важно внимательно ознакомиться с данной дисклеймером на английском языке. Наш продукт предназначен для технического анализа рынка и предоставляет информацию о потенциальных тенденциях и движениях цены. Однако, нельзя гарантировать получение прибыли или определенных результатов торговли. Торговля на финансовых рынках несет риски, и мы не несем ответственности за возможные потери. Всю дополнительную информацию можно найти в англоя
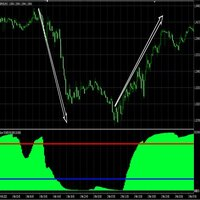
Absolute High Low indicator is a discretionary tool for assessing extremes in the price. It is very self-explanatory, and you can test against other default oscillators to see the difference. Combine with your trend following systems to master entry and exit at extremes. Back test and study the indicator to see the results up against a system or indicator. The indicator calculates a number of max bars so a gap will appear at the end, and it will restart. MT4 Version: https://www.mql5.com/e
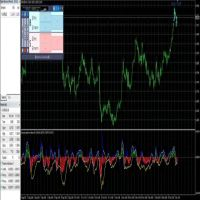
This is a predictive indicator ( leading indicator ) that uses Bayes' formula to calculate the conditional probability of price increases given the angular coefficient. The indicator calculates the angular coefficient and its regression and uses it to predict prices.
Bayes' theorem is a fundamental result of probability theory and is used to calculate the probability of a cause causing the verified event. In other words, for our indicator, Bayes' theorem is used to calculate the conditional pr

Индикатор Visual Volatility Clustering кластеризирует рынок на основе волатильности. Индикатор не перерисовывает и дает точные данные, не использует цены закрытия. Использует цены открытия или цены максимумов или минимумов но предыдущего завершенного бара. Поэтому вся информация будет четкой и однозначной. Суть индикатора – разделить рынок цены на определенные участки по схожему типу волатильности. Это можно делать как угодно. В данном примере индикатор сконфигурирован на временной период W

Индикатор Visual Volatility Clustering кластеризирует рынок на основе волатильности. Индикатор не перерисовывает и дает точные данные, не использует цены закрытия. Использует цены открытия или цены максимумов или минимумов но предыдущего завершенного бара. Поэтому вся информация будет четкой и однозначной. Суть индикатора – разделить рынок цены на определенные участки по схожему типу волатильности. Это можно делать как угодно. В данном примере индикатор сконфигурирован на временной период W

Это индикатор немедленного разворота, мощный инструмент, призванный помочь трейдерам и инвесторам быстро и эффективно определять точки разворота тренда на финансовом рынке.
Описание индикатора: Наш индикатор немедленного разворота представляет собой стрелку, основанную на сочетании технического анализа и передовых алгоритмов, которая направлена на определение моментов, когда рыночный тренд вот-вот развернется, может использоваться на всех таймфреймах, может настроить отправку оповещения, ко
MetaTrader Маркет - лучшее место для продажи торговых роботов и технических индикаторов.
Вам необходимо только написать востребованную программу для платформы MetaTrader, красиво оформить и добавить хорошее описание. Мы поможем вам опубликовать продукт в сервисе Маркет, где его могут купить миллионы пользователей MetaTrader. Так что занимайтесь только непосредственно своим делом - пишите программы для автотрейдинга.
Вы упускаете торговые возможности:
- Бесплатные приложения для трейдинга
- 8 000+ сигналов для копирования
- Экономические новости для анализа финансовых рынков
Регистрация
Вход
Если у вас нет учетной записи, зарегистрируйтесь
Для авторизации и пользования сайтом MQL5.com необходимо разрешить использование файлов Сookie.
Пожалуйста, включите в вашем браузере данную настройку, иначе вы не сможете авторизоваться.