Смотри обучающее видео по маркету на YouTube
Как купить торгового робота или индикатор
Запусти робота на
виртуальном хостинге
виртуальном хостинге
Протестируй индикатор/робота перед покупкой
Хочешь зарабатывать в Маркете?
Как подать продукт, чтобы его покупали
Технические индикаторы для MetaTrader 5 - 74

//--- input parameters input ENUM_TIMEFRAMES InpPeriod = PERIOD_D1; // Period input int InpBandsShift = 15; // Shift
Один индикатор, который отображает на значке другие линии закрытия графика свечей произвольного цикла, может эффективно анализировать рыночные тенденции, более эффективно, лаконично и интуитивно понятно. Спасибо за покупку и использование, с лучшими предложениями, пожалуйста, оставьте сообщение в зоне комментариев, я отвечу в первый раз, здесь, чтобы поздр
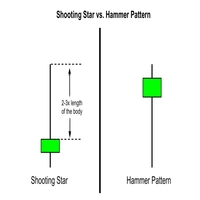
The Candlestick Reversal Alert for MT5 is your ultimate tool for identifying potential trend reversals in the financial markets. This powerful indicator is designed exclusively for MetaTrader 5 (MT5) and is packed with features to help you stay ahead of market movements. Key Features: Customizable Reversal Criteria: Tailor the indicator to your trading style by adjusting parameters such as lower wick size, top wick size, and top wick percentage. Historical Analysis: Specify how many historical c
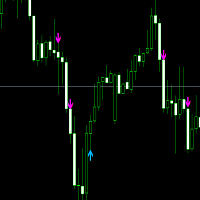
This offer is limited to a temporary period. Entry signal :follow the blue arrow for a buy trade and the Pink for a sell. Buy Trade: When the blue arrow appears, you wait until the candle completely finishes. Then you enter into a Buy Trade as soon as the next candle appears. Now wait until you hit TP1 from the Buy Goals box, then close the trade with a profit. Sell Trade: When the Pink arrow appears, you wait until the candle completely finishes Then you enter into a Buy Trade as soon as the n

Inverted Price Action est un outil financier qui reflète graphiquement les mouvements des prix comme s'ils étaient inversés, ce qui peut aider les traders et les investisseurs à avoir une perspective différente sur les tendances et les mouvements du marché.
Lorsque la souris est positionnée sur l'indicateur, il réagit en modifiant sa couleur pour correspondre à celle du graphique principal, tandis que le graphique sous-jacent est assombri. Cette fonctionnalité peut aider les utilisateurs à se

Cet indicateur technique affiche la tendance du marché ainsi que les niveaux de support et de résistance tracés aux points extrêmes de l'indicateur ZigZag standard. Il classe les formes à cinq points en fonction de l'ordre des points de haut en bas.
Le motif dynamique est basé sur les quatre premiers zigzags droits. Dans cet indicateur, tous les motifs sont considérés comme dynamiques. Pour respecter cette condition, le concept de mutation du marché a été artificiellement introduit et l'algor
The Symbol Changer Indicator is a powerful tool designed to enhance your trading experience by providing quick access to switch between different financial Instruments on your MetaTrader 5 platform. Quickly switch symbols and Show/Hide Buttons. A clean and intuitive graphical interface ensures that traders of all experience levels can use this indicator with ease.

Top indicator for MT5 providing alert and notification for symbols if any price freezes!
Guys, try to buy at least one month version for testing purposes! This indicator displays the current time for multiple Forex pairs and alerts when there's a disconnection between broker and PC time. It'll be very help full for trading platforms administrator who are monitoring hundreds of symbols in a time.
Swing trading is a method in which traders attempt to take advantage of market fluctuations. They buy a security when they believe the market will rise and sell if they feel the market will fall, which, as you can imagine, is common in most trading strategies, irrespective of trading style.
The four most frequently occurring patterns in the swing trading domain are reversal, retracement (or pullback), breakouts, and breakdowns.
FOR MORE INFO Message Us
Work All currency pair,
work all

The ZigZag indicator's main objective is to highlight significant price movements by filtering out minor price fluctuations. It enables the visualization of trends by eliminating market "noise," which can assist traders in making more informed decisions. Adding the Fibonacci indicator, which is a powerful tool for identifying potential support and resistance levels in financial markets.
Уровни кобры
Это 6 наборов уровней с двумя частотными режимами, которые работают на универсальном рынке, включая форекс, криптовалюту, товарный, изящный и банковский. Они публикуются на основе лучших исследований финансовых инструментов.
Верхние уровни называются от U1 до U5, а нижние уровни называются от D1 до D5.
Рынок может двигаться либо по внутренним каналам до U3 или D3 в нормальном состоянии, либо по внешним каналам от U4 до U5 или от D4 до D5 в нестабильном состоянии. Когда цена д

This indicator is based on the RSI indicator
Also, some candlestick patterns are used in it to identify better signals
Can be used in all symbols
Can be used in all time frames
Easy to use method
Adequate settings
Settings: period: The number of candles used to calculate signals. alarmShow: If you want to receive an alert in Metatrader after receiving the signal, enable this setting alarmShowNoti: If you want to receive an alert on your mobile after receiving a signal, enable this sett

Позвольте представить вам новую эру нейронных индикаторов для финансовых рынков! Intelligent Moving это уникальный индикатор, который обучает свою нейросеть в режиме реального времени! Больше не надо искать оптимальные параметры индикатора под каждую конкретную ситуацию. Больше никаких запоздалых сигналов. Искусственный интеллект способен сам подстроиться и прогнозировать любые движения рынка.
Визуально индикатор рисуется в виде основной сплошной скользящей средней линии, двух пунктирных лини

The Jackson Auto Candlestick Pattern . It a powerful price action tool which auto detect and alert a hided powerful candlestick patterns . It came with few different chart skins. You can use this indicator alone to make profit, but it powerful when you combine it with trendlines, You can download The Jackson Auto Trendlines for free Link : UCRW695l9Wgg2ucnnf5DL5Vw List of Candlestick Pattern it detect 1. Bullish & Bearish Engulfing's 2. Top and Bottom Tweezer 3. Bullish and Bearish Harams 4.
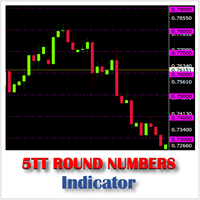
Like Support and Resistance levels, Round Numbers refer to price levels ending in one or more zeros, such as 125.00, 1.0350, 0.8750, 74.50, etc. These are psychological levels where financial institutions and traders expect price to either stall, retrace or breakthrough. On a price chart these figures are generally considered to rule off levels at the 50 and 100 mark. 5TT Round Numbers Indicator makes it absolutely easy for the trader to identify these levels on the chart without the laborious a

Об Индикаторе Proinsta78MT5 Точки показывают сильное направление движения, если точки отсутствуют то движение сменяется или будет торговый коридор с выходом. Прибыль зависит от таймфрейма, чем он больше тем больше можно заработать на движении. Я закрываю в среднем после каждых 150-200 пунктов. Условия для сигнала я показал в виде скриншотов в разделе скриншоты 1-2фото. Также на третьем фото видны сигналы и помечены на графике. По данной ссылке вы найдёте версию индикатора для МТ-4: https://w

Индикатор, построенный на теории Уильяма Ганна, рисует горизонтальные линии на ценах, соответствующие основным углам 360-градусного цикла. Этот индикатор основан на известных теориях Уильяма Ганна, сосредоточиваясь на основных углах, которые считаются сильными уровнями разворота цены. Основные встроенные углы: 30, 45, 60, 90, 120, 180, 220, 270, 310 и 360. Особенности: Настройка угла: пользователи могут добавлять или удалять углы по желанию из списка ввода. Настройка внешнего вида: выберите цвет

Camarilla Pivot Points is a math-based price action analysis tool that generates potential intraday support and resistance levels. Pivot price values are stored in output buffers within this indicator, enabling any Expert Advisor to utilize this indicator's data for trading purposes. This indicator offers the potential for developing numerous strategies. To explore some of these strategies, please visit the following websites: https://www.babypips.com/forexpedia/camarilla-pivot-points https:

Channel Universal умеет правильно строить форекс канал и формирует классическую стратегию торговли, прост в исполнении, поэтому доступен даже новичкам. Ценовые каналы одинаково хорошо работают на любых торговых активах и таймфреймах, могут использоваться как самостоятельно, так и с дополнительным подтверждением от осцилляторов и рыночных объемов.
Если взглянуть на цену и попытаться выявить самые простые визуальные закономерности вы тут же увидите, что цена практически никогда не движется п

Индикатор Target Go отслеживает рыночный тренд с игнорируя резкие колебания рынка и шумы вокруг средней цены. Ловит тренд и показывает благоприятные моменты входа в рынок стрелками. Индикатор можно использовать как для пипсовки на мелких периодах, так и для долгосрочной торговли. Индикатор реализует разновидность технического анализа, основанную на идее о том, что рынок имеет циклическую природу.

Индикатор Trend Sikorsky содержит в себе целую торговую систему, обрабатывает информацию от нескольких технических инструментов и появление его сигналов это конечный результат расчета. Индикатор сам оценивает, насколько сильный сигнал возникает на рынке и когда изменить направление, сигнализирует об этом, а трейдеру остается только принять торговое решение. Данный индикатор работает на всех таймфреймах. Нужно понимать, что любой индикатор – это только визуальная форма сигнала. Валютные пары ник

Индикатор Risk Trend упрощает процесс принятия решений, распознавая развороты с помощью встроенного алгоритма, а затем подтверждает сигналы на уровнях поддержки/сопротивления. Реализует разновидность технического анализа, основанную на идее о том, что рынок имеет циклическую природу.
Таком образом индикатор отслеживает рыночный тренд с большой надежностью, игнорируя резкие колебания рынка и шумы вокруг средней цены. Индикатор можно использовать как для пипсовки на мелких периодах, так и для

Индикатор для Форекс Sinas можно использовать как для пипсовки на мелких периодах, так и для долгосрочной торговли. Он отслеживает рыночный тренд с игнорируя резкие колебания рынка и шумы вокруг средней цены. Ловит тренд и показывает благоприятные моменты входа в рынок стрелками. Индикатор реализует разновидность технического анализа, основанную на идее о том, что рынок имеет циклическую природу.

Индикатор Hrum - был создан для нейтрализации временных пауз и откатов. Он анализирует поведение цены и, если наблюдается временная слабость тренда, вы можите заметить это из показаний индикатора, как и в случае выраженной смены направления тренда. Войти в рынок не трудно, а вот удержаться в нем куда сложнее. С индикатором Giordano Bruno и его уникальной трендовой линией удержаться в тренде станет намного проще!
Каждый рост и каждое падение отражается и на вашем эмоциональном состоянии: надеж
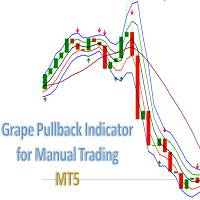
Indicador Grape Pullback for Manual Trading. Indicator (arrow) Type Strategy (Pullback) for all Symbols and Periodicity, Preferably from 30M periodicity. Can be used for manual trading. The indicator i s determined by strategies that is based on criteria for the location of candlesticks in the channel and for the Rsi and Market facilitation index indicators. Its workspace corresponds to channel of 3 bars of Bill Willians with a channel extension . BUY when there is a Green Arrow. StopLoss below

Let me introduce our ProfitPlotter indicator
We are developing a technical indicator best suited for analyzing trading performance. It can display statistics of all currency pairs and trades of different magic numbers categorized on the same chart. You can specify the time range, magic number, specific currency pairs or profit statistic curves of all currency pairs for analysis. You can also click to jump to order positions and view order details, which greatly improves the usage experience. Ma
Correlation value between two Symbols. A value of +1 means a complete positive correlation; A value of -1 means a complete inverse correlation; A value of 0 means there is no explicit correlation (prices do not depend on each other, or the correlation is random); My #1 Utility : includes 65+ functions | Contact me if you have any questions In the settings of the indicator, you can configure: Symbols (currency pairs) to be used in calculations.
Leave one value empty if you want one of the

Point and Plot: The Anchored VWAP with Channel Bands tool is designed for traders of all levels, from beginners to seasoned professionals. Point to the price level you want to anchor to, plot the horizontal line, and watch as this versatile tool transforms your trading approach. User-Friendly Interface : Navigate the tool effortlessly with a user-friendly interface that ensures you never miss a crucial detail. Real-Time Analysis : Make informed decisions in real time with dynamic data that upda

V-Flow is a Trading System that takes into account volume, flow and other factors to give a signal when to enter, hold and close a position. There are two trading modes: conservative and aggressive . CONSERVATIVE: In this mode, the system shows you when to trade by painting the graph according to the signal (buy or sell). After that, when the trend ends, the graph turns gray, indicating the time to exit the operation. However, if the histogram at the bottom still points to the same trend, it is
Simple alert system which will alert you on your mobile terminal, email and on the chart whenever RSI crosses below the overbought level or above the oversold level. Use this alert system, so you don’t have to watch the chart all day for the RSI levels to break.
INPUTS: 1. RSI Period- (Default is 14). Number of candles the RSI indicator will look back for the calculations. 2. OB Level- (Default is 70). This is the Overbought level or Upper level for the RSI indicator. 3.

Dr. Trend is based on Market Trend Detection. With this Indicator anybody can easily understand the Market Trend and Trade accordingly. It will be very very helpful to Trade perfectly and increase the Accuracy Level.
Recommendation: Use this Indicator along with my another Indicator --->>> Dr. Trend Alert ; Use this Indicator along with my another Indicator --->>> My PVSR <<<--- Click Here ; Good_Luck
It can be used for: All Pairs: Forex, Cryptocurrencies, Metals, Stocks, Indice

Visual guide which divides the 24 hours into three trading sessions. The default setting is to show Asian , London and New York sessions. But, the session start and end hours can be adjusted as required.
The indicator is useful to develop trading strategies by making it easy to see the market behavior during the three sessions.
Inputs Time Zone Start and End hours (Please provide values in HH:MM format, like 02:00, not like 2:00. Both the hours and minutes should have 2 digits) Time zone

Хотели бы вы знать какое влияние окажет экономическое событие на цену ? Что произойдет с рынком после наступления новостей? Как экономическое событие влияло на цену в прошлом? Этот индикатор поможет вам в этом. Вы любите технический анализ? Вам нравится изучать прошлое, чтобы предсказать будущее? Но, как думаете, что может быть важнее технического анализа, что могло бы улучшить технический анализ? Ну конечно же, это фундаментальный анализ! Ведь новости непосредственно влияют на рынок, а значит

The "Alligator" indicator is a powerful technical analysis tool designed to assist traders on the MetaTrader 5 (MT5) platform in identifying market trends and potential price reversal points. This indicator is based on a concept developed by Bill Williams, a renowned technical analyst in the world of trading. How the Indicator Works: The Alligator indicator operates by using three Moving Average (MA) lines with different periods. These three lines are: Jaws: This is a Moving Average line with a

The Trendline Automatic indicator is an advanced technical analysis tool specifically designed to assist traders in identifying critical levels in the financial markets through the automatic drawing of support and resistance trendlines on price charts. With its automatic capabilities, this indicator saves traders time and effort in analyzing price movements, allowing them to focus on making better trading decisions. Key Features : Automatic Drawing of Trendlines : This indicator allows traders t

"Таймченнел" представляет собой мощный и универсальный инструмент технического анализа, специально разработанный для трейдеров, которые хотят углубить и улучшить свою способность анализировать рынок и принимать более информированные решения по торговле. Основные характеристики и преимущества, которые вы упомянули, заслуживают внимания и могут быть ценными для серьезных трейдеров, стремящихся максимизировать свой потенциал на финансовом рынке. Вот некоторые ключевые моменты: Расширенный многоуро

Представляем Вам Volatility Doctor Compass – Ваш надежный проводник к прибылям на любом рынке!
Раскройте Секреты Вечных Математических Законов: Окунитесь в суть мастерства торговли с нашей уникальной технологией, укорененной в математических принципах, которые выходят за пределы каждого рынка. Хотя мы не раскрываем секреты, будьте уверены, эта инновация – ваш билет к непревзойденной надежности в любых рыночных условиях.
Революционная Двойная Функциональность: Представьте себе возможно

Этот индикатор отлично подходит для торгов на множестве различных пар. Сам индикатор использует математические модели дополненной точности, но пока они оптимизированы под некоторые валютные пары. Множество настроек можно настраивать в начальных настройках .Имеються множество значков, для визуализации . Свое решение он отображает на графике в различных значков. Значки бывают нескольких видов. В тестере работает отлично по умолчанию в настройках. Он по умолчанию уже настроен. Удачных торгов.

The Session Volume Profile indicator displays the distribution of trade volume across price levels for a specific trading session. It visualizes areas of high and low trading activity, helping traders identify support and resistance zones. The profile's peak, known as the Point of Control (POC), represents the price with the highest traded volume.
The inputs of the indicator:
volumeBars(Row Size) : Determines the number of price bins or rows for the volume profile. A larger number results in

Introducing Candle Feeling Indicator for MetaTrader 5 - Your Ultimate Solution for Accurate and Timely Analysis! Built with more than two decades of programming experience, this indicator allows you to follow the complexities of financial markets with confidence and accuracy.
Key Features: High Precision: Identifies trend reversals with unparalleled accuracy, ensuring you stay ahead of market shifts. Analysis: All the information you need from the structure of a candle Beautiful appearance

Gold Venamax – это лучший биржевой технический индикатор. Алгоритм индикатора анализирует движение цены актива и отражает волатильность и потенциальные зоны для входа.
Особенности индикатора: Это супер индикатор с Magic и двумя Блоками трендовых стрелочников для комфортной и профитной торговли. Красная Кнопка переключения по блокам выведена на график. Magic задается в настройках индикатора, так чтобы можно было установить индикатор на два графика с отображением разных Блоков. Gold Venamax можн

Индикатор Market Structures Pro находит и показывает на графике 5 (пять) паттернов системы Smart Money Concepts (SMC) , а именно: Break Of Structures (BoS) Change of character (CHoCH) Equal Highs & Lows Premium, Equilibrium and Discount зоны с сеткой Фибо
High-high, Low-low, High-low and Low-high экстремумы Паттерны отображаются для двух режимов - Swing и Internal и легко различаются цветом на график. Для режима Internal выбраны более контрастные цвета, более тонкие линии и меньший размер

The " Market Session Times " indicator shows the time of four trading sessions: Asia, Europe, America and Pacific. The time of trading sessions is set in the format GMT and thus does not depend on the trading server at all. The following data is used: Trading Session
City
GMT
Asia Tokyo
Singapore
Shanghai 00:00−06:00
01:00−09:00
01:30−07:00 Europe London
Frankfurt 07:00−15:30
07:00−15:30 America New York
Chicago 13:30−20:00
13:30−20:00 Pacific Wellington
Sydney 20:00−0

The bullet indicator gives accurate direction of the market structure, it will indicate to you the exact direction whether it be the market is in a downtrend or if it's in an uptrend it will give you that information which will inturn benefits you by saving you the time it takes to analyse that structure, this indicator works on a timeframes and it's most favourable on higher timeframes.
How it works: -The green arrow will be at the support of the structure indicating buys -The red arrow will

Индикатор Delta Book - это мощный инструмент анализа рынка, который объединяет использование дельты объема с информацией из стакана (order book), чтобы обнаруживать движение цен на финансовых рынках, таких как акции, фьючерсы и криптовалюты. Важно отметить, что для максимальной эффективности индикатора Delta Book необходим доступ к данным о объеме в реальном времени и информации о стакане заявок. Основной характеристикой Delta Book является его продвинутая стратегия анализа рынка, которая позвол
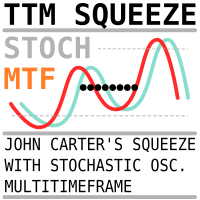
Тот же индикатор, который опубликован здесь https://www.mql5.com/ru/market/product/105645?source=Site+Market+My+Products+Page , но вместо MACD используется Стохастический осциллятор. Индикатор может быть полезен для поиска возможности открытия позиции по Моментуму множественных таймфреймов - методу, описанному Робертом Майнером в его книге "Торговые стратегии с высокой вероятностью успеха". Настройки говорят сами за себя Period - таймфрейм, для которого рассчитывается индикатор. При использов

This is not a conventional Moving Average Indicator. With this indicator, you can fully costumize your moving average. You can select the "Source" Price (not only the standard prices that come with Metatrader), "Period" of it, and the "Smooth" Calculation that you want to apply. There are many of them, such as SMA (Simple Moving Average), SMMA (Smoothed Moving Average), EMA (Exponential Moving Average), DEMA (Double Exponential Moving Average), TEMA (Triple Exponential Moving Average) and LWMA (

Мы рады представить индикатор "Все в одном" под названием
Top Breakout Indicator MT5
Этот индикатор был разработан командой с многолетним опытом торговли и программирования.
Канал MQL5: https://www.mql5.com/en/channels/diamondscalping Телеграм-канал: https://t.me/autoprofitevery MT4: https://www.mql5.com/en/market/product/107044?source=Site+Market+Product+Page
С помощью этого одного индикатора вы можете одновременно торговать и управлять своим счетом с легкостью. Индикатор включает

GG TrendBar Indicator - Your Multitimeframe ADX Trading Solution Experience the power of multi-timeframe trading with the "GG TrendBar MT5 Indicator." This versatile tool, built upon the ADX indicator, offers precise insights by considering multiple timeframes, ensuring you make well-informed trading decisions. Basic Details : Indicator Type : GG TrendBar Indicator (Multi-Timeframe ADX) Key Metrics : Real-time ADX analysis across multiple timeframes. Customization : Enable or disable specific ti

LuXiwu Trend Trading special wave marking tool
0.Main table show hide Click the bottom 10% area of price axis to show or hide main table,or by default key Q.
1. QJT search Click the high or low point of the main wave to automatically find the QJT . If there is overlap between the inner and outer intervals, click the button << or >> to adjust the left and right, or manually drag the adjustment after completion.If there is a failure wave, you can use the system's own trend line to draw the

Unlock the Power of Scalping with this Essential Indicator for Any Currency Pair! Experience Crystal-Clear Buy/Sell Signals and Activate Instant Alerts for Maximum Precision.
Introducing the Ultimate Scalping Companion: Your Key to Precision Profits! Transform Your Trading Strategy with an Indicator that Stands the Test of Time! In the ever-evolving world of trading, consistent success hinges on smart risk management . While no tool can be the holy grail, our non-repainting indicator is a

Scalper Dynamic Pivot detects respectable narrow reversal areas that can be used to mark repeatable opportunity windows. Originally made for M1 timeframe and targeting M30 using EMA200.
Setup/inputs:
First, set one pip on price, e.g. EURUSD to 0.0001, USDJPY to 0.01, or XAUUSD to 0.1. Set minimum and maximum range on pips, if you want scalp between 10 to 20 pips then set it to 10 and 20 respectively. Set moving average length to be used as pivot baseline. To use M30 with EMA200 please use M

Форекс индикатор Double Stochastic RSI – это модификация осциллятора Стохастик для платформы MetaTrader 5.
ИНФОРМАЦИЯ О ИНДИКАТОРЕ В форекс индикаторе Double Stochastic реализован двойной Стохастик, примененный к RSI, с применением плавающих уровней вместо фиксированных для оценки перепроданности и перекупленности. В случаях, когда период RSI <=1, вы получаете просто двойной Стохастик. Можно использовать дополнительное сглаживание результатов (для этого используется встроенная EMA). Досту

Форекс индикатор Psychological Oscillator MT5 – это отличная модификация классического осциллятора, который поможет вам в трейдинге для MetaTrader 5.
ИНФОРМАЦИЯ О ИНДИКАТОРЕ Форекс индикатор Psychological Oscillator MT5 представлен в виде цветной гистограммы и обладает всеми качествами осцилляторов форекс. Также присутствуют зоны, когда и в каких зонах находится рынок. Все сделано просто и максимально ясно, чтобы все трейдеры смогли в нем разобраться без всяких трудностей.
КАК ПОЛЬЗОВА

The GGP Squeeze Momentum MT5 Indicator is a volatility and momentum tool designed to help traders optimize their trading performance and providing traders with actionable insights to make well-informed trading decisions. This indicator is MT5 conversion of the Squeeze Momentum Indicator by “LazyBear “ in Trading View website and some alert methods are added to provide real-time alerts when a trading signal is generated, in order to allow traders to act quickly and efficiently. For MT4 version pl

The GGP Williams Vix Fix MT5 Indicator is based on the volatility of the market and grants a huge support for finding out when a correction is coming to end. This indicator is MT5 conversion of the CM_Williams_Vix_Fix Finds Market Bottoms Indicator by “ChrisMoody “ in Trading View website and some alert methods are added to provide real-time alerts when a trading signal is generated, in order to allow traders to act quickly and efficiently. For MT4 version please click here . Larry Williams Deve

Draw as many custom candles as possible on a single chart with this special indicator. Your analysis skill will never be the same again for those who know the power that having a hawkeye view of all price action at once provides. Optimized for performance and allows customization on the appearance of candle bodies and wicks. This is an integral part of analysis at our desks, we hope it will never leave your charts too once you can use it to its full potential.
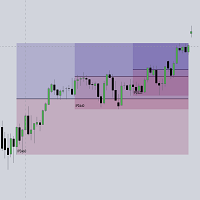
This script automatically calculates and updates ICT's daily IPDA look back time intervals and their respective discount / equilibrium / premium, so you don't have to :) IPDA stands for Interbank Price Delivery Algorithm. Said algorithm appears to be referencing the past 20, 40, and 60 days intervals as points of reference to define ranges and related PD arrays. Intraday traders can find most value in the 20 Day Look Back box, by observing imbalances and points of interest. Longer term traders c
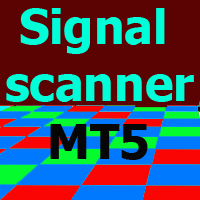
Сканер предназначен для сканирования сигнальных буферов индикаторов (стрелок) и вывода на панель в цветном виде и цифровом отображении ближайшего сигнального бара. Задаются символы для сканирования, таймфреймы и количество сканируемых баров, начиная с текущего (0-го) бара. Так же имеется комплексный сигнал, в котором указывается список таймфремов, на которых должен совпасть сигнал индикатора. Можно свернуть индикатор щелчком левой кнопки мыши по левому верхнему углу панели (названию) и разве

The GGP Wave Trend Oscillator MT5 Indicator is a volatility and momentum tool designed to help traders optimize their trading performance and providing traders find the most accurate market reversals. This indicator is MT5 conversion of the Indicator: WaveTrend Oscillator [WT] by “ LazyBear “ in Trading View website and some alert methods are added to provide real-time alerts when a trading signal is generated, in order to allow traders to act quickly and efficiently. When the oscillator is abov
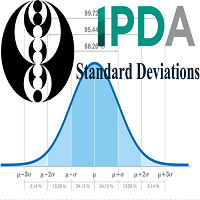
> Introduction and Acknowledgements
The IPDA Standard Deviations tool encompasses the Time and price relationship as studied by Dexter's . I am not the creator of this Theory, and I do not hold the answers to all the questions you may have; I suggest you to study it from Dexter's tweets, videos, and material. > Tool Description This is purely a graphical aid for traders to be able to quickly determine Fractal IPDA Time Windows, and trace the potential Standard Deviations of the moves at thei

This Indicator represents the standard Heikin Ashi Candle converter from normal candles. They are applied on a different chart, so you can identify easily both prices. You can also change candles to your favourite colours. If you want to, you can use this indicator into an iCostum, so you can apply other indicators over this on, because there are excellent indicators combined with this type of candles

Khotite maksimizirovat' svoyu pribyl' i bystreye dostich' svoikh tseley? Potomu chto prismotrites' k nashemu ob"yemnomu profilyu. Potomu chto graficheskoye predstavleniye raspredeleniya ob"yema pozvolyayet legko uvidet' raspredeleniye i sdvig obshchego ob"yema. Eto, nesomnenno, privodit k uluchsheniyu sdelok i znachitel'no uvelichiva doch vashu proizvoditel'nost'. Blagodarya nashemu moshchnomu profilyu ob"yema, kotoryy nikoim obrazom ne ogranichivayet skorost' i effektivnost' Metatrader 5, vy m

The GGP ADX and DI MT5 Indicator is used to quantify trend strength. ADX calculations are based on a moving average of price range expansion over a given period of time. This indicator is MT5 conversion of the ADX and DI Indicator by “BeikabuOyaji “ in Trading View website and some alert methods are added to provide real-time alerts when a trading signal is generated, in order to allow traders to act quickly and efficiently. For MT4 version please click here . ADX is plotted as a single line wit
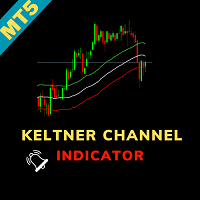
Keltner Channel Indicator for MetaTrader 5 - Precision in Every Trade Unlock precision in your trading with the "Keltner Channel Indicator" tailored for MetaTrader 5. This powerful tool, based on Chester Keltner's work, offers you unparalleled insights into price volatility, helping you make well-informed trading decisions. Basic Details : Indicator Type : Keltner Channel Indicator for MetaTrader 5 Key Metrics : Real-time analysis of price volatility and trend identification. Customization : Ful

Squeeze Momentum Indicator for MetaTrader 5 - Unleash the Power of Market Momentum Introducing the "Squeeze Momentum Indicator" for MetaTrader 5, your gateway to mastering market momentum. This advanced tool is meticulously crafted to provide you with actionable insights into market dynamics, helping you make well-informed trading decisions. Basic Details : Indicator Type : Squeeze Momentum Indicator for MetaTrader 5 Key Metrics : Real-time analysis of market momentum and volatility. Customizati

Directional Volatility and Volume Oscillator for MetaTrader 5 - Master Market Dynamics Discover the power of precision trading with the "Directional Volatility and Volume Oscillator" meticulously designed for MetaTrader 5. This advanced tool combines the insights of directional analysis, volatility measurement, and volume tracking to provide you with unparalleled market understanding. Basic Details : Indicator Type : Directional Volatility and Volume Oscillator for MetaTrader 5 Key Metrics : Rea
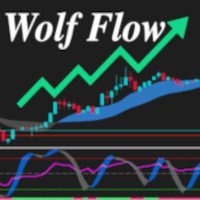
The Wolf Flow Indicator for MetaTrader 5 is the perfect solution for traders looking for instant clarity and precision in their market analysis. Simple to use and immediate to view, this tool offers you a complete overview of market dynamics in a single glance.
Strengths:
Absolute Simplicity: A clean and intuitive interface guarantees effortless use, even for less experienced traders. I mmediate and Rapid: Key data is presented in real time, allowing you to make instant decisions with

To get access to MT4 version please click here . Also you can check this link . This is the exact conversion from TradingView: "UT Bot" by "Yo_adriiiiaan". This is a light-load processing indicator. This is a non-repaint indicator. Buffers are available for processing in EAs. All input fields are available. You can message in private chat for further changes you need. Thanks for downloading
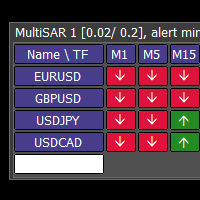
This tool monitors Parabolic SAR indicators on all time frames in the selected markets. Displays a table with signals to open a BUY trade (green) or SELL trade (red). You can easily add or delete market names / symbols. If the conditions for opening a trade on multiple time frames are met, you can be notified by e-mail or phone message (according to the settings in MT5 menu Tools - Options…) You can also set the conditions for sending notifications. The list of symbols/ markets you have entered

If you need more information than a few numbers in the iExposure index, this indicator is for you.
Better iExposure indicator is an improvement over the original information, such as:
Separate profit column for BUY and SELL Separate SL column for BUY and SELL Separate TP column for BUY and SEL Average Price as Horizontal Line in Chart Pip Value Profit https://www.facebook.com/groups/prop4y
iExposure will show the opening of trading positions in tabular form in the sub-window below the mai
А знаете ли вы, почему MetaTrader Market - лучшее место для продажи торговых стратегий и технических индикаторов? Разработчику у нас не нужно тратить время и силы на рекламу, защиту программ и расчеты с покупателями. Всё это уже сделано.
Вы упускаете торговые возможности:
- Бесплатные приложения для трейдинга
- 8 000+ сигналов для копирования
- Экономические новости для анализа финансовых рынков
Регистрация
Вход
Если у вас нет учетной записи, зарегистрируйтесь
Для авторизации и пользования сайтом MQL5.com необходимо разрешить использование файлов Сookie.
Пожалуйста, включите в вашем браузере данную настройку, иначе вы не сможете авторизоваться.